Di Napoli MACD MT5
- Indicadores
- Versión: 1.1
- Actualizado: 13 mayo 2023

Estudio no propietario de Joe Dinapoli utilizado para el análisis de tendencias. El indicador emite señales de tendencia cuando la línea rápida penetra en la línea lenta. Estas señales permanecen intactas hasta que se produce otra penetración. La señal se confirma al cierre del periodo. Es aplicable a todos los marcos temporales.
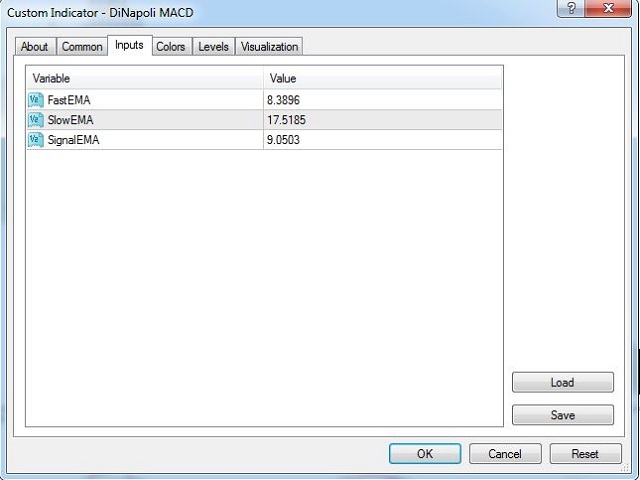
Parámetros
- EMA rápida: periodo de la media móvil rápida.
- EMA lenta: periodo de la media móvil lenta.
- Signal EMA: periodo de la línea de señal.
********************************************************************************
Si desea conocer el cambio de tendencia MACD una cabeza de tiempo con Dinapoli más popular indicador de predicción MACD;
Por favor, visite ► https://www.mql5.com/en/market/product/52623
¡¡¡Usted ya no necesita monitorear standart indicador MACD !! !
*********************************************************************************
Para Dinapoli MACD Dashboard Scanner;
Por favor, visite ► https://www.mql5.com/en/market/product/52813
*********************************************************************************
Para Mis Otros Productos;
Por favor visite►https://www.mql5.com/en/users/samil34
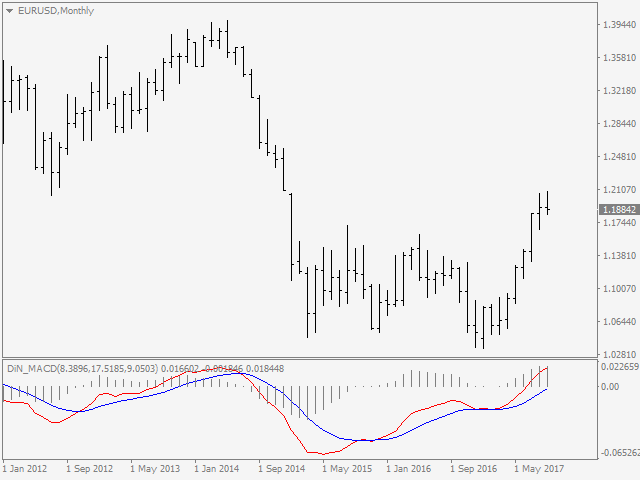
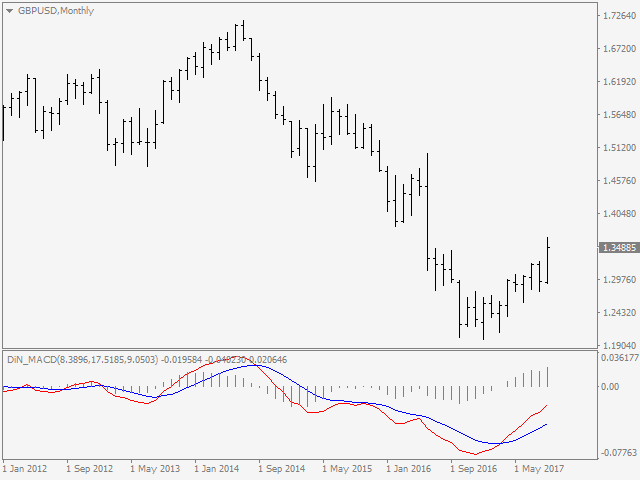


Legit Dinapoli MACD. Comparable with other popular Dinapoli MACD I've seen on TradingView