Di Napoli Squat MT5
- Indikatoren
- Version: 1.1
- Aktualisiert: 1 Mai 2023
- Aktivierungen: 15

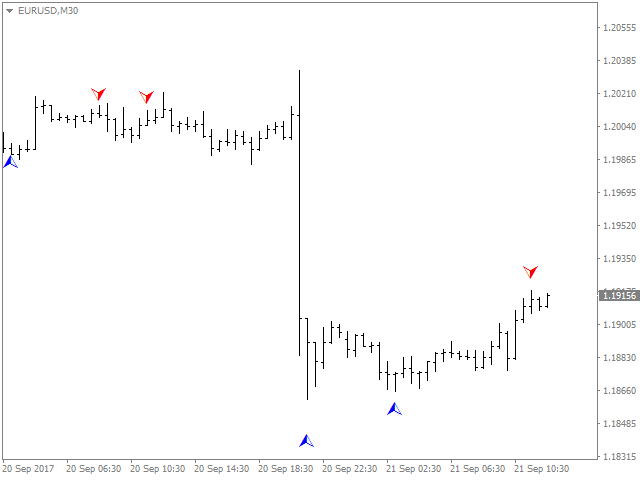
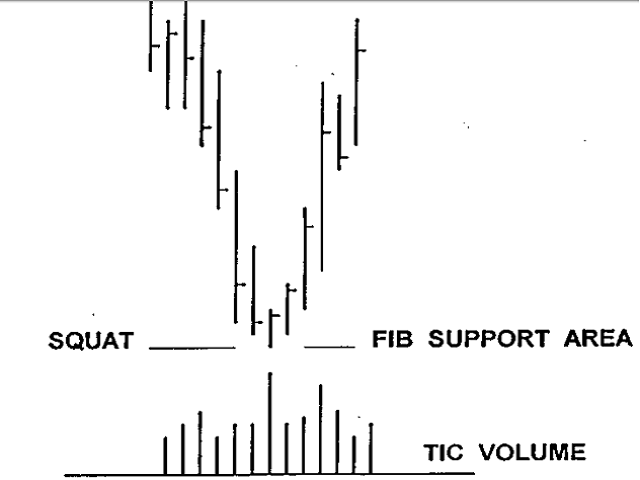
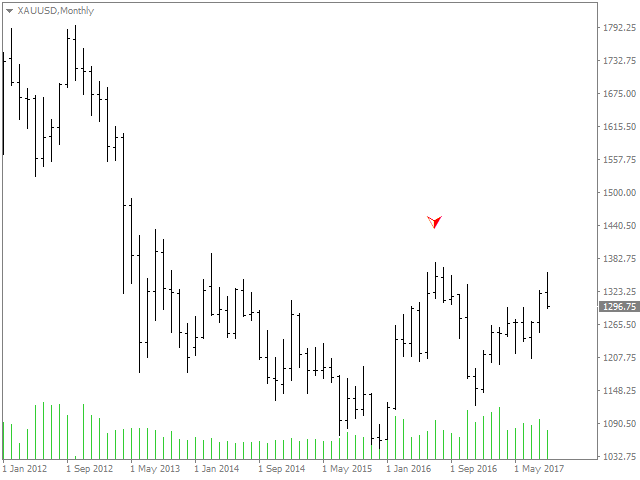
Der Squat ist eine Funktion der Spanne eines bestimmten Kursbalkens und des Volumens oder TIC-Volumens, das auftritt, während diese Spanne gebildet wird. Der Grundgedanke ist, dass ein hohes Volumen und eine geringe Preisbewegung auf eine wesentliche Unterstützung oder einen Widerstand hinweisen. Die Idee hinter dem Ansatz dieses Indikators ist es, zunächst nach wahrscheinlichen Fibonacci-Unterstützungen und -Widerständen zu suchen und dann zu sehen, ob sich Squat manifestiert, wenn dieser Punkt erreicht wird. Der Indikator bestimmt eines der höchstwahrscheinlichen DiNapoli-Muster. Er malt nicht nach.
SQUAT - größeres Volumen und ein kleinerer MFI als der vorherige Balken.
- MFI: rb/v
- rb: Bereich des Balkens in Ticks oder Punkten
- v: Volumen
Marktein- und -ausstiegstechniken nach dem Signal
- Einstieg: Zuerst flacher Rücklauf auf niedrigeren Zeitrahmen, dann Zeitrahmen des Squat-Signals (je nach Trader)
- Stop: Unterseite des Balkens, in dem das Squat-Signal auftrat (je nach Händler)
- Gewinn mitnehmen: Abhängig von den Money-Management-Techniken des Händlers (Entscheidung des Händlers)
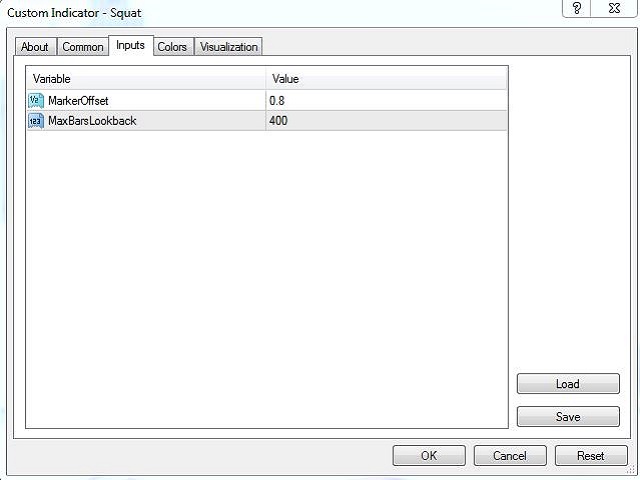
Parameter
- Marker Versatz: Einstellen der Anzeigeposition des Signals auf dem Chart
- Max Bars Rückblick: Stellen Sie die Anzahl der Bars ein, auf die der Indikator zurückblicken soll.
Für die MT4-Version besuchen Sie bitte ► https://www.mql5.com/en/market/product/52777

Der Benutzer hat keinen Kommentar hinterlassen