Stop Grabber Pattern MT5
- Indikatoren
- Version: 1.1
- Aktualisiert: 13 Mai 2023
- Aktivierungen: 15

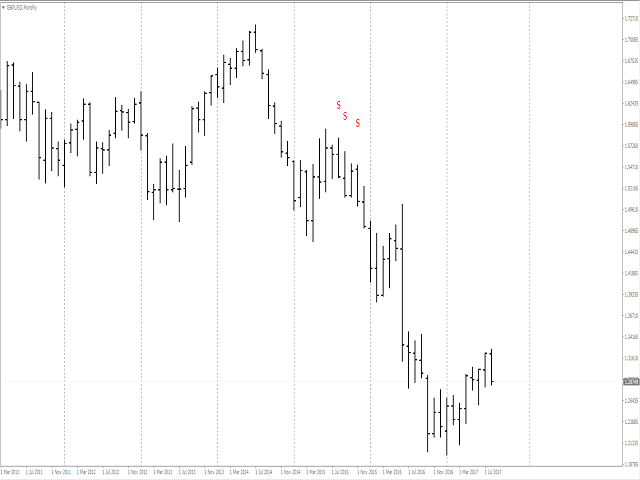
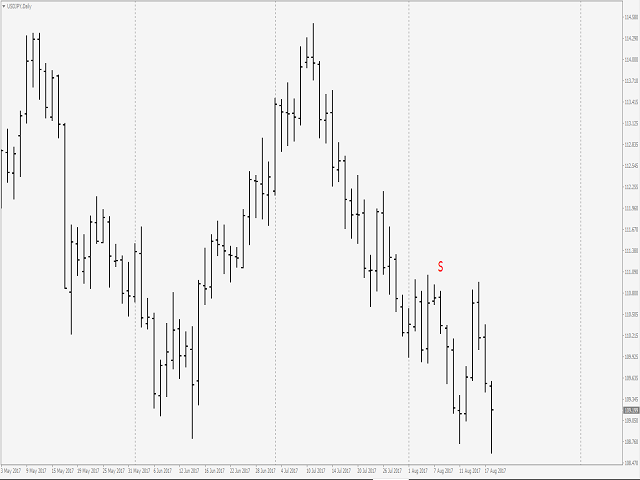
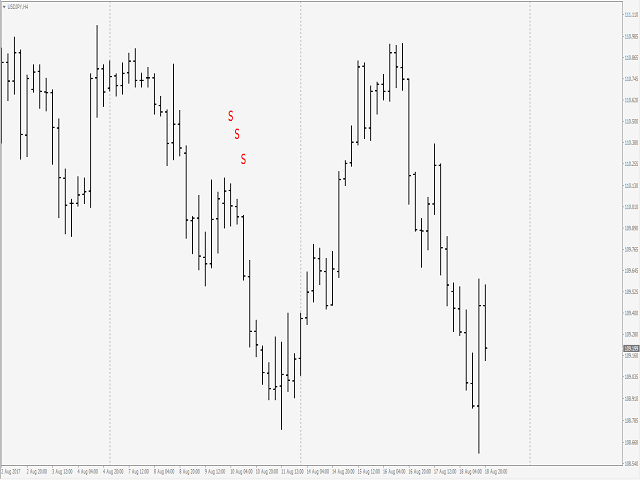
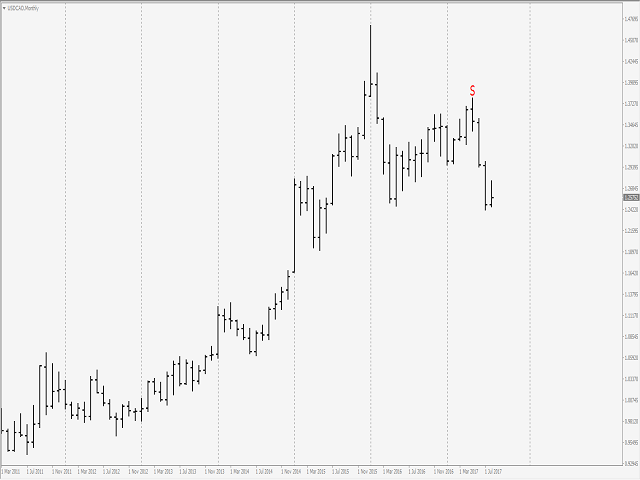
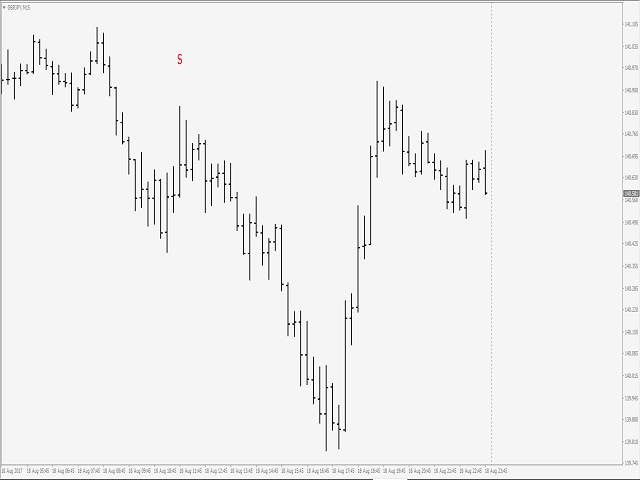
Der Indikator bestimmt ein spezielles Muster von Joe Dinapoli. Er gibt mit sehr hoher Wahrscheinlichkeit Kauf- und Verkaufssignale. Der Indikator malt nicht neu.
Verwendung des Indikators
- Kaufsignal ''B''
- Einstieg: Marktkaufauftrag bei Signalbalkenschluss
- Stop: Tiefststand des Signalbalkens
- Gewinnmitnahme: Erstes Swing-Hoch
- Verkaufssignal ''S''
- Eingabe: Markt-Verkaufsorder bei Schließen des Signalbalkens
- Stop: Höchststand des Signalbalkens
- Gewinnmitnahme: Erstes Swing-Tief
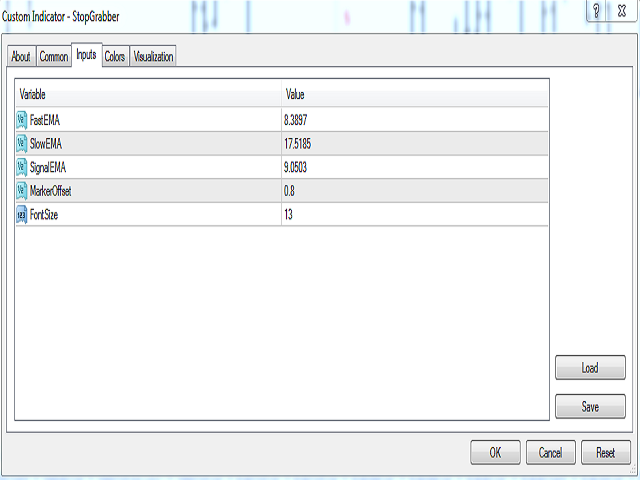
Parameter des Indikators
- Fast EMA: Externer Parameter (sollte als Standardwert beibehalten werden)
- Slow EMA: Externer Parameter (sollte als Standardwert beibehalten werden)
- Signal EMA: Externer Parameter (sollte als Standardwert beibehalten werden)
- Marker Versatz: Anpassen der Anzeigeposition des Signals im Chart
- Schriftgröße: Größe der Signalschrift auf dem Chart
Für Stop Grabber Dashboard Scanner; bitte besuchen Sie ► https://www.mql5.com/en/market/product/52776
Für die MT4-Version, besuchen Sie bitte ► https://www.mql5.com/en/market/product/52773


Legit Dinapoli Grabber - similar to the one used by SIve on FPA