OrderBook Cumulative Indicator
- Indikatoren
-
Stanislav Korotky
 Trading is just my hobby. I'm working in IT industry. So developement of experts, indicators, and script is not a problem at all to me. Wide range of technologies are used: MQL4, MQL5, system and applied programming, web-services, neural networks and more.
New: - Version: 1.4
- Aktualisiert: 27 Mai 2020
- Aktivierungen: 5
Orderbuch, auch bekannt als Marktbuch, Markttiefe, Level 2, - ist eine dynamisch aktualisierte Tabelle mit den aktuellen Volumina der Kauf- und Verkaufsaufträge für ein bestimmtes Finanzinstrument zu Preisen nahe Bid und Ask.
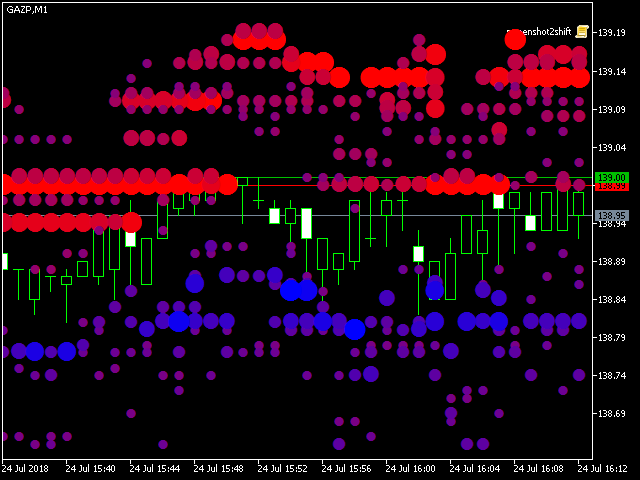
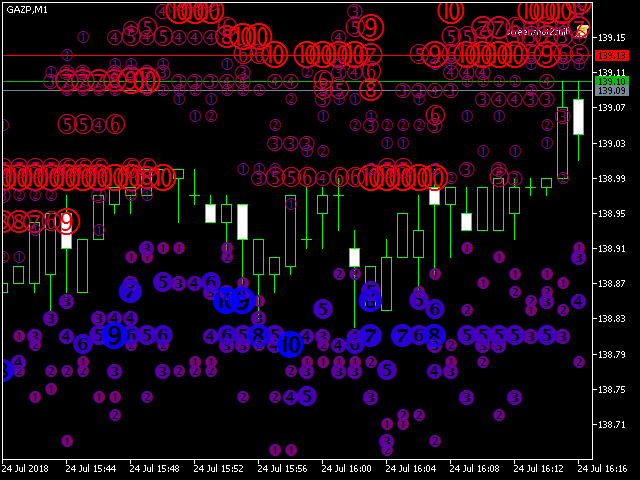
MetaTrader 5 bietet die Möglichkeit, das Marktbuch von Ihrem Broker zu erhalten, allerdings nur in Echtzeit und ohne Zugriff auf die Historie. Der Indikator OrderBook Cumulative Indicator akkumuliert die Marktbuchdaten online und stellt sie auf dem Chart dar. Darüber hinaus kann der Indikator das Marktbuch in der Historie anzeigen, indem er Archivdaten liest, die vom OrderBook Recorder erstellt wurden. Der Indikator basiert auf der Bibliothek OrderBook History Library, die in Ihren Experten oder Indikator eingebettet werden kann.
Die Archivdateien können im Datenordner des Terminals (in der Regel C:\Programme\MetaTrader 5 MetaQuotes\MQL5\Files) oder im gemeinsamen Datenordner für alle Terminals (z.B. 'C:\Users\<Benutzername>\AppData\Roaming\MetaQuotes\Terminal\Common\Files') gespeichert werden. In beiden Fällen wird innerhalb des Ordners ein weiterer Unterordner als Stammordner für alle Marktbücher verwendet, und der Name des Unterordners wird im Eingabeparameter OrderBook_FileFolder angegeben, standardmäßig - "Books". Innerhalb des Stammunterordners wird eine weitere Ebene von Unterordnern erstellt - jeder Unterordner entspricht einem bestimmten Arbeitssymbol, und die Daten jedes einzelnen Tages werden in einer Datei YYYYMMDD.hob gespeichert, wobei YYYY, MM, DD für Jahr, Monat und Tag stehen. Die Erweiterung "hob" steht für History of Order Book. Zum Beispiel erzeugt der Ticker GAZP die Dateien MQL5/Files/Books/GAZP/*.hob.
Parameter
- ShowHistory - eine Option, um die Ansicht des Orderbuchs in der Historie zu aktivieren, basierend auf dem Archiv; standardmäßig ist false - deaktiviert, d.h. der Indikator sammelt und zeigt Online-Daten an;
- ShowHistoryFrom - ein Datum, ab dem die Suche in den Archiven bei der Anzeige von Marktbüchern in der Historie beginnen soll (wenn ShowHistory aktiviert ist);
- CharCode - ein Zeichencode zur Anzeige der Indikatorzeichen; es kann ein beliebiges Symbol aus der Wingdings-Schriftart oder -1 sein; standardmäßig -1, was bedeutet, dass numerische Aufzählungszeichen mit Werten von 1 bis 10 angezeigt werden, die die relative Größe des Volumens angeben;
- AveragingPeriod - ein Zeitraum für die Mittelwertbildung der Werte aus dem Marktbuch unter Verwendung des exponentiellen gleitenden Durchschnitts, kontinuierlich; standardmäßig - 0, was bedeutet, dass die Akkumulation und Mittelwertbildung der Daten für jeden Balken separat durchgeführt wird; wenn ein Balken abgeschlossen ist, werden die vorherigen Statistiken verworfen und die Volumina werden von Grund auf gemittelt;
- OrderBook_FileFolder - Name des Stammordners, in dem Unterordner und Dateien der Marktbücher gespeichert werden; standardmäßig - "Books"; jeder Unterordner wird nach einem bestimmten Arbeitssymbol benannt;
- OrderBook_UseCommonFiles - eine Option für das Lesen von Dateien aus dem Datenordner des aktuellen Terminals (false, standardmäßig) oder aus dem gemeinsamen Datenordner für alle Terminals (true); verwenden Sie den gemeinsamen Ordner für Tests im lokalen Testgerät;
- OrderBook_TimeZoneCorrection - eine Korrektur von Datum und Uhrzeit, die erforderlich ist, wenn Archive in einem Terminal mit einer Zeitzone gelesen werden, die sich von der Zeitzone des Terminals, in dem die Archive erstellt wurden, unterscheidet; wird in Sekunden angegeben; z.B. wenn das Marktbuch mit der Serverzeit in GMT+3 gespeichert wurde und dann auf Kurse von einem Server angewendet wird, auf dem die Zeit in GMT+2 ist, sollte die Korrektur 1 Stunde (-3600 Sekunden) betragen, da Zeiten in GMT+2 im Vergleich zu (d.h.d. h. sie sind 1 Stunde kleiner als) GMT+3; 15:00 in GMT+3 ist 14:00 in GMT+2;


Excellent tool.