VolumeDeltaBars
- Indikatoren
-
Stanislav Korotky
 Trading is just my hobby. I'm working in IT industry. So developement of experts, indicators, and script is not a problem at all to me. Wide range of technologies are used: MQL4, MQL5, system and applied programming, web-services, neural networks and more.
New: - Version: 1.7
- Aktualisiert: 19 November 2021
- Aktivierungen: 5
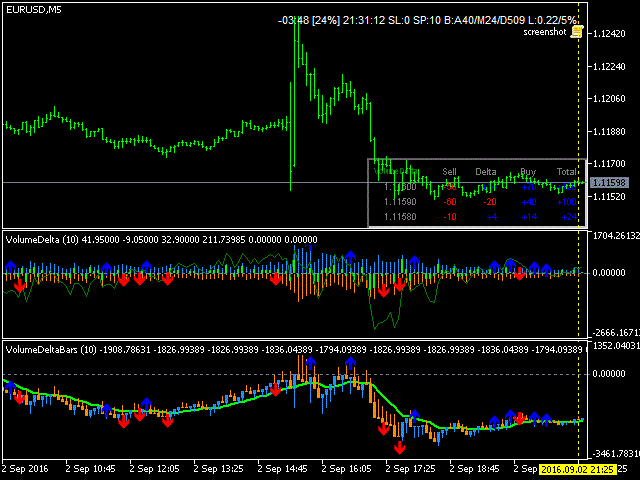
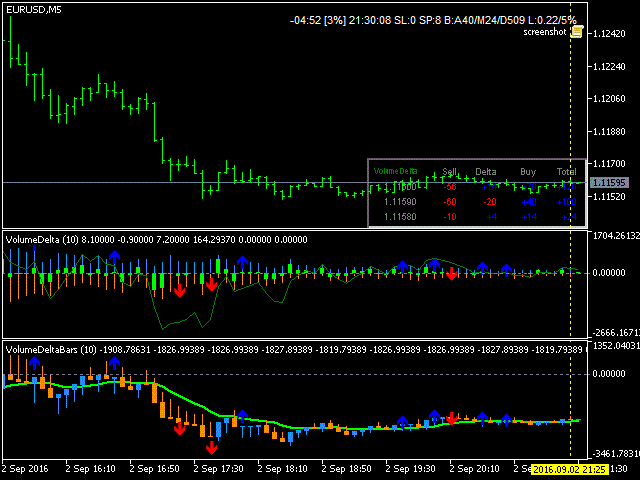
Dieser Indikator ist ein herkömmliches Analyseinstrument für Tick-Volumenänderungen. Er berechnet die Tick-Volumina für Käufe und Verkäufe separat sowie deren Delta für jeden Balken und zeigt die Volumina nach Preisclustern (Zellen) innerhalb eines bestimmten Balkens (in der Regel des letzten Balkens) an. Der intern verwendete Algorithmus ist derselbe wie beim Indikator VolumeDeltaMT5, aber die Ergebnisse werden als kumulative Volumen-Delta-Balken (Candlesticks) angezeigt. Ein analoger Indikator für MetaTrader 4 existiert - CumulativeDeltaBars.
Der Indikator zeigt die folgenden Daten in seinem Unterfenster an:
- hellblaue Balken: das Kaufvolumen (Long) übersteigt das Verkaufsvolumen, der Kerzenkörper ist das Volumen-Delta;
- orangefarbene Balken: Das Verkaufsvolumen (Short) übersteigt das Kaufvolumen, der Kerzenkörper ist das Volumen-Delta;
- hellgrüne Linie - kumulatives Delta, EMA des Volumen-Deltas unter Verwendung der offenen Werte;
- blaue und rote Pfeile - markieren die Balken, bei denen die Volumenrichtung der Preisrichtung widerspricht, was als Handelssignal betrachtet werden kann.
Außerdem kann der Indikator eine Tabelle der geteilten Volumina für den aktuellen Balken im Hauptfenster anzeigen. Der aktuelle Balken wird mit Hilfe der gelben gepunkteten vertikalen Linie ausgewählt (ziehen Sie sie an die gewünschte Position). Die Zeilen der Tabelle entsprechen den Preisclustern. Die Tabelle enthält die folgenden Spalten:
- Preis (eine Preisspanne vom angegebenen Wert bis zur nächsten Spanne);
- Verkaufsvolumen;
- Delta der Kauf- und Verkaufsvolumina (positive Werte sind blau, negative sind rot);
- Kaufvolumen;
- Gesamtvolumen (Zellen mit Werten nahe dem Maximalwert sind grün hervorgehoben).
Parameter
- PointsPerCell - Anzahl der Punkte, die ein einzelnes Preiscluster bilden; jedes Cluster wird als eine Zeile in einer Tabelle mit den aufgeteilten Volumina des aktuellen Balkens angezeigt (dies ist eine Art "Time and Sales"-Band); Standardwert - 10;
- LastBars - Anzahl der zu verarbeitenden Balken; Standardwert - 1000; 0 bedeutet alle Balken;
- CumulativePeriod - Periode für die Berechnung des kumulativen Deltas durch den EMA; Voreinstellung - 12;
- StickToBar0 - Aktivieren/Deaktivieren des speziellen Modus, bei dem die gelb gepunktete vertikale Linie immer am letzten Balken hängen bleibt, wodurch sie effektiv immer aktuell ist; Standardwert - false;
- Corner - Ecke des Hauptfensters, in der die Tabelle angezeigt werden soll; Standardwert - obere rechte Ecke;
- CellWidth - Breite der Tabellenzellen; Standardwert - 40;
- CellHeight - Höhe der Tabellenzellen; Voreinstellung - 15;
- ColorBG - Tabellenhintergrund; Standardwert - schwarz;
- FontSize - Schriftgröße in der Tabelle; Standardwert - 7;
- HideTable - blendet die Tabelle mit den aufgeteilten Volumina im Hauptfenster aus; standardmäßig - false;
- HideMark - blendet die Preismarke auf einer Clusterebene mit maximalem Volumen aus; standardmäßig - false; wenn sowohl HideTable als auch HideMark true sind, wird auch die vertikale Linie zur Auswahl eines untersuchten Balkens nicht angezeigt;
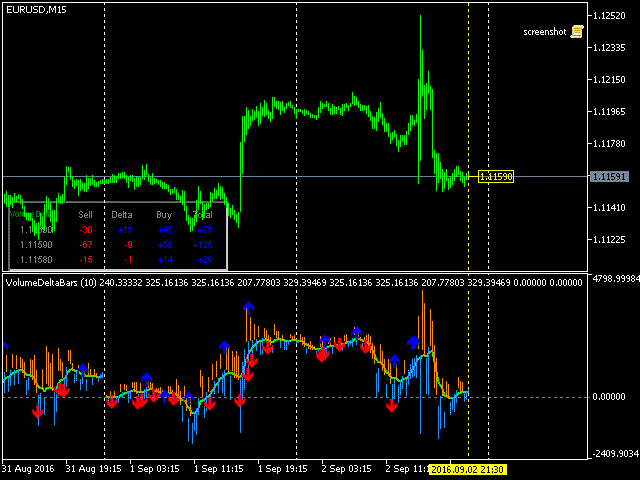
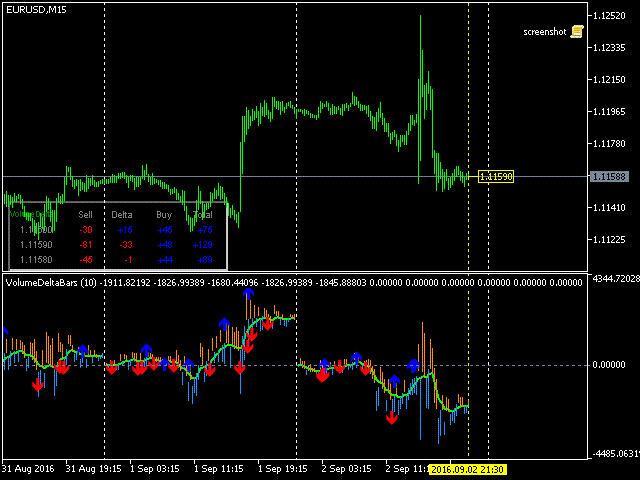
- SplitBy - Auswahl des Aufteilungsmodus, der den Zeitraum für das Zurücksetzen des kumulativen Deltas auf dem Candlestick-Chart definiert; verfügbare Optionen sind: Tag (standardmäßig), Woche, Monat;
- Schatten - Auswahl der Schattenmodi: kumulativ (standardmäßig) - Standardmethode zur Anzeige der maximalen und minimalen Veränderungen, diskret - spezielle Methode zur Anzeige des gesamten aufgeteilten Kauf- und Verkaufsvolumens.
Hinweise
Unterstützte Timeframes: M5 und höher.
Nach der ersten Platzierung auf einem Chart kann es einige Zeit dauern, bis der Indikator die M1-Daten heruntergeladen hat, und seine Linien können unvollständig angezeigt werden. Bitte warten Sie, bis der Indikator seine automatischen Aktualisierungen abgeschlossen hat.
Bildschirmfotos
Auf den Screenshots 1, 2, 3 (EURUSD M5) wird VolumeDeltaBars im unteren Teilfenster angezeigt, während das mittlere Teilfenster VolumeDeltaMT5 als Referenz enthält. Die Screenshots 4 und 5 zeigen den Indikator mit täglicher und wöchentlicher Aufteilung.