EvoLevels
- Indikatoren
-
Stanislav Korotky
 Trading is just my hobby. I'm working in IT industry. So developement of experts, indicators, and script is not a problem at all to me. Wide range of technologies are used: MQL4, MQL5, system and applied programming, web-services, neural networks and more.
New: - Version: 1.4
- Aktualisiert: 21 November 2021
- Aktivierungen: 5
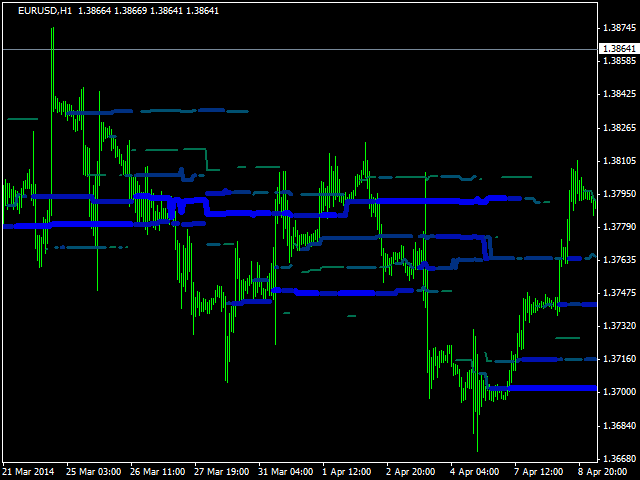
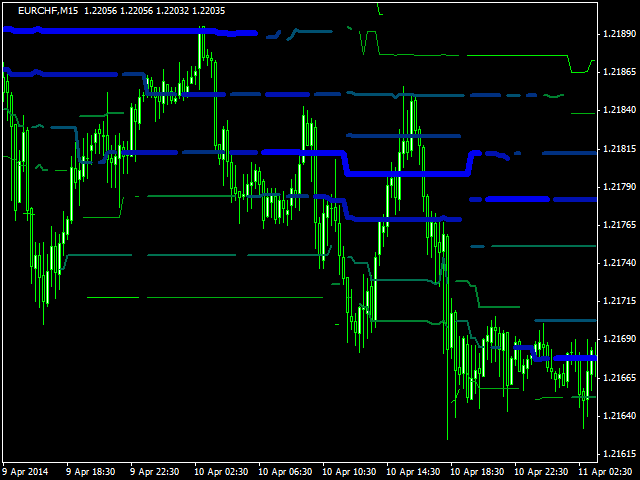
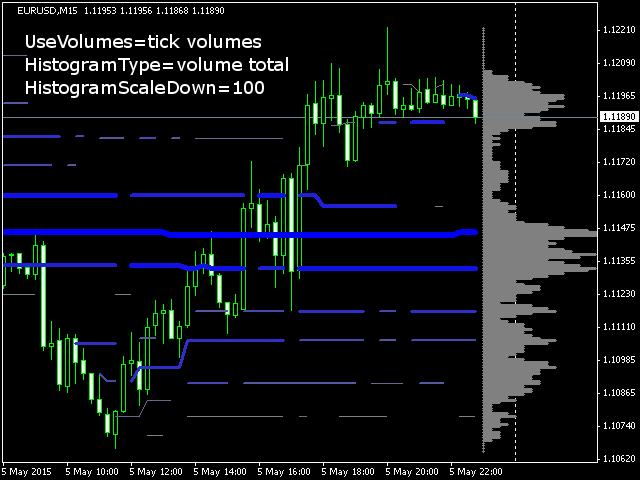
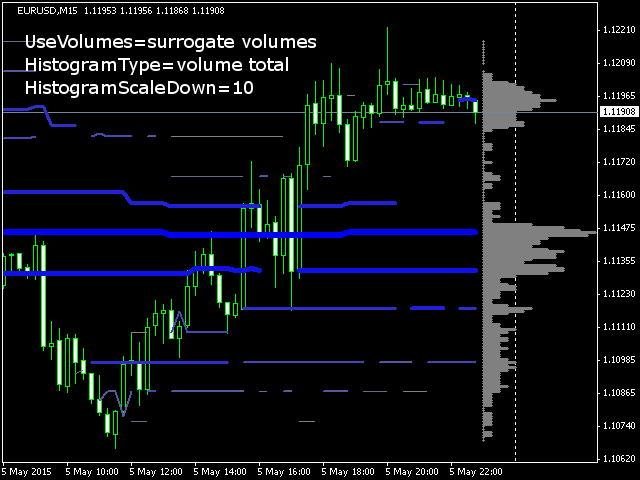
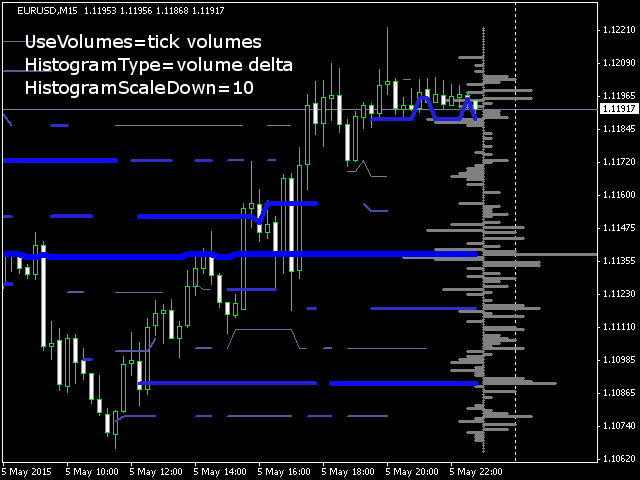
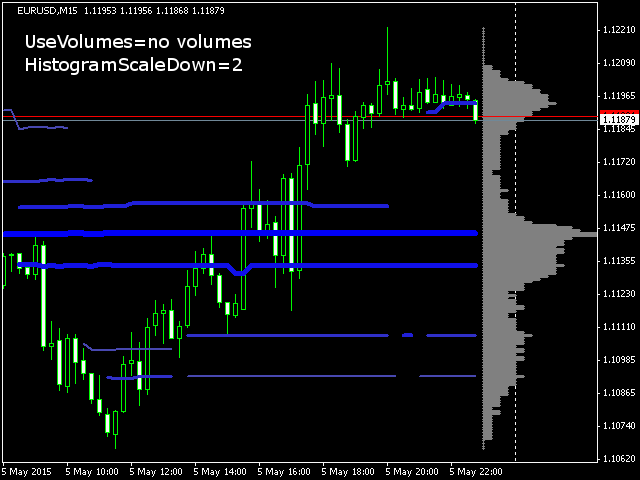
Der Indikator zeigt die auffälligsten Kursniveaus und ihre Veränderungen in der Vergangenheit an. Er erkennt dynamisch Regionen, in denen Kursbewegungen Attraktoren bilden, und zeigt bis zu 8 von ihnen an. Die Attraktoren können als Widerstands- oder Unterstützungsniveaus und äußere Grenzen für Kurse dienen.
Parameter:
- WindowSize - Anzahl der Balken im Schiebefenster, das für die Erkennung von Attraktoren verwendet wird; Standardwert ist 100;
- MaxBar - Anzahl der zu verarbeitenden Balken (zur Leistungsoptimierung); Standardwert ist 1000; wenn der Indikator von einem Experten aufgerufen wird, verwenden Sie 1;
- Shift - Nummer des Balkens, ab dem die Verarbeitung beginnen soll; Standardwert ist 0;
- MaxLevels - Anzahl der zu erkennenden Level, bis zu 8; Standardwert ist 5;
- DeltaPoints - minimale Breite jedes Attraktors in Punkten, d.h. nahe beieinander liegende Levels dürfen nicht näher als DeltaPoints/2 zueinander sein; Standardwert ist 200;
- StepPoints - Granularität der Preiswerte in den Berechnungen (zur Leistungsoptimierung); Standardwert ist 10;
- CleanUp - wenn true (Voreinstellung), werden Sprünge zwischen den Levels entfernt, wenn z.B. Level 1 zu Level 2 wird (d.h. seine Kraft verliert); verwenden Sie true für eine saubere Visualisierung; verwenden Sie false, wenn der Indikator von einem Experten aufgerufen wird;
- Farbe - Grundfarbe für die Stufen; Standard ist Blau.
Sie sollten abschätzen, welche WindowSize für den gewählten Zeitrahmen besser geeignet ist. Ändern Sie auch DeltaPoints, wie es für bestimmte Arbeitsinstrumente angemessen ist. Es wird empfohlen, StepPoints als Zehntel von DeltaPoints zu verwenden.