Mirror
- Indikatoren
-
Stanislav Korotky
 Trading is just my hobby. I'm working in IT industry. So developement of experts, indicators, and script is not a problem at all to me. Wide range of technologies are used: MQL4, MQL5, system and applied programming, web-services, neural networks and more.
New: - Version: 1.1
- Aktualisiert: 17 November 2021
- Aktivierungen: 5
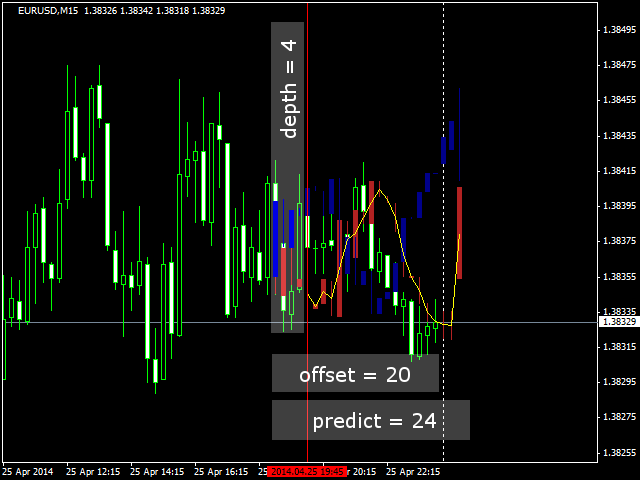
Dieser Indikator prognostiziert Kursänderungen auf der Grundlage des Prinzips der Chartdarstellung. Er geht davon aus, dass die Kursschwankungen aus einer "Aktions-" und einer "Reaktionsphase" bestehen, wobei die "Reaktion" mit der "Aktion" vergleichbar und ihr ähnlich ist, so dass sie durch Spiegelung vorhergesagt werden kann.
Der Indikator hat drei Parameter:
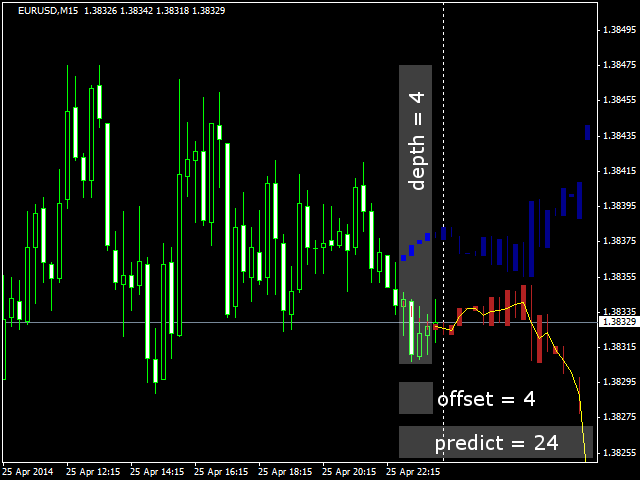
- predict - die Anzahl der Balken für die Vorhersage (standardmäßig 24);
- depth - die Anzahl der vergangenen Balken, die als Spiegelungspunkte verwendet werden; für alle Tiefen-Spiegelungspunkte wird ein MA berechnet und auf dem Chart gezeichnet; außerdem werden Tiefen-Balken für die Auswahl der geeigneten Spiegelungsmethode verwendet (siehe Details unten); Standard - 4;
- Offset - die Nummer des Balkens, an dem die Vorhersage beginnt; Standardwert - 4.
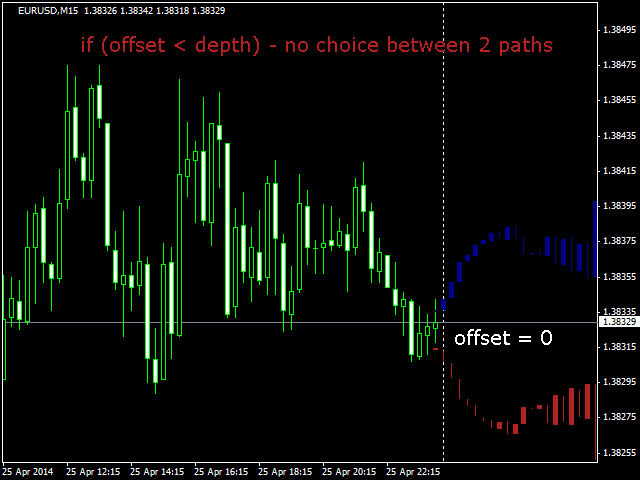
Wenn der Offset auf 0 gesetzt ist, zeichnet der Indikator eine Vorhersage, indem er einfach die letzten Vorhersagebalken in die Zukunft spiegelt. Wenn Sie Tiefe 1 einstellen, werden Sie sehen, dass die Vorhersage einfach die letzten Verlaufsbalken in Auf- und Abwärtsrichtung wiederholt. Wenn Sie z. B. Tiefe 4 wählen, wird die Vorhersage geglättet und ist allgemeiner, da sie als Durchschnitt der Spiegelung an den 4 aufeinanderfolgenden Balken berechnet wird.
Es gibt 2 Arten der Spiegelung: die vollständige Spiegelung des Charts entlang der Zeit- und der Preisachse und die Spiegelung nur an der Zeitachse. Die erste Variante wird in rot dargestellt, die zweite in blau. Der Indikator bietet die beste dieser Varianten nur an, wenn Offset >= Tiefe ist. Er verwendet die ersten Tiefenbalken jedes Spiegelungsmodus, um den quadratischen Fehler im Vergleich zu den realen Preisen derselben Balken zu berechnen. Der Modus mit dem kleinsten Fehler wird bevorzugt und ist als gelbe Kurve hervorgehoben. Wenn Offset < Tiefe ist, kann die Option Vorhersage nicht gewählt werden.
Die Standardwerte der Parameter bedeuten also, dass der Indikator mit der Vorhersage bei Takt 4(Offset) beginnt, dieselben 4 Takte(Tiefe) für die Bewertung jeder der beiden Methoden verwendet und die beste Option bei 20 Takten (24 Vorhersage - 4 Tiefe) anzeigt, die vollständig in der Zukunft liegen.
Sie können den Offset weiter in die Vergangenheit verschieben (ein Wert, der größer als die Tiefe ist), um die Leistung des Indikators in der Historie zu überprüfen.