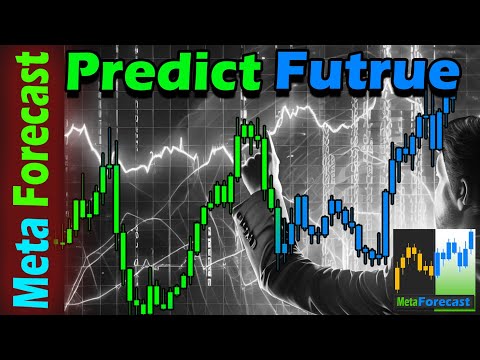
MetaForecast M5
- Indikatoren
-
Vahidreza Heidar Gholami
 I'm a software engineer with over 15 years of experience in programming and software development. As an active member of the MQL5 community, I strive to deliver high-quality products. My goal is to create efficient and productive tools for traders, and I have a wealth of innovative ideas to achieve
 - Version: 3.6
- Aktualisiert: 8 März 2025
- Aktivierungen: 10
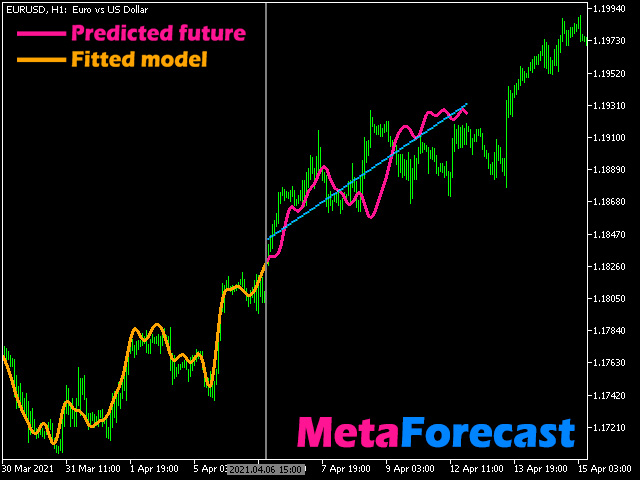
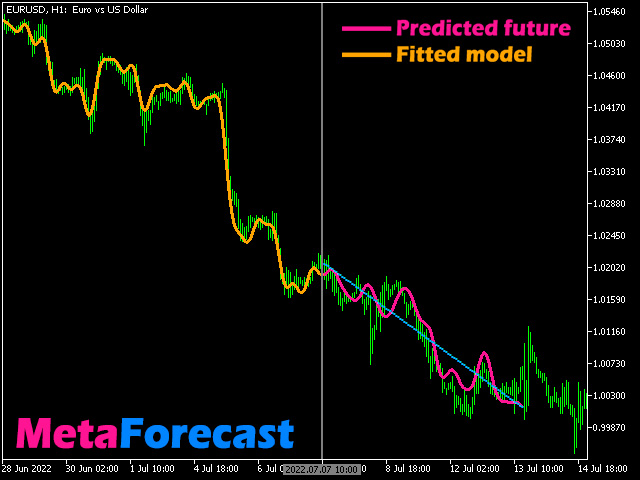
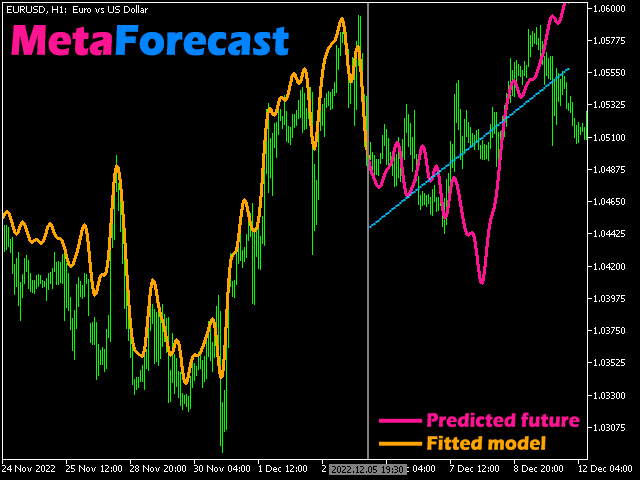
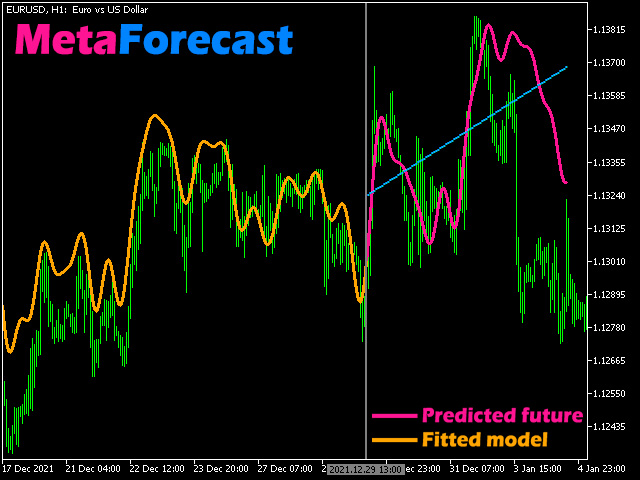
MetaForecast prognostiziert und visualisiert die Zukunft eines beliebigen Marktes basierend auf den Harmonien in den Preisdaten. Obwohl der Markt nicht immer vorhersehbar ist, kann MetaForecast, wenn es ein Muster im Preis gibt, die Zukunft so genau wie möglich voraussagen. Im Vergleich zu ähnlichen Produkten kann MetaForecast durch die Analyse von Markttrends genauere Ergebnisse erzeugen.
Eingabeparameter
Past size (Vergangene Größe)
Gibt an, wie viele Balken MetaForecast verwendet, um ein Modell zur Generierung zukünftiger Vorhersagen zu erstellen. Das Modell wird durch eine gelbe Linie dargestellt, die über den ausgewählten Balken gezogen wird.
Future size (Zukünftige Größe)
Gibt an, wie viele zukünftige Balken vorhergesagt werden sollen. Die vorhergesagte Zukunft wird durch eine rosa Linie mit blauen Regressionslinien dargestellt, die darüber gezogen werden.
Degree (Grad)
Diese Eingabe bestimmt das Analyse-Niveau, auf dem MetaForecast den Markt untersuchen wird.
| Degree | Beschreibung |
|---|---|
| 0 | Für Grad 0 wird empfohlen, einen großen Wert für die Eingabe "Past size" zu verwenden, um alle Spitzen, Täler und Details im Preis abzudecken. |
| 1 (empfohlen) | Für Grad 1 kann MetaForecast Trends verstehen und bessere Ergebnisse mit einer kleineren "Past size" generieren. |
| 2 | Für Grad 2 kann MetaForecast neben Trends auch Umkehrpunkte identifizieren. Für Grade größer als 1 müssen höhere Werte für die Eingaben "Details" und "Noise Reduction" verwendet werden. |
| Größer als 2 | Es wird nicht empfohlen, Grade größer als 2 zu verwenden, aber es kann ausprobiert werden. |
Details
Gibt den Prozentsatz der Details in den Preisdaten an, der für die Generierung von Vorhersagen extrahiert werden soll. Höhere Werte erfordern eine längere Verarbeitungszeit.
Noise Reduction (Rauschreduktion)
Bei Verwendung von Graden größer als 1 benötigt MetaForecast eine Rauschreduktion für die Eingangsdaten, um ein ordnungsgemäßes Modell zu erstellen. Zum Beispiel sollten Sie für Degree=2 die Rauschreduktion auf 90% setzen. Um ein besseres Ergebnis zu erzielen, erhöhen Sie die Details auf 20%.
Remove jumps (Sprünge entfernen)
Manchmal treten in den Vorhersageergebnissen große Sprünge auf, insbesondere bei Graden größer als 1. Durch Aktivierung dieser Eingabe kann die Form der Vorhersage korrigiert werden.
Regression lines (Regressionslinien)
MetaForecast zieht Regressionslinien über die vorhergesagten Balken, um den Trend deutlicher zu machen. Verwenden Sie diese Eingabe, um die Anzahl der Linien anzugeben.
Calculate per n bars (Berechnen pro n Balken)
Legen Sie das Intervall zwischen zwei Vorhersagen mit dieser Eingabe fest. Wenn Sie es zum Beispiel auf 100 setzen, bedeutet dies, dass es die Zukunft vorhersagt und dann eine Pause von 100 Balken einlegt, bevor die nächste Vorhersage gemacht wird.
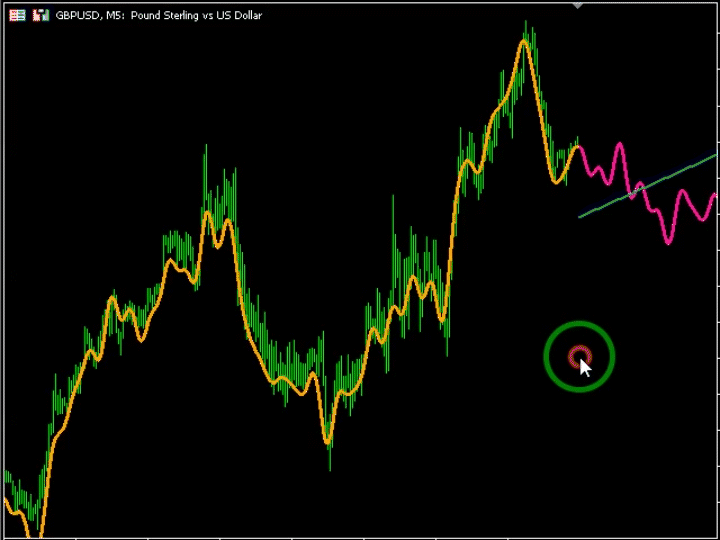
MetaForecast ermöglicht es Händlern, zukünftige Preisbewegungen in der Preisgeschichte vorherzusagen und die Ergebnisse mit tatsächlichen zukünftigen Preisen zu vergleichen. Um diese Funktion zu nutzen, drücken Sie die Taste "H" auf Ihrer Tastatur, um die vertikale Linie anzuzeigen, die verschoben werden kann, um die Vorhersage in historischen Preisen anstatt der aktuellen Kerze zu platzieren. Um durch die Geschichte zu navigieren, halten Sie die "Strg"-Taste gedrückt und bewegen Sie die Maus, um die vertikale Linie zu verschieben. Um zur aktuellen Kerze zurückzukehren, drücken Sie erneut "H". Wenn Sie mehrere MetaForecasts in Ihrem Diagramm haben und sie gleichzeitig zurücksetzen möchten, drücken Sie die Taste "R" auf Ihrer Tastatur.
Ich erkunde ständig neue Ideen, um die Zukunft des Marktes vorherzusagen. Sobald ich eine neue funktionierende Methode oder einen neuen Algorithmus entdecke, baue ich ihn in das Produkt ein. Ich würde Ihre Unterstützung schätzen, um mir zu ermöglichen, dieses einzigartige Angebot weiterzuentwickeln.


I absolutely love it. You don't need to waste your time searching out all the support and resistance levels. For me it is very very lucrative trading the 1 hr timeframe with this indicator. Especially on pairs that are more trendy. Even BTC trading is easily possible with this indicator. Absolutely great!