SMTrendLine
- Indikatoren
- Version: 2.2

Der SMTrendLine-Indikator basiert auf den Prinzipien der grafischen Konstruktion von Bollinger-Bändern.
Grafisch gesehen handelt es sich bei den Bollinger Bändern um zwei Linien, die die Preisdynamik von oben bzw. von unten begrenzen. Es handelt sich dabei um eine Art Unterstützungs- und Widerstandslinien, die sich meist auf weit vom Kurs entfernten Ebenen befinden.
Wie wir wissen, sind die Bollinger-Bänder den Umschlägen der gleitenden Durchschnitte ähnlich. Der Unterschied zwischen ihnen besteht darin, dass die Grenzen der Hüllkurve über und unter der Kurve des gleitenden Durchschnitts in einem festen Abstand liegen, der als Prozentsatz ausgedrückt wird, während die Grenzen der Bollinger-Bänder in Abständen konstruiert sind, die einer bestimmten Anzahl von Standardabweichungen entsprechen. Da der Wert der Standardabweichung von der Volatilität abhängt, passen die Bänder selbst ihre Breite an: Sie erhöht sich, wenn der Markt instabil ist, und verringert sich in stabileren Perioden.
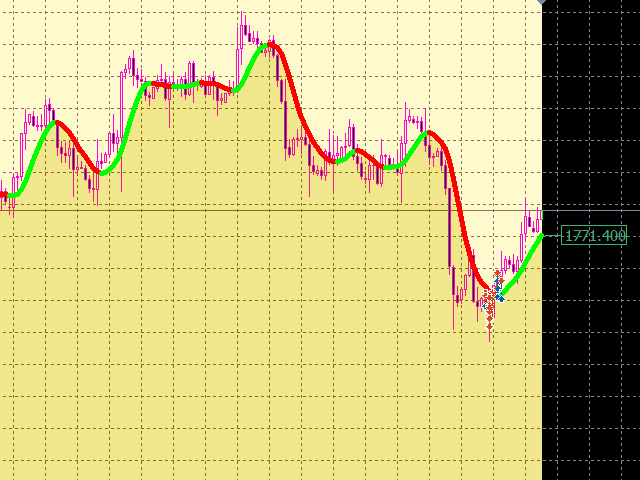
Alle diese Daten werden in einem gemeinsamen grafischen Modell zusammengefasst, das auf dem Chart in Form eines Bandes erscheint, das je nach Trend die Farbe ändert.
Dieser Indikator funktioniert in jedem Zeitrahmen. Die Trendlinie wird nicht neu gezeichnet. Um den Einstiegspunkt zu bestimmen, empfehle ich, einen zusätzlichen zweiten Indikator auf einem älteren Zeitrahmen zu verwenden und in den Markt einzusteigen, wenn die Richtungen der Kursbewegung bei beiden Indikatoren übereinstimmen.
In Zukunft wird der SMTrendLine-Indikator ein Update erhalten, bei dem ein Informationspanel erscheinen wird. Ich wäre Ihnen sehr dankbar für Ihr Feedback und Ihre Vorstellungen darüber, welche Informationen Sie in diesem Panel sehen möchten.
Es ist auch geplant, diesen Indikator als Teil des Expert Advisors zu verwenden. Auch hierzu werde ich Informationen in der Beschreibung hier auf der Seite bereitstellen.


excellent