YouTubeにあるマーケットチュートリアルビデオをご覧ください
ロボットや指標を購入する
仮想ホスティングで
EAを実行
EAを実行
ロボットや指標を購入前にテストする
マーケットで収入を得る
販売のためにプロダクトをプレゼンテーションする方法
MetaTrader 5のためのテクニカル指標 - 30

Session Finder – Track Forex Market Sessions with Precision
Stay ahead of the market with Session Finder , a sleek HUB style design for MetaTrader 5. It provides real-time visibility into the world’s major trading sessions—Sydney, Tokyo, London, and New York—so you always know which markets are open, closed, or about to change. Key Features: Live Session Status: See whether a session is currently open or closed at a glance. Countdown Timers: Track exactly how long until a session opens or close

AlphaWaveインジケーターでトレーディングの潜在力を解放しましょう! トレーディングに静けさをもたらす: AlphaWaveインジケーターは、チャートを滑らかにし、トレンドの方向を正確に読み取ることで、トレーディングに静けさをもたらすように設計されました。明確なトレードの決定を行うことはこれまでになく簡単です。 10つのモードを備えた革命的なスムージングテクノロジー: AlphaWaveインジケーターを使用して、スムーズでクリアなチャートの表示を体験してください。この革命的なスムージングテクノロジーは1つではなく、なんと10つのモードを提供し、トレーディングの体験を新たな次元に引き上げます!あなたのトレーディングスタイルに最適なモードを選択してください。 あらゆるアセットに対応可能: AlphaWaveインジケーターはどんなアセットにも最適に適応し、多岐にわたる市場でサポートします。どんな取引インストゥルメントでもその潜在力を引き出しましょう。 上昇および下降トレンド用のカスタムアラート: 特別なボーナスをお楽しみください!AlphaWaveインジケーターは上昇および下降トレン

Market Sessionsync** is a cutting-edge trading session indicator designed to enhance your trading experience by visually breaking down the market's daily rhythm. With a compact window overlaid on your chart, this indicator provides a split-second understanding of the current trading session through: Basic setup: Set Difference between your local time and your broker time , set DST(Daylight Saving Time) ON or OFF , set timescale sync you want to use (Local, Broker, CET) - A vertical time marker
FREE

A useful and convenient tool for traders when analyzing and making decisions.
Peculiarity
The main feature of this indicator is its fast algorithm . The gain in the speed of calculating the polynomial and its value of the standard deviation in comparison with classical algorithms reaches several thousand times. Also, this indicator includes a Strategy Tester with a clear visualization of transactions, an equity chart and simultaneous calculation and display of the following data in the form of

アカウントダッシュボードの統計
これは、アカウントの損益を把握するために集中的に表示するのに役立つツールであり、それを追跡することができ、また、得られるリスクを知るためのドローダウン分析も提供します。 アカウントにダウンロードしてアクティブ化した後、EURUSD H1 などの任意のシンボルに添付する必要があります。その後、この瞬間からツールが統計の監視を開始します。
パネルは完全に高度になっており、非表示にしたり、好きな場所に移動したりできます アカウント操作に基づく主な特徴は次のとおりです 毎日の期間(毎日の利益と損失は毎日更新されます) 毎週の期間 (毎週更新される週ごとの利益と損失) 毎月の期間(毎月の損益は毎月更新) 年間期間 (年間の損益は毎年更新) 最大ドローダウン(残高に基づいて最大リスクに達するのを毎秒監視して制御) たとえば、残高が 1000 米ドルで、引き出しが 10% をマークしている場合、ある時点でアカウントの合計リスクが 100 米ドルに達したことを意味します。
FREE

Multi-period Parallel Random Oscillator 1. Main chart cycle main line and signal line 2. 15M 30M 1H fixed cycle signal line Mainly used to observe the overbought and oversold conditions of other cycles in the same chart。 Its main function is to identify moments of multi-cycle resonance, enabling you to better grasp opportunities for buying and selling points.
FREE
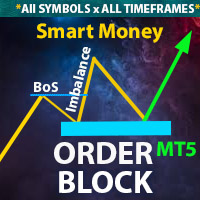
** All Symbols x All Time frames scan just by pressing scanner button ** Discount : Only 4 of 5 copy is 35$.
*** Contact me to send you instruction and add you in "Order Block group" for sharing or seeing experiences with other users. Introduction: The central banks and financial institutions mainly drive the market, Order block is considered a market behavior that indicates accumulation of orders from banks and institutions, then the market tends to make a sharp move(Imbala
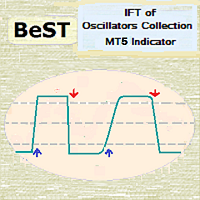
BeST_IFT of Oscillators Collection is a Composite MT4/5 Indicator that is based on the IFT ( Inverse Fisher Transformation ) applied to RSI , CCI , Stochastic and DeMarker Oscillators in order to find the best Entry and Exit points while using these Oscillators in our trading. The IFT was first used by John Ehlers to help clearly define the trigger points while using for this any common Oscillator ( TASC – May 2004 ). All Buy and Sell Signals are derived by the Indicator’s crossings of the Bu
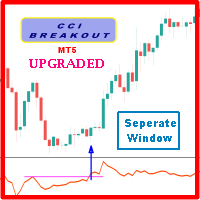
Probability emerges to record higher prices when Commodity Channel Index breaks out oscillator historical resistance level when exhibit overbought values. Since, oscillator breakout of support and resistance have similar effect as price breaks support and resistance levels, therefore, its highly advised to confirm price breakout with oscillator breakout; certainly, will have the same output in short trades. Concept is based on find swing levels which based on number of bars by each side of peak
FREE

RITZ Candle Kaufman’s AMA is a precision market-flow indicator built around Kaufman’s Adaptive Moving Average (KAMA / AMA) — a dynamic smoothing algorithm that automatically adjusts to changing volatility.
This enhanced version interprets AMA momentum directly into smart candle-color signals , giving traders a clean, noise-filtered view of trend strength and directional bias. Where most indicators repaint or react too slowly, RITZ Candle AMA delivers stable, non-repainting color shifts based on
FREE
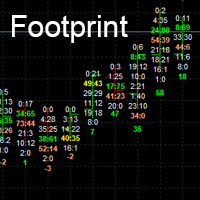
Footprint charts can add a level of depth to your visuals that standard charts cannot achieve.
Footprint charts are a powerful way to visualize the ups and downs of the market, helping you potentially to make better trading decisions. Orderflow Footprint in MT5. show # of market orders at each tick.
Inputs
Point Scale *1 to *10000
Number of candle to show. Font Size Max Bid Color (Top Seller) Max Ask Color (Top Buyer) Max Bid and Ask Color
Normal color

Hidden Edge – High-Low PreUS High-Low PreUS is a clean and lightweight indicator that marks key reference levels before the US session begins.
It draws a session box from 00:01 to 09:00 CET, identifying the high and low of the Asian session, and includes additional reference elements to support structured intraday trading decisions. Features Draws a rectangular range from 00:01 to 09:00 CET Marks the high and low of the session clearly Plots a horizontal yellow line as a suggested stop level bas
FREE

Trendy Stock is a price following indicator that uses Stochastic to show when the price is out of the oversold or overbought areas. The algorithm allows you to stay longer in a trend where the bulls or bears are in control. The indicator changes color immediately the price exits oversold/overbought state. In short, the downtrend [red] bars start to paint when the buying pressure decreases while the uptrend [green] bars form as the buy pressure kicks in. For MT4 version, follow :: https://www
FREE
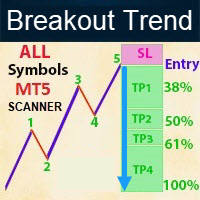
Contact me for instruction, any questions! - Lifetime update free - Non-repaint - I just sell my products in Elif Kaya Profile, any other websites are stolen old versions, So no any new updates or support. Introduction Breakout Trend Scanner indicator works based on the Elliott Wave in technical analysis describes price movements in the financial market that are related to changes in trader sentiment and psychology and finds end of movement and breakout trend. The Elliott Wave pattern that is f

The indicator plots two lines by High and Low prices. The lines comply with certain criteria. The blue line is for buy. The red one is for sell. The entry signal - the bar opens above\below the lines. The indicator works on all currency pairs and time frames It can be used either as a ready-made trading system or as an additional signal for a custom trading strategy. There are no input parameters. Like with any signal indicator, it is very difficult to use the product during flat movements. You
FREE

Free version of the TickScalper indicator. The Tick Scalp indicator is a trading assistant for a scalping trader. Works in a separate window. Tracks the momentary activity of the market, shows the graph of the movement of ticks and the strength of bulls or bears. Sometimes it can anticipate the beginning of a strong movement before any other indicators. Helps the trader to make a decision to open the desired order. Designed to work on any instrument. Used timeframes from M1 to M15. Has simple a
FREE

MonsterDash Harmonics Indicator is a harmonic pattern dashboard. It recognizes all major patterns. MonsterDash is a dashboard that displays all detected patterns for all symbols and (almost) all timeframes in sortable and scrollable format. Users can add their own user defined patterns . MonsterDash can open and update charts with the pattern found.
Settings MonsterDash's default settings are good enough most of the time. Feel free to fine tune them to your needs. The color settings are for tho

AI Volatility Map The AI Volatility Map is a professional indicator designed to analyze market activity by measuring spread and tick velocity. It provides traders with a clear view of market energy levels, helping to identify periods of high volatility, low activity, or sudden changes in momentum. This indicator is especially useful for spotting potential breakouts, trend continuations, or dead market conditions. Key Features: Volatility Score (Blue Line): Represents the normalized market volat
FREE

Wyckoff fans, enjoy!
Ideally to be used with the Weis Waves indicator, but it can be easily used alone, the Waves Sizer puts the range (in resulting Price movement) done by the Price on its market swings. You can control how accurate or loose will be the swings. This tool is very helpful for visually know how much the Price has traveled in your Timeframe. This way you can confront this level of effort with the resulting Volume, etc... Weis Waves indicator:
https://www.mql5.com/en/market/produc
FREE

True TrendLines MT5 - Smart Trend Detection & Alerts Overview True TrendLines MT5 is a professional-grade technical analysis tool that automatically identifies and plots high-probability trend lines on your MetaTrader 5 charts. Using a sophisticated swing point detection algorithm, it helps traders visualize key market structure and potential reversal points with precision. Key Features Automatic Trend Line Detection Identifies valid swing highs and lows based on your chosen strength paramet
FREE

MACD Pro – MACD Indicator for MetaTrader 5 Description
MACD Pro is a Moving Average Convergence Divergence (MACD) indicator for MetaTrader 5. It follows the standard MACD calculation method and displays trend direction and momentum in a separate indicator window. Indicator Elements MACD line based on the difference between fast and slow exponential moving averages Signal line calculated as an exponential moving average of the MACD line Histogram showing the difference between the MACD and signa
FREE

The indicator is designed for easy construction of synthetic charts based on data of various financial instruments. It will be useful both arbitrage and pair trading, as well as for analysis purposes. Its main advantage is simplicity and clarity. Each chart is given as a common mathematical formula. For example, if you want to plot the spread (difference) between EURUSD and GBPUSD with coefficients 4 and 3, then set the following formula: EURUSD * 4 - GBPUSD * 3 The resulting chart is shown in t

INTRODUCTION : The breakout strength meter is a trading tool that is used to identify which currencies are the strongest to breakout, and which currencies are the weakest to breakout. The settings for the indicator are easy, and if you cannot find the settings, please leave a comment The tools are completely free to use Please, if you like the indicator, please leave a comment and rate the indicator in order to develop it
FREE

背景 数年前、私はこのサイトでバイナリーオプション用インジケーターを探していました。多くの初心者と同じく、私は自信満々で同時に天真爛漫——画面の矢印に従うだけで毎日稼げる**「聖杯」**が見つかると信じていたのです。 有料・無料あわせて何百というインジケーターを試しましたが、 どれも安定してプラスにはなりません でした。 時が経ち、私は再びここへ戻ってきました。今度は初心者ではなく、浮き沈み・高揚と落胆をくぐり抜け、 運に頼らない安定的なアプローチ を築いたトレーダーとして。このインジケーターは MQL5 コミュニティへの感謝 であり、堅固な基礎を必要とするすべてのトレーダーへの手助けです。
これは 聖杯ではありません ——未来を見通せる人はいません。ですが、 勝率 70〜90% (あなたのスタイルや目標によって変動)は 私が提示できる水準 です。 このインジケーターは何をする? 金(XAU)のみ に矢印シグナルを表示します。中身はシンプルで、実戦で裏付けられた2つの戦略です。 ICT OTE 62% Retracement — New York AM Kill Zone(NY_AM)

The traditional Money Flow Index indicator, this time, EA friendly . There are 3 buffers exposed that can be used by EAs to automatically analyze the Overbought and Oversold conditions of the quote. Just use the traditional iCustom() function to get these signals. This Money Flow Index calculation is based on the traditional Metaquote's MFI indicator.
SETTINGS
MFI Period Volume type to analyze (Real Volume or Ticks) Starting Overbought region Starting Oversold region
USING WITH EAs
Buffer #0:
FREE

Andrew Pitch fork is one of the most interesting string trend & Channel & Fibo technical analysis , it's like ALL in ONE tool would be very enough for you.
Using 2 Andrew pitch Forks with 2 different time frames on same chart is really very hard working and might be impossible , but with this indicator is possible now , moreover , using this method as Candle Volume based analysis give strong trust for your trade.
I assume if you are having 1 daily pith fork lets say with 22 Candle value , and
FREE
WPR+MFI融合パラボリックSAR 説明:
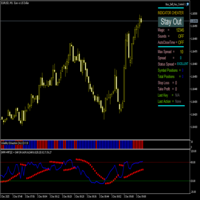
このインジケータは、2つのオシレーター(ウィリアムズ%Rとマネーフローインデックス)とトレンド指標であるパラボリックSARを1つのウィンドウに統合したものです。WPRとMFIの値を平均化し、その結果のラインを基にパラボリックSARを構築します。 動作原理: Avg(WPR,MFI)ライン - WPR(0-100の範囲に変換)とMFIの平均値 パラボリックSARポイント - Avg(WPR,MFI)ラインの値に基づいて構築 シグナル: レベル交差: ラインが20を下から上にクロス → 買いシグナルの可能性 ラインが80を上から下にクロス → 売りシグナルの可能性 SARの位置: SARポイントがラインの下 → 上昇トレンド SARポイントがラインの上 → 下降トレンド 複合分析: 買い:ラインが20より上で、SARがラインより下 売り:ラインが80より下で、SARがラインより上 設定: InpWPRPeriod - WPR期間(デフォルト:14) InpMFIPeriod - MFI期間(デフォルト:14) InpMFIVo
FREE
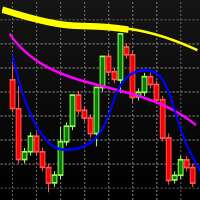
Baseado no indicador MIMA SAR, que é uma combinação dos indicadores MIMA Consolidação e MIMA Tendência, da metodologia Phicube. O indicador é composto pelos 8 fractais, 17,34.72.144.305,610.1292,2554. Sendo a tendência indicada pelas linhas finas e a consolidação pelas linhas mais espessas. Para usar o indicador de maneira adequada deve-se partir do princípio de que tudo na natureza segue o caminho que oferece menor resistência. Isso significa que para uma reversão da tendência ocorrer nesse mod
FREE

The indicator shows separate breakeven levels for short, long, and total positions. It takes into account all current expenses: swap, spread, and commissions (including those incurred upon closing). It has flexible settings for displaying lines, allows the use of Magicnumber, and enables you to set the desired profit level for each level.
Settings list:
Target profit for Buy trades. Target profit for All trades. Target profit for overall break-even level. Show Buy line. Show Sell line. Show ov
FREE

Multi Kernel Regression Indicator (FREE & PREMIUM)
SPECIAL OFFER Full version is available in the market under "Daily Zone Pro" Market Link: https://www.mql5.com/en/market/product/157609?source=Site +Market+My+Products+Page
What This Indicator Does The Multi Kernel Regression (MKR) indicator uses advanced statistical kernel functions to create smooth, adaptive moving averages that respond intelligently to market conditions. Unlike traditional moving averages, MKR applies different kernel
FREE

マーケットステップスは、Gannの時間と価格の相関関係に基づいて設計・構築され、プライスアクション特有のルールによって最適化されたFXマーケット用のインジケーターです。マーケットオーダーフローの概念を利用して、注文が集中する可能性のある価格帯を予測します。
インディケータ・レベルは、それ自体を取引に使用することも、他のストラテジーやインディケータの間違ったシグナルをフィルタリングするための組み合わせとして使用することもできます。すべてのトレーダーは、マルチタイムフレーム(TF)ゾーンと値動きの可能性をチャート上にまとめるために、このような強力なツールを必要としています。テスターモードでは、そのレベルがチャート上でどのように価格を支配しているかを試すことができます。
インジケータの利点
チャートに2つの異なるゾーンを表示し、異なるTFに対してトレンドとレンジ相場を指定することができます。 プライスアクショントレーダーは、異なるTF/プライスゾーンでのオーダーフローを確認したり、FTR(Fail To Return)/FTC(Fail To Continue)を確認するために使用す
KT Trend Reversal Probability は、改良された RSI ベースのアルゴリズムを使用して、トレンド反転の確率をリアルタイムで計算します。この確率は明確なパーセンテージで表示され、現在のトレンドが弱まっているのか、それとも新たなトレンドが形成されつつあるのかを判断する助けになります。 エントリータイミングの計画や、エグジットの最適化など、どの場面でもこのインジケーターは、データに基づいた優位性をあなたのトレーディングに提供します。
特徴
振動系に直接、明確な反転確率(%)を表示し、トレーダーが事前にトレンドの変化を予測するのに役立ちます。 高速と低速の RSI シグナルを組み合わせた独自のオシレーターを採用し、最小限のラグで反転の可能性を検出します。 直感的なカラーフィルター(グラデーション)を使って反転の強弱を視覚的に表現し、一目で状況を把握できます。 反転の確率が重要な水準に達したとき、または新しいトレンドが始まる兆候が現れたときにアラートを送信し、大きな市場変化を見逃さないようサポートします。 オシレーターの期間や確率のしきい値など、すべてを自由にカス

In the "Masters of Risk" trading system, one of the main concepts is related to places where markets change direction. In fact, this is a change in priority and a violation of the trend structure at the extremes of the market, where supposedly there are or would be stop-losses of "smart" participants who are outside the boundaries of the accumulation of volume. For this reason, we call them "Reversal Patterns" —places with a lot of weight for the start of a new and strong trend. Note:
We are r

If you like this product, please give it a 5 star rating as a token of appreciation.
This indicator calculates and draws pivot points and support/resistance levels for both daily and weekly timeframes: Pivot (central) level Support levels S1, S2, S3 Resistance levels R1, R2, R3 It allows showing daily, weekly, or both sets of pivots , giving traders visual references for potential support/resistance areas.
Pivot mode: Choose which pivots to display (weekly, daily, or both). Colors and style: C
FREE
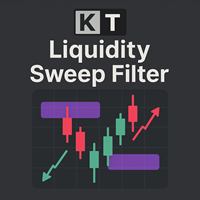
KT Liquidity Sweep Filter は、重要な流動性スイープゾーンを特定し、視覚的に強調表示するインジケーターです。これらのゾーンを明確なプライスアクションによる反発と適応型のトレンドフィルターと組み合わせることで、市場のトレンドに沿った正確な売買シグナルを生成します。 このインジケーターは、大きな流動性スイープゾーンと小さなゾーンを区別し、大きなゾーンには太い矢印、小さなゾーンには細い矢印で表示して、視認性を高めています。 大きな矢印: 主要な流動性スイープゾーンから発生する強い反転シグナルを示します。 小さな矢印: 二次的な流動性スイープゾーンからの弱めの反転シグナルを示します。
機能 トレンドに沿ったシグナル: ゴールドなどのトレンド性の強い銘柄において、トレンドに乗るための複数のエントリーポイントを提供します。 取引チャンスの増加: 強い反転と弱い反転の両方を明確に示すことで、より多くのエントリー機会を提供します。 カスタマイズ可能なトレンドフィルター: 取引対象の銘柄や時間足に合わせてシグナルを調整できます。 しきい値の調整: 主要スイープシグナルの感度を調
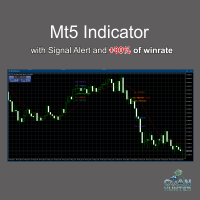
FREE VERSION FOR GOLD (XAUUSD) AND BTCUSD Dont forget to rate after use this indicator, Thanks.
Features: Clear Buy/Sell labels with directional arrows. Automatic Take Profit (TP) & Stop Loss (SL) labels for better risk management. Easy-to-read chart signals (no messy lines). Works on any timeframe and any asset (Forex, Gold, Indices, Crypto, Stocks). Compatible with MetaTrader 5 (MT5 desktop & mobile sync) . Perfect for: Beginner traders who need straightforward sign
FREE

Indicator introduction: The indicator draws wave lines and histograms, It has small price lag, and the signal will not drift. The indicator can send emails, alerts and notifications to you when previous k line has an up arrow and it is under the histogram sections or it has a down arrow. you can choose whether or not to send the two kind of alerts, the alerts repetition times can also be changed. If the indicator appears red and green histograms, this is a buy zone. It can be used to analyze mar
FREE

Ideal for scalpers, day traders and swing trades. Automatically identifies key support and resistance levels based on historical price data. It displays real-time trading zones and a precise countdown timer for each candle, helping traders make faster and more confident decisions. Fully customizable for multiple timeframes and instruments. The indicator analyzes historical price data to draw horizontal levels that represent key trading areas. It also displays, in real time, the current zone whe
FREE

Necessary for traders: tools and indicators Waves automatically calculate indicators, channel trend trading Perfect trend-wave automatic calculation channel calculation , MT4 Perfect trend-wave automatic calculation channel calculation , MT5 Local Trading copying Easy And Fast Copy , MT4 Easy And Fast Copy , MT5 Local Trading copying For DEMO Easy And Fast Copy , MT4 DEMO Easy And Fast Copy , MT5 DEMO Fibo: from KTrade 1. Automatically calculate and analyze the band. -> Get the desired band 2.
FREE

Utazima 001 Indicator AI Professional Market Structure & Opening Range System STOP GUESSING. START TRADING WITH STRUCTURE. Utazima 001 Indicator AI is a next-generation Market Structure & Opening Range Intelligence System , built for traders who want clarity, precision, and consistency . This is not a repainting signal tool.
This is institutional-grade logic , simplified and automated for retail traders. Designed by Utazima MentorCreate , this indicator reveals the most important price zo
FREE

A price increase indicator calculates range and price changes in percent. It is very useful when you look at the chart.
It helps you make decisions to open deals when the price is at the lowest level do not open sell deals and open buy deals and when it is at the highest level do not open buy deals open sell deals, it is not an entry signal for deals but to know the lowest and highest price that will reach in an hour or four hours a day or a week or a month as a whole for the period
FREE

The indicator allows you to simplify the interpretation of signals produced by the classical ADX indicator.
The position of the hight bars of the histogram relative to zero and the histogram coloring indicate the direction of price movement determined by the intersection of DI+ / DI-.
The position of the hight bars of the histogram relative to zero and the color indicate the strength of the price movement.
The indicator is a logical continuation of the series of indicators using this classica
FREE

Jackson Support and Resistance V it a powerful advance support and resistance indicator which provide signal base on price action, it Design to make things easy for everyone to draw support and resistance. we believe most strategies are built with support and resistance as a foundation .Having support and resistance perfect can be a game change to you way of trading. It flexible to all instrument .don't forget to watch our video on how to us this indicator prefect and progressive.
FREE

It makes it easier to see where there have been consolidation zones for previous prices and allows you to highlight the histogram where there is the biggest consolidation zone.
Input parameters Intervalo de preço Is the price between the histograms
Periodo Number of candle sticks to be analyzed
Porcentagem Highlights the histogram where there is minimal consolidation in relation to the analyzed period
FREE

Gold Master Indicator MT5 Professional Gold Signal System This advanced indicator has been designed and optimized specifically for Gold (XAU) trading, utilizing a technical confluence approach : trend, momentum, volume, market structure (S/R), and multi-timeframe validation. It is the ideal tool for traders who prioritize signal quality and operational noise reduction over the sheer quantity of entries. 1. Functional Overview The system detects high-probability buy and sell opportunities in XAU

The name Aroon means “ Dawn's Early Light ” in Sanskrit. His creator Tushar Chande chose this name because the indicator is designed to catch the beginning of a new trend. At first sight it seems a little confusing all those jagged lines but after you understand the basics of it, you will find this indicator pretty cool and use it in a variety of ways, i.e.: Trigger, Trend Filtering System, and so on. The Aroon indicator was created in 1995 so it is a "modern" indicator compared to the Jurassic
FREE

A simple volume indicator according to the color of the candle!
- Custom background!
- Supports Volume by Ticks or Real Volume.
The original Metatrader Volume indicator does not show the colors of the bar according to the color of the Candle, it only changes color when the volume of a candle is greater than the previous one, this sometimes creates confusion for beginners and does not know the real reason for the color change.
Free indicator, support may take a while to respond!
FREE

This indicator calculates trend via two different moving averages and draw zigzag trend lines. You can change fast and slow Moving Averages settings for customization. Inputs:
Fast MA Time Period : 64 Fast MA Shift: 0 Fast MA Method: Smoothed Fast MA Apply To: Median Price Slow MA Time Period: 32 Slow MA Shift: 0 Slow MA Method: Smoothed Slow MA Apply To: Median Price ZigZag Color: Red ZigZag Type: DashDot ZigZag Width: VeryThin
FREE

Regime Radar — Market Regimes + Bias Stops (MT5) Regime Radar shows the current market regime — Range, Weak Trend, Strong Trend, or Shock — and draws ATR-based stop lines on the chart. It also provides a compact panel with regime, direction, confidence and optional RSI/Bollinger suggestions. This is an analysis tool; it does not provide trading signals and does not guarantee any profit. Main functions Regime detection in four states (Range, Weak Trend, Strong Trend, Shock). Bias indicator with
FREE

Seeing and interpreting a sequence of Candlesticks is easy to spot when you are a human... Higher Highs, Higher Lows, are the panorama of a Buying trend, at least in a short period of time... Seeing a current candlestick higher high and a lower candlestick low, as a human, you can immediately spot a "divergence", an "alert", a "starting range", but in the end and based on other analysis a human trader can understand and behave accordingly to this kind of candlestick data... But what about EAs (r
FREE

Buyer Seller Balance Analyzer は、複数のタイムフレームにおける買い手と売り手の力を包括的に把握できます。 主なコンポーネント: Buyer/Seller Balance テーブル 買い手と売り手の比率を表示 M1 から MN1 までのタイムフレームをカバー 色分けされた値(緑 = 買い手、赤 = 売り手) 主要指標: Buyers (%) – 買い手の割合 Sellers (%) – 売り手の割合 ️ Balance – 買い手と売り手の差 Strength – トレンドの強さ (STRONG/MEDIUM/WEAK) Volume – 取引量の指標 (HIGH/normal) 追加機能: 移動平均線 (8, 21, 50, 100, 200) 水平線で示す現在価格 高い取引量の強調表示 シグナル解釈: 強いトレンド: Balance が大きく正(濃い緑) → 強い上昇トレンド Balance が大きく負(濃い赤) → 強い下降トレンド 反転: B

Williams Fract als (v 2 ) — クリア なシ グ ナル、最小 限の ノイズ 最適 化 された分 形イン ジ ケーター 。確 定した高 安を 表示 し 、新 バー のみ 計 算 。ATR と クラ スタ で 余 分 な シ グ ナル を 除 去 。 主 な特 長 最適 化 :新 バーで 計算 /必要 時のみ フル 再計 算 見や す い矢 印 :色 ・サイズ ・間 隔を 調整 可能 フィ ル ター(任意 ) :ATR 間 隔と クラスタ 内 の最 強フ ラク タル 採用 マル チ時間 足 :現在 または 選択 時間足 ;対象 はこの チャ ート /銘 柄 のみ 入力 (デフォ ルト ) Period : 1 4 Timeframe : 現 在また は 選択 Arrow Gap : 2 0 points ATR : Period 14 , Mult iplier 0. 5 Cluster: 5 本 、価格窓 0 . 3×ATR 注意 :分 形は 期間経 過後 に確 定する ため 、シグ ナルは 自然 な遅延があります。
ICONIC TITAN SIGNAL v1.6
“Don’t trade like the crowd – trade like a legend.”
The ICONIC TITAN SIGNAL is more than just an indicator. It’s your personal mentor. Your scanner. Your signal provider. A hybrid masterpiece of market experience, mathematical logic, and institutional precision – crafted for those who aim not just to trade, but to dominate.
What does the ICONIC TITAN do?
It filters 24/7 through the chaos of the four most relevant markets in the world:
XAUUSD
EURUSD
BTCUSD
NAS100

DiverX is a powerful and versatile divergence indicator developed for the MetaTrader 5 platform. It detects both Regular and Hidden Divergences based on five popular technical indicators: RSI (Relative Strength Index) , RVI (Relative Vigor Index) , Stochastic Oscillator, CCI (Commodity Channel Index) , and MACD (Moving Average Convergence Divergence) and ATR Plus (author’s proprietary indicator, product page >> ) . The indicator plots results directly on the main chart, providing visual lines
FREE

High Low Swing (HLS) Indicator
The HLS indicator is a technical analysis tool designed to identify swing highs and lows in the market, aiding swing traders in making informed decisions. It offers an adjustable "degree" parameter, allowing you to customize the sensitivity to strong price movements based on current market conditions.
Features:
• Clear Buy/Sell Signals: The indicator plots signals directly on the chart, simplifying trade identification.
• Adjustable Swing Strength: The "degr
FREE

Session Bias This Strategy of bias useful for those who follow TRADESHARE on youtube. This script is designed by BokaroTraderFx for traders who want assistance in determining their session bias, particularly for those who trade within sessions typically represented by a single 4-hour candle. The method involves using price action to establish a daily bias, guiding decisions on whether to focus on buys, sells, or both. The analysis is based on the previous daily and 4-hour candle closes, fo
FREE

98%の精度を誇るトレードシグナル 正確なエントリー、明確なエグジット | マルチタイムフレーム | 全市場対応
3つの簡単なステップで仕組みを確認 1️⃣ エントリー(買い/売りルール) シグナル発動:2本の線(X)がカラーゾーン(赤:買い、青:売り)の外側を横切る。
確認:価格ローソク足がクロスゾーンにタッチ(クロスゾーン中、またはクロスゾーンから1~5本以内)
代替エントリー(ノータッチ):
売りシグナル(青ゾーン):価格がクロスゾーンを上抜ける(ノータッチ)。
買いシグナル(赤ゾーン):価格がクロスゾーンを下抜ける(ノータッチ)。
2️⃣ エグジット(利益確定) 決済シグナル:黄色の線が現在のゾーンの外側をカーブ → エグジット。
3️⃣ リスク管理 ロットサイズ:口座残高1,000ドルあたり0.01ロット。
取引の分散:主要通貨ペア(例:USDJPY、EURGBP、GOLD)に分散投資。
このインジケーターがトレーダーに人気の理由 98% の精度 – 流動性と移動平均線クロスに基づく信頼性の高いシグナル。 あらゆる通貨ペア、コモディティ、時間足(1

The indicator is stable on noise fluctuations in price and quickly reacts to the trend. It is based on an algorithm from a system of hyperbolic functions that allows you to aggressively smooth the flat with minimal lag on the trend. It can be applied directly to the price chart, to itself, or to other indicators in order to eliminate false signals. The main purpose of the indicator is to smooth out small sawtooth price movements as much as possible. The higher the Hyperbolic parameter, the stron

Value Chart indicator presents the Price evolution in a new form. This indicator, Price Momentum , was developed taking all the calculations presented in the book " Dynamic Trading Indicators " by Mark W. Helweg and David Stendahl (2002). The technique involves de-trended Prices from a user-defined Period of analysis and the addition of a Volatility index correction. The result is an Oscillator with 3 zones: Fair Price Value, Overbought/Oversold and Extremely Overbought/Oversold zones. Adding th
FREE

The Expert Advisor for this Indicator can be found here: https://www.mql5.com/en/market/product/115567 The Contraction/Expansion Breakout Lines with Fair Value Gaps (FVGs) Indicator for MetaTrader 5 (MT5) is a powerful technical analysis tool designed to help traders identify and visualize breakouts at critical levels of contraction and expansion in financial markets. By incorporating Fair Value Gaps (FVGs), this indicator enhances traders' ability to gauge market sentiment and anticipate poten
FREE

The Gann Box (or Gann Square) is a market analysis method based on the "Mathematical formula for market predictions" article by W.D. Gann. This indicator can plot three models of Squares: 90, 52(104), 144. There are six variants of grids and two variants of arcs. You can plot multiple squares on one chart simultaneously
Parameters Square — selection of a Gann square model: 90 — square of 90 (or square of nine); 52 (104) — square of 52 (or 104); 144 — universal square of 144; 144 (full) — "full

Quantopro Plus: Skyrocket Your Trading Success Unleash the power of precision with Quantopro , the ultimate trading indicator for MetaTrader 5 that transforms market chaos into profitable opportunities. Engineered with a cutting-edge proprietary formula, Quantopro delivers crystal-clear buy and sell signals, empowering traders of all levels to dominate the markets with confidence. Why Choose Quantopro? Dynamic Signal Painting : Instantly spot high-probability trades with vivid, real-time signals
FREE
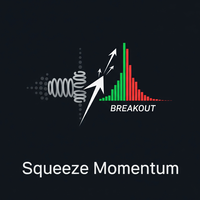
1. Introduction The Squeeze Momentum Plus is a powerful technical analysis tool designed to help traders identify periods of low market volatility (the "squeeze" phase) and assess the direction and strength of price momentum . This indicator combines the principles of Bollinger Bands and Keltner Channels to detect changes in market volatility, along with a momentum oscillator to measure buying/selling pressure. 2. Key Components of the Indicator The Squeeze Momentum Plus is displayed in a separa
FREE

この指標は、トレーダーが市場の方向性を特定するのに役立つように開発されました。取引では、上昇トレンド、下降トレンド、横向きの 3 種類の動きがあります。市場の横方向の動きは、ほとんどのトレーダーが閉じ込められる場所です。統合、これは単に方向性がないことを意味します。スキャルパーにとって、資産クラスがこの期間にいつあるかを特定する方法を知っている場合にのみ、これは彼らにとって有利になる可能性があります.
トレンドを特定するためにくわを開発する試みがこの指標のすべてです。価格が緑の点を上回っている場合に固執し、2 つの連続した点が発生した後に買い取引を行います。または、価格が赤の点を下回った場合は、売りポジションに焦点を当てます。 .
私がこの指標で行ったことは、市場が範囲内にあるとき、価格が赤い点を下回っていないとき、価格が緑の点を上回っていないときは売らないことを避けることです。
私のエントリのほとんどは、価格がドットより上になるのを待ってから、2 回連続してローソク足でトレンドの方向を示します。
FREE

指標はトレンドフォロワー向けです!
3つの移動平均によって構築された取引システム。トレンドに合わせて取引し、利益を上げましょう。 Necessary for traders: tools and indicators Waves automatically calculate indicators, channel trend trading Perfect trend-wave automatic calculation channel calculation , MT4 Perfect trend-wave automatic calculation channel calculation , MT5 Local Trading copying Easy And Fast Copy , MT4 Easy And Fast Copy , MT5 Local Trading copying For DEMO Easy And Fast Copy , MT4 DEMO Easy And Fast Copy , MT5 DEMO
トレンドインジケーター、 波動標準の自動計算 、 MT
FREE

Gold Daily Top Bottom Engine 2026 by Arslan Rouf
Gold Daily Top Bottom Engine is a professional-grade analytical tool designed for traders who focus on market structure, precision, and high-probability reversals rather than lagging indicators.
This engine does not use traditional indicators, oscillators, or repainting logic. It is built on daily range behavior, adaptive structure analysis, and liquidity sweep concepts, presented through a clean and decision-focused smart panel.
Key Features:
FREE

Calendar Dashboard – a compact, real‑time economic calendar that sits directly on your MT5 charts and never gets in the way . Why traders love Calendar Dashboard See upcoming and past news at a glance, with clear time, currency, and impact so you know exactly when markets may move . Instantly spot high‑impact events thanks to color‑coding and a simple legend; past events are marked with a small asterisk for quick reference . Stay aligned across brokers with Broker Time and GMT Time displayed si
FREE
MACD Lines - Indicador MACD com Visualização em Linhas Descrição Este é um indicador MACD (Moving Average Convergence Divergence) modificado que apresenta uma visualização mais limpa e elegante em comparação com o MACD padrão do MT5. A principal diferença é que ele remove o histograma tradicional e mantém apenas as linhas MACD e Signal, permitindo uma melhor visualização dos cruzamentos e tendências. Características Principais Linha MACD em azul escuro com espessura 2 Linha Signal em vermelho co
FREE
Andean Oscillator – トレンド変動オシレーター 市場の強さと方向を明確に表示します。 Andean Oscillator は、各資産の上昇および下降の変動を主要なコンポーネントで測定する 高度なオシレーター です: Bull(上昇) 、 Bear(下降) 、そして誤ったシグナルをフィルタリングしてトレンドを確認する Signal Line 。 指数エンベロープ と移動平均を使用して、Andean Oscillatorはトレンドの強さと変化の可能性を明確かつ安定して表示し、有利に取引するのを助けます。 主な特徴 BullとBearのコンポーネント: 価格の上昇および下降の変動を反映。 シグナルライン: 誤ったシグナルをフィルタリングし、トレンドを確認。 シンプルな解釈: 上昇コンポーネントが下降を上回る → 上昇トレンド、下降コンポーネントが上昇を上回る → 下降トレンド。 反応型オシレーター: 指数エンベロープと移動平均に基づく計算で最大の反応速度。 すべての資産とタイムフレームに対応。 使い方 トレンドの識別: Bull > Bear → 市場上昇、Bear > B
FREE

このプロジェクトが好きなら、5つ星レビューを残してください。 大規模なボリュームを取引するには、複数の楽器/チャートを調べる必要があります
新しい機会を見つける, このインジケータは、特定の特定のプロットによってあなたを助ける
数またはそのサフィックスの複数のレベルによって、それらを自動的に更新します
価格が変更されると、そうでなければ退屈なタスク。 例えば、GBPUSDでは、インジケーターの4つのインスタンスを
チャートをプロットする: 線長100バーの各0.01間隔。 線の長さ25バーの0.0075間隔で終わる各価格。 線長50バーの0.0050間隔で終わる各価格。 25バーの線長で0.0025間隔で終わる各価格。 このようにして、定規に似ているので、この例が非常に見られます。
スクリーンショット。 また、色やラインのスタイルを異なるスタイルで設定できます。
レベルを視覚化しやすいようにします。
FREE
MetaTraderマーケットは、他に類のない自動売買ロボットやテクニカル指標の販売場所です。
MQL5.community ユーザーメモを読んで、取引シグナルのコピー、フリーランサーによるカスタムアプリの開発、支払いシステムを経由した自動支払い、MQL5Cloud Networkなど、当社がトレーダーに対して提供するユニークなサービスについて詳しくご覧ください。
取引の機会を逃しています。
- 無料取引アプリ
- 8千を超えるシグナルをコピー
- 金融ニュースで金融マーケットを探索
新規登録
ログイン