MetaTrader 5용 기술 지표 - 30

Fair Value Gaps (FVG) and Liquidity Voids are price ranges you can exploit for better entries and exits on your trades. They're similar concepts, so let's look at them from the top and break it down. Think of FVG and Liquidity voids as soft-spots in the market. They are paths of least resistance. That doesn't mean price will go through them, but price could go through them more easily.
To find and locate it is easy but tidiest to repeat the same thing all over again. This helps to boost your t
FREE

RS Zone is an Indicator used to plot the support and resistance levels of each asset. and each time period as we determine The principle for calculating support and resistance levels is based on the price range (Range SR) to see if there are points where the price repeatedly reverses at that price level or not. The total pot will be equal to the Total SR that we set. Example If Range SR is equal to 120, the system will choose to look at data going back 120 candlesticks to find whether there is a
FREE

DailyHiLo Indicator
Master the daily range like a pro. This indicator automatically plots the previous day’s high and low levels —a core element in the (Beat The Market Maker) trading approach—directly on your chart. These levels act as natural boundaries for intraday price action, helping traders identify potential reversal zones, breakout points, and liquidity targets. Key Features Accurate plotting of yesterday’s high and low for any symbol and timeframe. Works seamlessly with BTMM-inspired
FREE

The seven currencies mentioned are: GBP (British Pound): This is the currency of the United Kingdom. AUD (Australian Dollar): This is the currency of Australia. NZD (New Zealand Dollar): This is the currency of New Zealand. USD (United States Dollar): This is the currency of the United States. CAD (Canadian Dollar): This is the currency of Canada. CHF (Swiss Franc): This is the currency of Switzerland. JPY (Japanese Yen): This is the currency of Japan. Currency strength indexes provide a way to
FREE
Identify trending and flat markets effortlessly
This indicator calculates how much has a symbol moved in relative terms to find trending or flat markets. It displays what percentage of the latest price range is directional. It can be used to avoid trading in flat markets, or to find flat markets to execute range-bound trading strategies. [ Installation Guide | Update Guide | Troubleshooting | FAQ | All Products ] A value of zero means the market is absolutely flat A value of 100 means the marke
FREE

A simple volume indicator according to the color of the candle!
- Custom background!
- Supports Volume by Ticks or Real Volume.
The original Metatrader Volume indicator does not show the colors of the bar according to the color of the Candle, it only changes color when the volume of a candle is greater than the previous one, this sometimes creates confusion for beginners and does not know the real reason for the color change.
Free indicator, support may take a while to respond!
FREE

This indicator serves as an alert for climax regions.
How does it work? When the 20-period arithmetic moving average meets the 200-period arithmetic moving average, a conflict region forms with two major opposing forces fighting. This causes the price to show random peaks until a winner side is defined, which can be dangerous. Therefore, the indicator paints the region between the moving averages to alert you.
How to use it? It can be used for specific volatility or support and resistance str
FREE

TOPOS INDICATOR AND HISTORIC BACKGROUNDS The Indicator of historical tops and backgrounds is based on the monthly chart where sharks hide so it was developed to facilitate the identification of these regions. The available features are the Incoming Triggers alerts and notifications that are sent to the mobile phone. Parameters 1-) Tops and Bottoms: You can change the color of the lines and the period in years and the filter range between the top and bottom and the median and consider th
FREE

Fibonacci Bollinger Bands (FBB) Indicator - User Manual 1. Introduction Fibonacci Bollinger Bands (FBB) is a technical analysis indicator that combines three tools: Bollinger Bands , Fibonacci Ratios , and the Volume-Weighted Moving Average (VWMA) . The purpose of this indicator is to provide a multi-dimensional view of the market by helping to identify: Dynamic support and resistance zones. The general market trend. Volatility levels and potential accumulation phases (squeezes). Price breakouts
FREE

What is this indicator? This indicator is for comparing multiple charts and verifying the chart pattern. Synchronize each chart position with the common vertical line. By changing the chart mode, you can also display the chart like a real trade.
How to set up
1. Scroll the chart of the target currency pair to the end in the past direction and download all the historical data of that currency pair. 2. Install this indicator in the main window of each chart. 3. Customize each parameter on the In

Certainly! Let me introduce you to a powerful tool for MetaTrader 5 (MT5) that can automatically identify and draw support and resistance (S&R) levels on your trading charts. This tool is called the “Support and Resistance Levels Guru” . Support Resistance Levels Guru The Support & Resistance Indicator automatically displays essential S&R levels on your chart. These levels are crucial for technical analysis and are used by many traders. Resistance levels (zones) are shown in R ed , while suppo
FREE

CandleScope Pro Demo – Candlestick Pattern Indicator CandleScope Pro Demo is a powerful and easy-to-use indicator for MetaTrader 5 that automatically detects and labels the most popular candlestick patterns directly on your chart. This tool is designed to help traders of all levels quickly identify key reversal and continuation signals, improving decision-making and trading accuracy. Key Features: Automatic Detection: Instantly scans and highlights the following candlestick patterns: Doji Spin
FREE

APT – Advance Pivot Trader Indicator for MetaTrader 5 APT – Advance Pivot Trader is a technical indicator developed for MetaTrader 5.
The indicator is based entirely on mathematical and algorithmic calculations and is designed to analyze market structure using pivot-based logic. The indicator does not use grid techniques, martingale strategies, or position sizing methods. It provides analytical information to support structured and disciplined trading decisions. Timeframe and Risk Guidance The
FREE

Logic Trade Solution Indicator (Standalone)
Idea by Suresh Dhuraisami | Code by Rafilathif Description The Logical Trading System (LTS) is a powerful multi-timeframe indicator for MetaTrader 5, designed around the concept of Valid Reversal Zones (VRZ). It generates precise trading signals and delivers comprehensive alerts, ideal for traders who value structured price action and zone-based strategies. Key Features VRZ Zone Detection: Identifies high-probability reversal zones using swing hig
FREE

The WaveTrend Oscillator indicator is an enhanced version of the classic WaveTrend Oscillator, a momentum indicator. It is designed to identify overbought/oversold conditions and provide potential trend reversal signals. The core difference in this version is the application of a data "normalization" algorithm. This ensures the indicator's oscillation lines remain balanced around the zero line, causing the indicator window to always stay naturally centered. This is especially useful when trading
FREE

Currency Strength Meter is the easiest way to identify strong and weak currencies. This indicator shows the relative strength of 8 major currencies + Gold: AUD, CAD, CHF, EUR, GBP, JPY, NZD, USD, XAU. Gold symbol can be changed to other symbols like XAG, XAU etc.
By default the strength value is normalised to the range from 0 to 100 for RSI algorithm: The value above 60 means strong currency; The value below 40 means weak currency;
This indicator needs the history data of all 28 major currency

The HammerStar indicator is designed to search for the Hammer and Shooting Star patterns on charts of any currency pairs.
Hammer Downward trend.
The lower shadow is not less than 2 and no more than 3 times larger than the body.
There is no upper shadow, or it is very short (no more than 10% of the candlestick range).
The color of the body in the long game is not important, with the short - white hammer is much stronger than the black one.
Confirmation is suggested.
Shooting Star Uptrend.
The u
FREE

With this indicator user can determine not just pivot like turning points. User able to spot trading ranges boundaries and support-resistance levels. In a strong trend the reverse signals also gives us excellent entry points. Recommended user settings: In the Attis volume: look back period : 1 or (3) MA_Lenght 99. ( of course one can play with the settings and get tailored signals... as you need)
FREE

Special Offer ... It is totally free for all. New one coming soon...................
About This Indicator: RSI vs SMA Indicator: A Comprehensive Technical Analysis Tool for Better for Identify the Short and Long Signals.
The RSI vs SMA Indicator is a powerful technical analysis tool designed to understanding Market Price Fluctuation for Long or Short signals. This user-friendly Indicator good for both novice and experienced traders, providing valuable indication in price chart and separate wind
FREE
GridLinesX is a lightweight and efficient utility for MetaTrader 5 designed to help traders visualize price levels with precision. Whether you are a Grid Trader, a Scalper, or simply need to mark psychological price levels, GridLinesX automates the process instantly. Forget about drawing manual horizontal lines one by one. Simply define your High/Low range and the grid step (in points), and the tool will generate a clean, customizable grid overlay on your chart. Key Features: Customizable Range:
FREE

Ideal for scalpers, day traders and swing trades. Automatically identifies key support and resistance levels based on historical price data. It displays real-time trading zones and a precise countdown timer for each candle, helping traders make faster and more confident decisions. Fully customizable for multiple timeframes and instruments. The indicator analyzes historical price data to draw horizontal levels that represent key trading areas. It also displays, in real time, the current zone whe
FREE

TurnPoint Indicator – Market Reversal & Trend Signal Tool The TurnPoint Indicator is designed to help traders identify potential turning points and key levels in the market. By analyzing price action, it highlights areas where reversals or continuations are likely to occur, allowing traders to anticipate trend changes more effectively. This tool incorporates advanced logic to filter signals, reducing noise and false alerts. Users can choose between breakout and pullback modes, depending on their
FREE

Free version of the TickScalper indicator. The Tick Scalp indicator is a trading assistant for a scalping trader. Works in a separate window. Tracks the momentary activity of the market, shows the graph of the movement of ticks and the strength of bulls or bears. Sometimes it can anticipate the beginning of a strong movement before any other indicators. Helps the trader to make a decision to open the desired order. Designed to work on any instrument. Used timeframes from M1 to M15. Has simple a
FREE

**Experience Smarter Trading with FVG Super Signal**
Unlock simpler, more decisive trading with **FVG Super Signal**, an advanced MT5 indicator from the WinWiFi Robot Series. This powerful tool uniquely combines the Fair Value Gap (FVG) technique with robust trend-following logic.
* **Clear Signals:** Delivers intuitive Buy/Sell alerts, simplifying your trading decisions. * **Universal Compatibility:** Works seamlessly across all assets and timeframes. * **Highly Versatile:** Ideal for all tr
FREE

계정의 레버리지와 심볼의 확산을 실시간으로 모니터링할 수 있는 훌륭한 유틸리티 도구 이것은 데이터를 정확하게 식별하는 방법을 알 수 있습니다.
레버리지와 스프레드 지표의 조합. 거래 계좌의 레버리지 및 스프레드를 자동으로 확인하는 도구입니다. 모든 브로커 외환 주식에서 일합니다. 브로커가 레버리지를 변경하고 경제 뉴스 발표 중에 퍼지는 경우 모니터링하는 데 유용합니다. 현재 심볼의 실시간 스프레드 확인. 거래 계좌의 실시간 레버리지 확인. 빠른 새로고침으로 이해하기 쉬운 디자인 등 레버리지는 비교적 적은 투자로 많은 돈을 벌 수 있는 Forex 시장의 특수성입니다. "레버리지"라는 용어는 일반적으로 레버리지 또는 평준화로 번역됩니다. 많은 Forex 보커는 매우 흥미로운 레버리지를 가질 가능성을 제공합니다. 예를 들어 1:100의 레버리지란 투자금액의 100배 이상의 금액으로 운용하여 Forex거래가 가능하다는 것을 말합니다. 이것은 외환 시장에서 실제 투자로 얻을 수 있는 것보
FREE
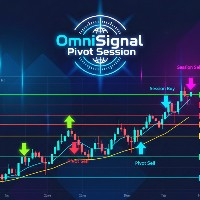
OmniSignal Pivot Session combines two powerful trading concepts— Daily Pivots and (NY, London and COMEX) Session Opening Levels —into one clean, intelligent signal indicator. It's designed to identify key market levels and provide clear, non-repainting entry signals based on a robust 3-candle confirmation pattern , helping you filter out market noise and trade with more confidence.
Suggested Symbols: XAUUSD, US30, DE40
(might have some bugs if you are using it with any Forex Pair!)
Core Fea
FREE

The Hyper Force indicator, originally created in 1984 by David Weis, indicates in wave form the strength of a symbol's trend.
The bigger the wave, the stronger the trend.
Small waves mean weak trend or market without trend.
In a wave, the greater the difference between one bar and another, the stronger the trend.
When the distance between one bar and another begins to decrease, it means that the wave has started to lose its tendency.
So catching the wave with a strong force and going out w
FREE
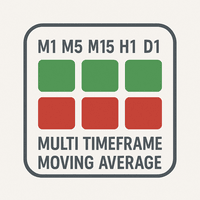
The "MultiTF Moving Average Panel" indicator is more of a helping tool than an indicator, it serves to help know the trend direction for the current currency pair of all timeframes in one place. It is best used with other indicators and signals, to help filter the signals according the trend based on multiple timeframes.
Indicator inputs : - Moving Average period : Default is set to 34. - Moving Average method : The method of calculation of the Moving Average. Default is set to Exponent
FREE

MACD with 4-Color Histogram Overview MACD with 4-Color Histogram is a modern upgrade of the classic MACD indicator — redesigned for clarity, precision, and visual power .
It provides instant insight into market momentum , signal strength , and trend reversals using four distinct color zones that make trading decisions faster and more confident. Color Logic Color Condition Interpretation Green MACD > 0, Signal < MACD Bullish momentum strengthening Orange MACD > 0, Signal > MACD Bul
FREE

The Magic SMA indicator is of great help in determining trend direction. It can be an excellent addition to your existing strategy or the basis of a new one. We humans can make better decisions when we see better visually. So we designed it to show a different color for rising and falling trends. Everyone can customize this in the way that suits them best. By setting the Trend Period, we can optimize it for longer or shorter trends for our strategy. It is great for all time frames.
IF YOU NEED
FREE

**“Multi Trendline Channel With Regression Bands” – Linear Regression Channel + Standard Deviation Band Indicator (MT5)**
This indicator automatically plots multi‑period linear regression channels together with standard deviation bands, giving traders instant clarity on trend direction, price dispersion, and key support/resistance zones. By turning complex analysis into simple, intuitive visuals, it provides discretionary traders with a clear market context at a glance.
### Key Features
FREE
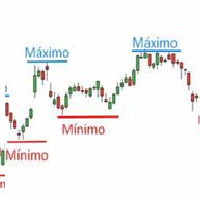
General Description of the Indicator This indicator is a visual tool that plots the high , low , and mid levels of each day on the chart. These levels are calculated based on the daily timeframe (D1) but can be displayed on any other timeframe (M1, M5, H1, etc.). Additionally, the indicator allows: Horizontal shifting of the high and low levels based on a user-specified number of days (parameter Shift ). Limiting the display to a specific number of days (parameter VisibleDays ).
FREE
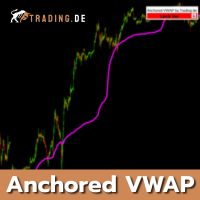
Specially developed Anchored VWAP for MetaTrader 5 (MT5) from Trading.de. To match our day trading strategy, you can place an Anchored VWAP in your chart. The Volume Weighted Average Price indicator can be adjusted in color and also fixed on the chart. It is possible to choose real volume as well as no real volume in the settings. The indicator is best suited for day trading in a 1-minute chart, as you learn in training at Trading.de.
You can use "E" on your Keyboad to lock/unlock the AVWAP, to

Crash 1000 Scalping Indicator for the Crash 1000 Deriv Synthetic Index. Introduction The Crash 1000 Scalping Indicator is a specialized tool designed for the Crash 1000 index on the Deriv Synthetic market. This indicator is particularly useful for scalping on the M1 timeframe, helping traders to identify precise entry and exit points for buy positions. It is designed to be non-repainting, providing clear signals with audible alerts and push notifications, and is compatible with mobile devices th

Alpha Wave Indicator: Pure Precision! This is a tool that will take your trading to the next level. Believe me!! This advanced tool uses a Gaussian window to smooth price data, plotting green upper and red lower bands to identify key trends. With customizable bandwidth, multiplier, and lookback period, plus crossover arrows for clear signals, Alpha Wave helps you navigate the market with confidence. Perfect for traders seeking reliable, non-repainting insights, it can be used on multiple currenc

다중 시간 프레임 이동 평균 OSW
(메타트레이더 5)
이 표시기를 사용하면 모든 유형의 구성에 대한 이동 평균을 추가할 수 있습니다. 단, 시간 프레임에 있는 경우 더 높은 수준에서 추가할 수 있다는 차이점이 있습니다(예: 5분 시간 프레임에 있는 경우). 15분, 1시간, 4시간의 시간성 20의 이동 평균 지수를 보고 싶다면 지표 메뉴에서 올바른 매개변수를 구성해야만 지표 이미지에 표시된 대로 볼 수 있습니다. 다중 시간 프레임 이동 평균 OSW
(메타트레이더 5)
이 표시기를 사용하면 모든 유형의 구성에 대한 이동 평균을 추가할 수 있습니다. 단, 시간 프레임에 있는 경우 더 높은 수준에서 추가할 수 있다는 차이점이 있습니다(예: 5분 시간 프레임에 있는 경우). 15분, 1시간, 4시간의 시간성 20의 이동 평균 지수를 보고 싶다면 지표 메뉴에서 올바른 매개변수를 구성해야만 지표 이미지에 표시된 대로 볼 수 있습니다.

MACD is probably one of the most popular technical indicators out there. When the market is trending, it actually does a pretty good job, but when the market starts consolidating and moving sideways, the MACD performs not so well. SX Impulse MACD for MT4 is available here . Impulse MACD is a modified version of MACD that works very well for trading Forex, stocks, and cryptocurrencies. It has its own unique feature which perfectly filters out the values in a moving average range and enables it
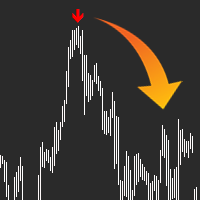
QUICK OVERVIEW: Use AI to predict the markets with AI Arrow, the ultimate trading tool, let it manage the probabilities and send you a simple signal in the form of an arrow, ready to trade, no complex configurations. The indicator will analyze the market and let you know when a potential movement will happen, sometimes it takes some extra bars for the movement to happen as it can't predict the exact top/bottom every time. Arrow will appear at the start of a new bar and alert you, so you have ti
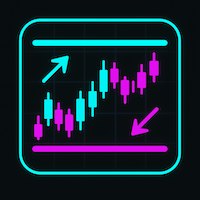
ATT 지지선과 저항선은 프랙탈 원리를 사용하여 실시간으로 지역적 고점과 저점을 찾고 이를 기반으로 주요 지지선과 저항선을 자동으로 표시하는 MetaTrader용 경량 지표입니다. 좁은 간격으로 배치된 선의 "노이즈"를 제거하고, 터미널에 불필요한 부하를 주지 않고 새로운 틱마다 영역을 업데이트합니다. 표시 영역 수를 쉽게 설정하고 조정할 수 있는 고전적인 표시기입니다. 또한 프랙탈 깊이의 복잡성을 조절함으로써도 가능합니다. 입력 설정에서 지정한 포인트 거리보다 레벨 간 거리가 더 가까워지지 않도록 레벨 간 거리를 조정할 수도 있습니다. 더 많은 제품: 여기 ATT 지지선과 저항선의 이점: 모든 기간의 주요 가격 구역을 빠르게 식별합니다. 마감 레벨의 자동 필터링 - 가장 중요한 라인만 필터링 지연 없이 새로운 바가 추가될 때마다 즉시 업데이트됩니다. 터미널 성능에 미치는 영향이 최소화됨 표준 MetaTrader 속성을 통한 편리한 모양 사용자 정의
이 제품에 관심을 가져주셔서
FREE
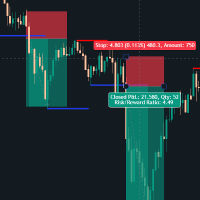
Support & Resistance Breakout Indicator This custom-built MT5 indicator automatically identifies key price levels where the market has historically reversed (support and resistance zones) and alerts traders when these levels are broken with conviction. What it does: The indicator scans price action to detect significant swing highs and lows, then draws dynamic support and resistance lines that extend forward until they're either replaced by a new level or broken by price. When a breakout occurs,

거래의 브레이크아웃을 강화하기 위해 Trendlines with Breaks by LuxAlgo MT5를 사용하세요. 이는 피벗 기반의 혁신적인 지표로, 동적 추세선을 자동으로 그리고 실시간 브레이크아웃을 강조하며, TradingView의 인기 LuxAlgo 스위트에서 유래하여 100,000회 이상 사용되고 긍정적인 리뷰를 받은 지지/저항 수준 탐색 정확성으로 평가됩니다. Reddit 및 YouTube와 같은 거래 커뮤니티에서 비재도색 옵션과 사용자 정의 기울기로 찬사를 받는 이 도구는 외환, 주식, 암호 트레이더에게 추세 반전과 지속을 포착하는 힘을 부여하며, 사용자들은 진입 타이밍 개선과 거짓 신호 감소를 보고—변동성 시장에서 승률을 10-20% 향상시키는 경우가 많습니다, 투기적 이동이 아닌 확인된 브레이크아웃에 집중함으로써. 그 이점에는 공격적 진입을 위한 브레이크아웃 포인트의 정확한 식별, 시장 조건에 맞는 적응형 추세선 경사, 지속 모니터링 없이 앞서 나가기 위한 통합 경

Introducing the BOOM CRASH MASTER Indicator: Unleash the Power of Precision Trading! Step into the world of unparalleled trading with the BOOM CRASH Master Indicator, exclusively designed for the Boom and Crash indices offered by Deriv broker. This cutting-edge tool is your gateway to mastering the art of spike detection and anti-spike entries, ensuring you stay ahead of the market’s every move. Recommendations: Symbols: Any Boom or Crash Index
Timeframe: 1 minute / 5 minutes
Stop Loss: Recent
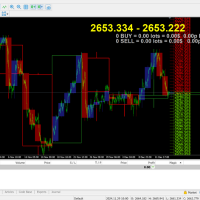
Multi TimeFrame Candle Indicator Description:
Tired of switching between charts to analyze multiple timeframes? The Multi TimeFrame Candle Indicator solves this problem by displaying candlestick data from any higher time frame directly on your current chart. Gain a broader market context and make more informed trading decisions without the clutter. Key Features: View Any Timeframe: Easily display candles from any larger time period (e.g., see H1 candles on your M15 chart). Customizable Appeara
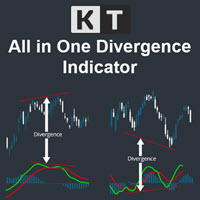
The KT All-In-One Divergence is designed to identify regular and hidden divergences between the price and 11 widely recognized oscillators. This powerful tool is indispensable for swiftly and accurately spotting market reversals. Its a must-have tool in any trader's arsenal, providing clear and accurate divergence patterns. Its accuracy and speed in identifying market reversals are remarkable, allowing traders to seize profitable opportunities confidently.
Features No Interference: You can ad

An indicator to draw a graph of account current and historical state such as Balance, Equity, Margin, Free Margin, Margin Level, Drawdown, Account Profit, Deposit and Withdrawals.
Indicator Inputs : Draw Balance Graph Draw Equity Graph Draw Margin Graph Draw Free Margin Graph Draw Margin Level Graph Draw Drawdown Graph Draw Account Profit Graph Hide Data on Chart and Buffers Connect Gaps by Lines Sign of DDs on Profit Sign of DDs on Loss
Tips : The Indicator will draw historical balance graph

Half-Trend Indicator for MetaTrader5
To download all of our products, you can click this link: LINK
Introduction The Half-Trend Indicator is one of the leading indicators in the market, which helps you enter your trades through the high, low, moving average and ATR.
Specifications platform metatrader5 (MT5) type custom technical trading indicator level beginner timeframes all timeframes from weekly to trading styles scalping - day trading - swing trading - position trading markets forex - cr

Eabotpro Signals v3.0
A professional MetaTrader 5 indicator designed to deliver high-precision trading signals with real-time notifications, trade management tools, and a clean interface. "Recommended Base time frame is 4H Fibo From input . and trade time frame 1 mint , and 5 mint " Key Features: High-Accuracy Signals : Optimized for precision and consistency across different market conditions. Smart Trade Panel : Displays entry price, targets, stop levels, performance stats, and profit trackin

50% off. Original price: $60 Triangle Finder is a multi symbol multi timeframe dashboard that finds symmetrical triangle pattern in 28 symbols and 9 timeframes with a deep scan feature to scan all market watch symbols (up to 1000 instruments!).
Download Demo here (Scans only M1, M5 and M10) Settings description here MT4 version here
Triangle Finder features: Realtime monitoring of 28 customizable instruments and 9 timeframes at the same time. Deep scan mode to scan all market watch symbo

XE Forex Strengh Indicator MT5 displays visual information about direction and strength of a signal for current pair and chosen timeframes (M5, M15, M30 and H1). Calculations are based on multiple factors and results are shown as a colored panel with scale bar, numerical values and arrows. There are also displayed values of current price and spread on the pair. There can be activated an alert (as a mail or pop-up window with sound) for each available timeframes which send a message when the dir
FREE
Andean Oscillator – 추세 변동 오실레이터 시장 강도와 방향을 명확하게 보여줍니다. Andean Oscillator 는 각 자산의 상승 및 하락 변동을 측정하는 고급 오실레이터 로, 주요 구성 요소인 Bull(상승) , Bear(하락) 및 신호를 필터링하고 추세를 확인하는 Signal Line 을 포함합니다. 지수 엔벨로프 와 이동 평균을 사용하여 Andean Oscillator는 추세 강도와 가능한 변화를 명확하고 안정적으로 제공하여 거래에서 유리하게 활용할 수 있습니다. 주요 특징 Bull과 Bear 구성 요소: 가격의 상승 및 하락 변동을 반영. 신호선: 잘못된 신호를 필터링하고 추세를 확인. 간단한 해석: 상승 구성 요소가 하락을 초과 → 상승 추세, 하락 구성 요소가 상승을 초과 → 하락 추세. 반응형 오실레이터: 최대 반응성을 위해 지수 엔벨로프와 이동 평균 기반 계산. 모든 자산과 타임프레임에 호환 가능. 사용 방법 추세 식별: Bull > Bear → 시
FREE

MT5 Version Dashboard: Free scanner to monitor All pairs and timeframes. Please contact me after purchase, i will send it to you! MT4 version indicator: https://www.mql5.com/en/market/product/59127 Tip: This is an indicator for real-time signal display. When the indicator is loaded and running on the chart, the past signal cannot be displayed Market structure changes as price reverses And filter with all import features built inside one tool. Breaker's smart algorithm detects the reverses,

The main purpose of the indicator is to detect and mark trade signals on the histogram of the Awesome Oscillator according to the strategies "Trading Chaos, second edition" and "New Trading Dimensions". The indicator detects and marks the following trade signals: "Two peaks" - Divergence. The signal "Second wise-man" - third consequent bar of the Awesome Oscillator after its color is changed. The histogram crosses the zero line. The signal "Saucer". The indicator includes a signal block that inf
This indicator is based on the RSI (Relative Strength Index) to identify potential Breakout points and draw arrows on the chart to suggest buy/sell signals. Use RSI to find breakout signals. Draw Buy/Sell arrows on the chart. Send alerts when there is a trading signal. Buy (Orange Arrow - 0xFFAA00): When a buy signal appears. Sell (Blue Arrow - 0x0000FF): When a sell signal appears. DRAW_ARROW: Used to draw arrows on the chart.
FREE

The Relative Equilibrium index (REi) is a technical analysis indicator that shows the direction and strength of a trend and indicates the probability of its change. It shows the ratio of the average price increase to the average fall over a certain period of time. The value of the index allows you to assess whether buyers or sellers had a stronger influence on the price over a set period of time and to assume further developments. The indicator is characterized by simplicity of interpretation an
FREE

이 지표는 사용자가 원하는 두 가지 색상 간의 부드러운 전환을 적용하여 차트의 외관을 완전히 변화시킬 수 있도록 설계되었습니다. 이 기능을 통해 차트의 배경에 매력적인 그래디언트를 추가하면 차트가 더욱 신선하고 현대적인 느낌을 주게 됩니다. 시각적으로 더 매력적인 차트를 만들어 거래를 할 때 더욱 쾌적한 경험을 제공할 것입니다. 지표가 차트에 첨부되면 현재 차트에 있는 모든 지표 창에 그래디언트가 자동으로 적용됩니다. 이후에 추가되는 새로운 지표 창에도 동일한 그래디언트 효과가 적용되므로, 모든 지표가 일관된 외관을 유지하게 됩니다. 이 지표를 한 번 사용해 보세요! 차트의 외관을 새롭게 변화시켜 더 매력적이고 눈에 띄는 거래 환경을 만들어 보세요. 그래픽적으로 개선된 차트는 거래에 대한 집중력을 높이고 더 나은 결정을 내리는 데 도움이 될 것입니다.
FREE

일중 통화 강도를 그래픽으로 표현한 것입니다. 계산은 28개 통화쌍을 기반으로 합니다. 값은 일일 캔들 시작 시간부터 현재까지 추적됩니다. 이 지표는 원래 FX28 Trader 대시보드용 무료 도구로 개발되었습니다. 이제 무료로 사용하실 수 있습니다. 이 지표는 다양한 사용자 정의 설정을 제공하며, FX28 Trader 차트 제어 시스템에 직접 연결할 수도 있습니다. 참고! 이 지표는 전략 테스터에서 작동하지 않습니다. 테스트하려면 라이브 차트에서 다운로드하여 설치해야 합니다.
일중 통화 강도를 그래픽으로 표현한 것입니다. 계산은 28개 통화쌍을 기반으로 합니다. 값은 일일 캔들 시작 시간부터 현재까지 추적됩니다. 이 지표는 원래 FX28 Trader 대시보드용 무료 도구로 개발되었습니다. 이제 무료로 사용하실 수 있습니다. 이 지표는 다양한 사용자 정의 설정을 제공하며, FX28 Trader 차트 제어 시스템에 직접 연결할 수도 있습니다. 참고! 이 지표는 전략 테스터에서 작동하
FREE

Burning Scalper - Advanced MFI Trading System
Indicator Description
Burning Scalper is a comprehensive trading system based on an enhanced Money Flow Index (MFI) indicator, designed for precise identification of market entry and exit points. The indicator combines volume and price analysis, providing traders with a complete picture of market dynamics.
Key Features
Intelligent Trading Signals
The indicator automatically identifies optimal market entry points by analyzing extre
FREE

One of the best trend indicators available to the public. Trend is your friend. Works on any pair, index, commodities, and cryptocurrency Correct trend lines Multiple confirmation lines Bollinger Bands trend confirmation Trend reversal prediction Trailing stop loss lines Scalping mini trends Signals Alerts and Notifications Highly flexible Easy settings Let me know in the reviews section what you think about it and if there are any features missing.
Tips: Your confirmation line will predict tre
FREE

Unlock the power of trend analysis with the Candle Trend Bars Indicator – your go-to tool for identifying and understanding market trends like never before. This innovative indicator transforms traditional candlestick charts into a dynamic and visually intuitive representation of market trends. Key Features: Trend Clarity: Gain a clear and concise view of market trends with color-coded bars that instantly convey the direction of price movements. User-Friendly Design: The indicator is designed wi
FREE

The Color Candles Indicator uses custom colors to highlight candles that follow the main market trend, based on the Moving Average. This simplifies the analysis of price movements, making it clearer and more direct. When the price is above the rising Moving Average, candles are highlighted indicating a BUY opportunity. When the price is below the declining Moving Average, candles are highlighted indicating a SELL opportunity.
Input Parameters : Period Method Applied Price
The moving averages
FREE
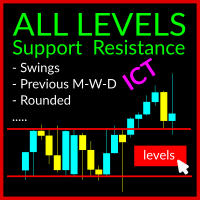
The Swing Levels Support and Resistance Indicator is a robust tool designed for MetaTrader 5 traders (also available for MT4). It aids in identifying crucial market levels where price direction may change by showcasing: Swing High and Swing Lows across all timeframes Previous Highs and Lows for Day, Week, and Month US Midnight level and Yesterday Midnight Level US Preopen 8:30 AM Level Rounded Levels This indicator features a toggle button, enabling you to display or hide these levels on the ch

True Days is a tool designed specifically for the trader who wants to catch intraday volatility in price charts. True day makes it easier for the trader to avoid trading in the dead zone - a period in time where markets are considered dead or non volatile. The trader can concentrate on finding opportunities only during periods of profound market movements. By default the indicator gives you a true day starting at 02:00 to 19:00 hours GMT+2. You can adjust according to your Time Zone. By deafult
FREE

MAD Bands (Moving Average Deviation Bands) MAD Bands are intended to be used when you want to visually check the behavior of price volatility in relation to a moving average.
MAD_Bands (MQL5 version) parameter description This document explains the MT4 parameter input screen for each setting item (input parameter). Group: Main (basic settings) Period Default : 20 Explanation : The number of candlesticks used to calculate the moving average (Mid) and band width. The larger the value
FREE

If you love this indicator, please leave a positive rating and comment, it will be a source of motivation to help me create more products <3 Key Takeaways Fisher is a repaint indicator. It recalculates previous bars when new bars become available. Modified to avoid repainting to accommodate some merchants. Fisher indicator is quite a simple histogram indicator that detects the trend's direction and strength and signals about trend changes. Traders look for extreme readings to signal potential p
FREE
VWAP Indicator, the short form of Volume Weighted Average Price, is similar to a moving average but takes into consideration the tick volume of the candles. The indicator calculates the moving average multiplying the price of each candle for the tick volume in the candle. Said calculation weighs with more significance price where more transactions were made.
Features: Visual styling customizable Period customizable Ease of use
FREE
MultiFrame Pivot: A Multi-Timeframe Analysis Tool MultiFrame Pivot is an analysis indicator designed to provide an overview of the market based on Pivot Points across multiple timeframes. The indicator synthesizes information from different timeframes to give you a more comprehensive view of important price levels. KEY FEATURES: Multi-Timeframe Analysis: MultiFrame Pivot allows you to simultaneously monitor the price's status relative to Pivot Points (PP), Support 1 (S1), and Resistance 1 (R1)
FREE
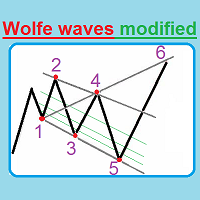
This unique indicator automatically builds Wolfe Waves and features a highly efficient trading strategy. Use If number 5 appears, wait till the first candle is closed behind Moving Average, then look at the three center lines showing what lot volume should be used if the fifth dot crossed the line 25%. The candle is closed behind Moving Average, and then we open a trade with the lot: = (Let's apply the lot of, say, (0.40), divide it into four parts and open a quarter of the lot (0.10)). If the

ICT, SMC, 스마트 머니 컨셉트(Smart Money Concept), 지지 및 저항(Support and Resistance), 추세 분석(Trend Analysis), 가격 행동(Price Action), 시장 구조(Market Structure), 주문 블록(Order Blocks), 브레이커 블록(Breaker Blocks), 모멘텀 변화(Momentum Shift), 강한 불균형(Strong Imbalance), HH/LL/HL/LH, 공정 가치 격차(Fair Value Gap), FVG, 프리미엄 및 디스카운트 영역(Premium & Discount Zones), 피보나치 리트레이스먼트(Fibonacci Retracement), OTE, 매수 측 유동성(Buyside Liquidity), 매도 측 유동성(Sellside Liquidity), 유동성 공백(Liquidity Voids), 시장 세션(Market Sessions), NDOG, NWOG, 실버 불릿(Silv

수익성 있는 시장 동향을 놓치는 데 지쳤습니까? 정확하고 정확하게 추세 지속을 식별할 수 있는 신뢰할 수 있는 도구를 원하십니까?
더 이상 보지 마세요! 당사의 Trend Continuation Indicator는 귀하의 거래 전략을 강화하고 게임에서 앞서 나갈 수 있도록 도와드립니다.
추세 지속 지표는 트레이더가 다양한 금융 시장에서 추세 지속 패턴을 식별하고 확인하는 데 도움을 주기 위해 특별히 제작된 강력한 도구입니다.
주식, 통화, 원자재 또는 지수를 거래할 때 이 지표는 거래 결정을 향상시키는 최고의 동반자입니다. MT4 버전 : WH Trend Continuation MT4
특징:
정확한 추세 확인. 사용자 정의 가능한 매개변수. 사용하기 쉬운 인터페이스. 실시간 알림. 포괄적인 지원. MT5용 Trend Continuation Indicator를 사용하여 거래 전략을 새로운 차원으로 끌어올리십시오. 추세 분석의 힘을 받아들이고 정보에 입각

Do you find it difficult to track and manage your open positions across multiple different symbols in MetaTrader 5? Do you need a quick and comprehensive overview of your current market exposure and the performance of each symbol individually? The "Dynamic Exposure Table" indicator is your ideal tool! This indicator displays a clear and detailed table in a separate window below the chart, summarizing all your open positions and intelligently grouping them by symbol, giving you a complete view of
FREE
MetaTrader 마켓은 과거 데이터를 이용한 테스트 및 최적화를 위해 무료 데모 거래 로봇을 다운로드할 수 있는 유일한 스토어입니다.
어플리케이션의 개요와 다른 고객의 리뷰를 읽어보시고 터미널에 바로 다운로드하신 다음 구매 전 트레이딩 로봇을 테스트해보시기 바랍니다. 오직 MetaTrader 마켓에서만 무료로 애플리케이션을 테스트할 수 있습니다.
트레이딩 기회를 놓치고 있어요:
- 무료 트레이딩 앱
- 복사용 8,000 이상의 시그널
- 금융 시장 개척을 위한 경제 뉴스
등록
로그인
계정이 없으시면, 가입하십시오
MQL5.com 웹사이트에 로그인을 하기 위해 쿠키를 허용하십시오.
브라우저에서 필요한 설정을 활성화하시지 않으면, 로그인할 수 없습니다.