Guarda i video tutorial del Market su YouTube
Come acquistare un Robot di Trading o un indicatore
Esegui il tuo EA
hosting virtuale
hosting virtuale
Prova un indicatore/robot di trading prima di acquistarlo
Vuoi guadagnare nel Market?
Come presentare un prodotto per venderlo con successo
Indicatori tecnici per MetaTrader 5 - 30
Rimani al passo con il momentum del mercato con il Pip Movement Alert MT5, un indicatore versatile a più valute progettato per tracciare e avvisare i trader sui movimenti precisi in pip su più simboli, ideale per il trading di forex, azioni, criptovalute e materie prime. Elogiato nelle comunità di trading come Forex Factory e Reddit’s r/Forex, e evidenziato nelle discussioni su Investopedia e TradingView per la sua capacità di rilevare cambiamenti improvvisi del mercato, questo indicatore è indi
FREE

Forex 17 – Bollinger Bands Pure Sound Alert No Plots genera avvisi sonori quando il prezzo supera la banda superiore o inferiore delle Bollinger Bands. Suoni distinti segnalano i breakout rialzisti e ribassisti, aiutando a identificare condizioni potenzialmente di ipercomprato o ipervenduto. Questa versione senza grafici non disegna elementi visivi sul chart. I parametri configurabili includono periodo, deviazione e intervalli tra gli avvisi. L’approccio solo sonoro è ideale per mantenere i graf
FREE

The Hyper Force indicator, originally created in 1984 by David Weis, indicates in wave form the strength of a symbol's trend.
The bigger the wave, the stronger the trend.
Small waves mean weak trend or market without trend.
In a wave, the greater the difference between one bar and another, the stronger the trend.
When the distance between one bar and another begins to decrease, it means that the wave has started to lose its tendency.
So catching the wave with a strong force and going out w
FREE
Identify trending and flat markets effortlessly
This indicator calculates how much has a symbol moved in relative terms to find trending or flat markets. It displays what percentage of the latest price range is directional. It can be used to avoid trading in flat markets, or to find flat markets to execute range-bound trading strategies. [ Installation Guide | Update Guide | Troubleshooting | FAQ | All Products ] A value of zero means the market is absolutely flat A value of 100 means the marke
FREE

RS Zone is an Indicator used to plot the support and resistance levels of each asset. and each time period as we determine The principle for calculating support and resistance levels is based on the price range (Range SR) to see if there are points where the price repeatedly reverses at that price level or not. The total pot will be equal to the Total SR that we set. Example If Range SR is equal to 120, the system will choose to look at data going back 120 candlesticks to find whether there is a
FREE
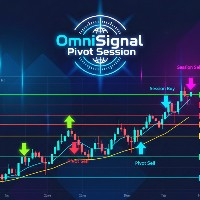
OmniSignal Pivot Session combines two powerful trading concepts— Daily Pivots and (NY, London and COMEX) Session Opening Levels —into one clean, intelligent signal indicator. It's designed to identify key market levels and provide clear, non-repainting entry signals based on a robust 3-candle confirmation pattern , helping you filter out market noise and trade with more confidence.
Suggested Symbols: XAUUSD, US30, DE40
(might have some bugs if you are using it with any Forex Pair!)
Core Fea
FREE
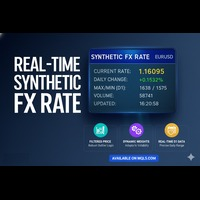
Tasso di Cambio Sintetico in Tempo Reale (Real-Time Synthetic FX Rate) Real-Time Synthetic FX Rate è un indicatore progettato per calcolare una stima sintetica e robusta del tasso di cambio per qualsiasi coppia di valute disponibile sul tuo broker (incluse coppie maggiori, minori ed esotiche). Il suo obiettivo è offrire un riferimento dinamico che rifletta la formazione del prezzo minuto per minuto , fornendo una guida orientativa prima della pubblicazione dei tassi ufficiali o delle validazioni
FREE

A simple volume indicator according to the color of the candle!
- Custom background!
- Supports Volume by Ticks or Real Volume.
The original Metatrader Volume indicator does not show the colors of the bar according to the color of the Candle, it only changes color when the volume of a candle is greater than the previous one, this sometimes creates confusion for beginners and does not know the real reason for the color change.
Free indicator, support may take a while to respond!
FREE

What is this indicator? This indicator is for comparing multiple charts and verifying the chart pattern. Synchronize each chart position with the common vertical line. By changing the chart mode, you can also display the chart like a real trade.
How to set up
1. Scroll the chart of the target currency pair to the end in the past direction and download all the historical data of that currency pair. 2. Install this indicator in the main window of each chart. 3. Customize each parameter on the In

The Magic SMA indicator is of great help in determining trend direction. It can be an excellent addition to your existing strategy or the basis of a new one. We humans can make better decisions when we see better visually. So we designed it to show a different color for rising and falling trends. Everyone can customize this in the way that suits them best. By setting the Trend Period, we can optimize it for longer or shorter trends for our strategy. It is great for all time frames.
IF YOU NEED
FREE

Индикатор для синхронизации и позиционировании графиков на одном и более терминалах одновременно. Выполняет ряд часто необходимых при анализе графиков функций: 1. Синхронизация графиков локально - в пределах одного терминала при прокрутке, изменении масштаба, переключении периодов графиков, все графики делают это одновременно. 2. Синхронизация графиков глобально - тоже самое, но на двух и более терминалах, как МТ5, так и МТ4. 3. Позиционирование графика на заданном месте при переключении периодо
FREE

Highly configurable RSI indicator. Features: Highly customizable alert functions (at levels, crosses, direction changes via email, push, sound, popup) Multi timeframe ability Color customization (at levels, crosses, direction changes) Linear interpolation and histogram mode options Works on strategy tester in multi timeframe mode (at weekend without ticks also) Adjustable Levels Parameters:
RSI Timeframe: You can set the current or a higher timeframes for RSI. RSI Bar Shift: you can set the
FREE

Currency Strength Meter is the easiest way to identify strong and weak currencies. This indicator shows the relative strength of 8 major currencies + Gold: AUD, CAD, CHF, EUR, GBP, JPY, NZD, USD, XAU. Gold symbol can be changed to other symbols like XAG, XAU etc.
By default the strength value is normalised to the range from 0 to 100 for RSI algorithm: The value above 60 means strong currency; The value below 40 means weak currency;
This indicator needs the history data of all 28 major currenc

Gatotkaca Support Resistance Trendline Indicator is a simple indicator that detects support, resistance and trendlines. It will helps you find breakout momentum based on lines calculated by this indicator. This is conceptually based on fractals, but with customizable periods. Compatible for any timeframes. You can customize how this indicator work by setting up the period input.
FREE

Detailed blogpost: https://www.mql5.com/en/blogs/post/766378
Key Features
Adaptive Upper/Lower bands Smooth Center Line Customizable Length (sensitivity) Non-Repainting (only current ongoing bar is updated every "Refresh After Ticks" number of ticks) Multiple Price Sources - Choose from close, open, high, low, median, typical, or weighted close Components:
The Basis Line The smooth center line represents the weighted average of price. Think of this as the "true" price level when all the noise
FREE
SignalFlow Pro - Professional Trend Analysis System SignalFlow Pro is a modern trend-following indicator designed to identify market reversals accurately and timely. Key Features: Dual-Color Trend Lines: Turquoise line - uptrend Fuchsia line - downtrend Clear visual separation for easy trend identification Signal Arrows: Blue arrow (↑) - Buy signal Pink arrow (↓) - Sell signal Arrows appear automatically when trend changes Customizable Parameters: Amplitude (2) - sensitivity level Arrow codes a
FREE

PGSindicator for MetaTrader 5 Free Companion Indicator for Profit Guard System Trade Panel. *** The attached video is the " PGS Trade Panel Tutorial Part 1 " *** (4m video) Adjust >>> **** EMA1 N-Pips Separation from EMA2
This setting defines the minimum distance required between EMA1 and EMA2 before a trend condition is considered valid.
The default value is 100.0 pips for NASDAQ 100, 1 minute CHART . Depending on how your broker calculates pip values, you may adjust this to 20.0 or 10.0
FREE

MACD with 4-Color Histogram Overview MACD with 4-Color Histogram is a modern upgrade of the classic MACD indicator — redesigned for clarity, precision, and visual power .
It provides instant insight into market momentum , signal strength , and trend reversals using four distinct color zones that make trading decisions faster and more confident. Color Logic Color Condition Interpretation Green MACD > 0, Signal < MACD Bullish momentum strengthening Orange MACD > 0, Signal > MACD Bul
FREE

Smart Super Trend Indicator (Free) Turn volatility into opportunity — Catch trends early and trade smarter The Supertrend Indicator is one of the most trusted tools in technical analysis, designed to help traders quickly identify the prevailing market trend and spot potential entry and exit points with precision. Built on price action and volatility, this trend-following indicator adapts dynamically to market conditions, making it a powerful companion for both beginners and experienced traders.
FREE
ATT Support and Resistance è un indicatore leggero per MetaTrader che individua massimi e minimi locali in tempo reale utilizzando il principio frattale e traccia automaticamente i livelli di supporto e resistenza significativi in base a essi. Altri prodotti: Qui Rimuove il "rumore" delle linee ravvicinate e aggiorna le zone a ogni nuovo tick senza caricare inutilmente il terminale. Indicatore classico con la massima facilità di configurazione e regolazione del numero di zone da visualizzare.
FREE

One of the best trend indicators available to the public. Trend is your friend. Works on any pair, index, commodities, and cryptocurrency Correct trend lines Multiple confirmation lines Bollinger Bands trend confirmation Trend reversal prediction Trailing stop loss lines Scalping mini trends Signals Alerts and Notifications Highly flexible Easy settings Let me know in the reviews section what you think about it and if there are any features missing.
Tips: Your confirmation line will predict tre
FREE

Индикатор Trade in trend предназначен для торговли по тренду. Сила тренда определяется шириной линии. Узкая линия - начало или конец тренда. Широкая линия свидетельствует о высокой силе тренда. Резкая смена ширины линии свидетельствует, с большой вероятностью, об окончании тенденции. Сигналы индикатора Не против покупки: переход с красной линии в белую цена отразилась от белой линии индикатора цена находится выше белой линии индикатора Не против продажи: переход с белой линии в красную цена отр
FREE

Smart Risk Manager FOREX – Free On-Chart Lot Size Helper Smart Risk Manager Forex is the free & simplified edition of the Smart Risk Manager family. It helps you calculate your position size on Forex pairs using a clean drag-and-release workflow. Just drag on the chart and the indicator shows the recommended lot size based on your RiskUSD amount. It is small, fast and easy to use. Features ️ Drag-to-measure lot size directly on the chart ️ Clean & very lightweight – no panels, no clutter
FREE

EMA SMA Gold Scalper is a precision scalping indicator developed for XAUUSD (Gold) traders. It combines the dynamic responsiveness of the 55 EMA (High/Low) with the broader market direction filter of the 200 SMA , delivering clean and actionable Buy/Sell signals. The indicator also includes real-time "Live Blue Arrows" , which notify traders when an entry setup is forming—giving you a critical edge before the candle closes. This tool is optimized and recommend for M5 scalping a
FREE

。。。。。。。。。。。。。。。。。。。。。。。。。。。。。。。。。。。。。。。。。。。 This indicator is based on Bollinger Bands indicator. It helps user clearly know the Band is expand or contract.
The method of use is the same as the traditional Brin channel index. Users can use different color areas to distribute forest channel indicators in expansion or contraction stage. -------------------------------------------------------------------------------------------
FREE
Simple SuperTrend indicator, similar to that of TradingView's.
It has buffers for buy and sell signal, if you want to integrate this into an EA.
It helps traders easily identify trends by providing clear buy and sell signals based on price movements. Designed for simplicity, it’s easy to use and integrates well with various trading strategies, making it a great option for traders of all levels.
Happy trading!
FREE

1. Introduction The CM_Ultimate_RSI_MTF is a powerful and versatile custom indicator for MetaTrader 5, designed to enhance your Relative Strength Index (RSI) analysis. It provides multi-timeframe (MTF) capabilities, visual signals, and customizable alerts, making it an invaluable tool for traders seeking to identify overbought/oversold conditions, trend strength, and potential entry/exit points across various timeframes. 2. Key Features Multi-Timeframe (MTF) Analysis: Allows you to view RSI from
FREE
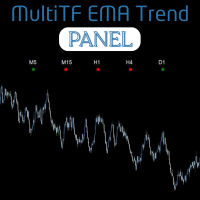
The MultiTF EMA Trend Panel is a clean, lightweight, and visually intuitive indicator designed to help traders quickly assess trend direction across multiple timeframes — all in one glance. It compares the relationship between two exponential moving averages (EMAs), typically the 50 EMA vs 200 EMA , across popular timeframes such as M5, M15, H1, H4, and D1 . You can customize the EMA settings and colors to match your own strategy or visual preferences. Key Features Multi-timeframe trend comparis
FREE
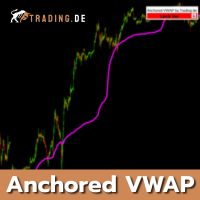
Specially developed Anchored VWAP for MetaTrader 5 (MT5) from Trading.de. To match our day trading strategy, you can place an Anchored VWAP in your chart. The Volume Weighted Average Price indicator can be adjusted in color and also fixed on the chart. It is possible to choose real volume as well as no real volume in the settings. The indicator is best suited for day trading in a 1-minute chart, as you learn in training at Trading.de.
You can use "E" on your Keyboad to lock/unlock the AVWAP, to

Crash 1000 Scalping Indicator for the Crash 1000 Deriv Synthetic Index. Introduction The Crash 1000 Scalping Indicator is a specialized tool designed for the Crash 1000 index on the Deriv Synthetic market. This indicator is particularly useful for scalping on the M1 timeframe, helping traders to identify precise entry and exit points for buy positions. It is designed to be non-repainting, providing clear signals with audible alerts and push notifications, and is compatible with mobile devices th

Alpha Wave Indicator: Pure Precision! This is a tool that will take your trading to the next level. Believe me!! This advanced tool uses a Gaussian window to smooth price data, plotting green upper and red lower bands to identify key trends. With customizable bandwidth, multiplier, and lookback period, plus crossover arrows for clear signals, Alpha Wave helps you navigate the market with confidence. Perfect for traders seeking reliable, non-repainting insights, it can be used on multiple currenc

MULTI TIME FRAME MEDIA MOBILE OSW
(METATRADER 5)
Questo indicatore ti permetterà di aggiungere medie mobili di tutti i tipi di configurazione, con la differenza che se sei in un timeframe puoi aggiungere quella di livello superiore, per fare un esempio, se sei in un timeframe di 5 minuti e vuoi vedere l'esponenziale della media mobile di 20 della temporalità di 15 minuti, 1 ora e 4 ore, solo configurando i parametri corretti nel menu dell'indicatore potrai vederli come mostrato nelle immagini

MACD is probably one of the most popular technical indicators out there. When the market is trending, it actually does a pretty good job, but when the market starts consolidating and moving sideways, the MACD performs not so well. SX Impulse MACD for MT4 is available here . Impulse MACD is a modified version of MACD that works very well for trading Forex, stocks, and cryptocurrencies. It has its own unique feature which perfectly filters out the values in a moving average range and enables it
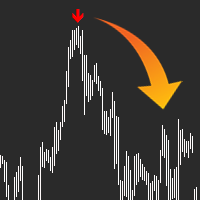
QUICK OVERVIEW: Use AI to predict the markets with AI Arrow, the ultimate trading tool, let it manage the probabilities and send you a simple signal in the form of an arrow, ready to trade, no complex configurations. The indicator will analyze the market and let you know when a potential movement will happen, sometimes it takes some extra bars for the movement to happen as it can't predict the exact top/bottom every time. Arrow will appear at the start of a new bar and alert you, so you have ti
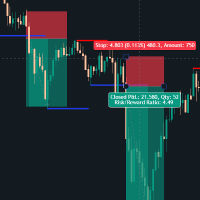
Support & Resistance Breakout Indicator This custom-built MT5 indicator automatically identifies key price levels where the market has historically reversed (support and resistance zones) and alerts traders when these levels are broken with conviction. What it does: The indicator scans price action to detect significant swing highs and lows, then draws dynamic support and resistance lines that extend forward until they're either replaced by a new level or broken by price. When a breakout occurs,

Migliora il tuo trading di breakouts con il Trendlines with Breaks by LuxAlgo MT5, un indicatore innovativo basato su pivots che disegna automaticamente linee di tendenza dinamiche e evidenzia breakouts in tempo reale, ispirato alla popolare suite LuxAlgo su TradingView dove ha accumulato oltre 100.000 usi e recensioni positive per la sua accuratezza nel rilevare livelli di supporto/resistenza. Celebrato nelle comunità di trading come Reddit e YouTube per la sua opzione non ridipinta e pendenze

Introducing the BOOM CRASH MASTER Indicator: Unleash the Power of Precision Trading! Step into the world of unparalleled trading with the BOOM CRASH Master Indicator, exclusively designed for the Boom and Crash indices offered by Deriv broker. This cutting-edge tool is your gateway to mastering the art of spike detection and anti-spike entries, ensuring you stay ahead of the market’s every move. Recommendations: Symbols: Any Boom or Crash Index
Timeframe: 1 minute / 5 minutes
Stop Loss: Recent
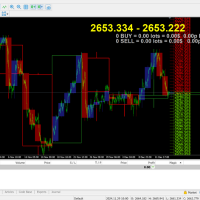
Multi TimeFrame Candle Indicator Description:
Tired of switching between charts to analyze multiple timeframes? The Multi TimeFrame Candle Indicator solves this problem by displaying candlestick data from any higher time frame directly on your current chart. Gain a broader market context and make more informed trading decisions without the clutter. Key Features: View Any Timeframe: Easily display candles from any larger time period (e.g., see H1 candles on your M15 chart). Customizable Appeara
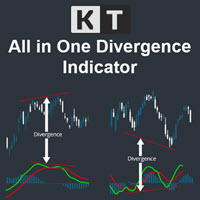
The KT All-In-One Divergence is designed to identify regular and hidden divergences between the price and 11 widely recognized oscillators. This powerful tool is indispensable for swiftly and accurately spotting market reversals. Its a must-have tool in any trader's arsenal, providing clear and accurate divergence patterns. Its accuracy and speed in identifying market reversals are remarkable, allowing traders to seize profitable opportunities confidently.
Features No Interference: You can ad

An indicator to draw a graph of account current and historical state such as Balance, Equity, Margin, Free Margin, Margin Level, Drawdown, Account Profit, Deposit and Withdrawals.
Indicator Inputs : Draw Balance Graph Draw Equity Graph Draw Margin Graph Draw Free Margin Graph Draw Margin Level Graph Draw Drawdown Graph Draw Account Profit Graph Hide Data on Chart and Buffers Connect Gaps by Lines Sign of DDs on Profit Sign of DDs on Loss
Tips : The Indicator will draw historical balance graph

Half-Trend Indicator for MetaTrader5
To download all of our products, you can click this link: LINK
Introduction The Half-Trend Indicator is one of the leading indicators in the market, which helps you enter your trades through the high, low, moving average and ATR.
Specifications platform metatrader5 (MT5) type custom technical trading indicator level beginner timeframes all timeframes from weekly to trading styles scalping - day trading - swing trading - position trading markets forex - cr

Eabotpro Signals v3.0
A professional MetaTrader 5 indicator designed to deliver high-precision trading signals with real-time notifications, trade management tools, and a clean interface. "Recommended Base time frame is 4H Fibo From input . and trade time frame 1 mint , and 5 mint " Key Features: High-Accuracy Signals : Optimized for precision and consistency across different market conditions. Smart Trade Panel : Displays entry price, targets, stop levels, performance stats, and profit trackin
50% off. Original price: $60 Triangle Finder is a multi symbol multi timeframe dashboard that finds symmetrical triangle pattern in 28 symbols and 9 timeframes with a deep scan feature to scan all market watch symbols (up to 1000 instruments!).
Download Demo here (Scans only M1, M5 and M10) Settings description here MT4 version here
Triangle Finder features: Realtime monitoring of 28 customizable instruments and 9 timeframes at the same time. Deep scan mode to scan all market watch symbo

USD STRENGHT VERSUS MARKET USD (DXY) Versus Market Panel is a professional visual indicator designed to analyze US Dollar strength and pressure against major trading symbols in real time. The indicator compares USD performance (based on DXY logic or internal strength calculation) versus selected symbols, allowing traders to quickly identify dominant currency flow, relative strength, and market bias from a single panel view. Built with a clean, lightweight, and non-intrusive panel , this tool hel
FREE

Necessary for traders: tools and indicators Waves automatically calculate indicators, channel trend trading Perfect trend-wave automatic calculation channel calculation , MT4 Perfect trend-wave automatic calculation channel calculation , MT5 Local Trading copying Easy And Fast Copy , MT4 Easy And Fast Copy , MT5 Local Trading copying For DEMO Easy And Fast Copy , MT4 DEMO Easy And Fast Copy , MT5 DEMO Fibo: from KTrade 1. Automatically calculate and analyze the band. -> Get the desired band 2.
FREE

This indicator plots the calculated levels of the IBOV's "thousand" regions on the mini-index, where there is strong institutional commitment, based on their Options Lock positions. In this sense, players tend to defend their positions, acting on the mini-index. With these regions on the chart, you can use the concept of bipolarity to seek trades both in defense and in post-breakout testing. If you're interested, see the link where B3 provides information on options positions for these price lev
FREE

Do you find it difficult to track and manage your open positions across multiple different symbols in MetaTrader 5? Do you need a quick and comprehensive overview of your current market exposure and the performance of each symbol individually? The "Dynamic Exposure Table" indicator is your ideal tool! This indicator displays a clear and detailed table in a separate window below the chart, summarizing all your open positions and intelligently grouping them by symbol, giving you a complete view of
FREE

XE Forex Strengh Indicator MT5 displays visual information about direction and strength of a signal for current pair and chosen timeframes (M5, M15, M30 and H1). Calculations are based on multiple factors and results are shown as a colored panel with scale bar, numerical values and arrows. There are also displayed values of current price and spread on the pair. There can be activated an alert (as a mail or pop-up window with sound) for each available timeframes which send a message when the dir
FREE
Andean Oscillator – Indicatore di Variazioni di Tendenza Visualizza chiaramente forza e direzione del mercato. L' Andean Oscillator è un oscillatore avanzato che misura le variazioni rialziste e ribassiste di ogni asset tramite le sue componenti principali: Bull (rialzista) , Bear (ribassista) e una Signal Line che filtra i falsi segnali e conferma le tendenze. Utilizzando envelopes esponenziali e medie mobili, l’Andean Oscillator offre una visione chiara e stabile della forza della tendenza e d
FREE

QuantumAlert CCI Navigator is a free indicator available for MT4/MT5 platforms, its work is to provide "alerts" when the market is inside "overbought and oversold" regions in the form of "buy or sell" signals. This indicator comes with many customization options mentioned in the parameter section below, user can customise these parameters as needful. Join our MQL5 group , where we share important news and updates. You are also welcome to join our private channel as well, contact me for the pri
FREE

MT5 Version Dashboard: Free scanner to monitor All pairs and timeframes. Please contact me after purchase, i will send it to you! MT4 version indicator: https://www.mql5.com/en/market/product/59127 Tip: This is an indicator for real-time signal display. When the indicator is loaded and running on the chart, the past signal cannot be displayed Market structure changes as price reverses And filter with all import features built inside one tool. Breaker's smart algorithm detects the reverses,

The main purpose of the indicator is to detect and mark trade signals on the histogram of the Awesome Oscillator according to the strategies "Trading Chaos, second edition" and "New Trading Dimensions". The indicator detects and marks the following trade signals: "Two peaks" - Divergence. The signal "Second wise-man" - third consequent bar of the Awesome Oscillator after its color is changed. The histogram crosses the zero line. The signal "Saucer". The indicator includes a signal block that inf

DaySpread MinMax — indicatore di spread con Min/Max giornalieri
Cosa mostra: Spread attuale (Cur) Spread minimo del giorno (Min.day) Spread massimo del giorno (Max.day) Come funziona: Ogni 1 secondo l’indicatore legge i prezzi Bid/Ask del simbolo corrente. Lo spread attuale viene calcolato come (Ask − Bid) / Point (in punti). Min.day/Max.day vengono aggiornati durante la giornata e si azzerano con l’inizio di un nuovo giorno di trading (D1). Le informazioni vengono mostrate sul grafico come pann
FREE
GridLinesX is a lightweight and efficient utility for MetaTrader 5 designed to help traders visualize price levels with precision. Whether you are a Grid Trader, a Scalper, or simply need to mark psychological price levels, GridLinesX automates the process instantly. Forget about drawing manual horizontal lines one by one. Simply define your High/Low range and the grid step (in points), and the tool will generate a clean, customizable grid overlay on your chart. Key Features: Customizable Range:
FREE
MultiFrame MA: A Multi-Timeframe Trend Indicator MultiFrame MA is a trend analysis indicator designed to provide a comprehensive market overview across various timeframes. Instead of relying on a single timeframe, this tool synthesizes information from multiple charts, giving users a holistic and reliable perspective. KEY FEATURES: Multi-Timeframe Analysis: The indicator analyzes data from various timeframes, from M1 up to Monthly, to help users identify trend confluence at different levels. MA
FREE
NtickChart-BVcandle Features This is a free version with limited functionality.
This is a tick chart indicator that displays in a sub-window. Inspired by Bob Volman's (BV) scalping method, it is designed as a tool for achieving simple and effective trading. It is a tick chart specifically for day trading and scalping, focusing even on 1 pipette changes. Instead of time-based candle bars, it generates candle bars for a specified number of ticks (ticks_in_candle). This allows for a more detailed
FREE
MACD MTF 1 – Multi-Timeframe MACD A professional MACD indicator supporting all timeframes!
Displays the histogram and signal line clearly in a separate window, helping you to: Identify current market momentum. Track market reversals easily. Choose optimal entry and exit points without switching timeframes. Adjustable Settings: Timeframe for any strategy. Fast and Slow Moving Averages. Signal line sensitivity. Perfect for all trading styles: scalping, daily, and long-term trading.
FREE

TrendBite v1.5 - Indicatore professionale di monitoraggio dei trend Sviluppatore: 8aLt4 Versione: 1.5 Piattaforma: MetaTrader 5
Panoramica TrendBite v1.5 è un indicatore di analisi tecnica avanzato progettato per individuare i cambiamenti di tendenza sul mercato e fornire agli investitori segnali di acquisto e vendita chiari. Basato sull'algoritmo delle bande di Bollinger, questo strumento rileva con precisione le inversioni di tendenza ed è ideale sia per i principianti che per i trader espe
FREE
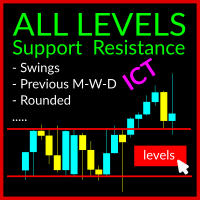
The Swing Levels Support and Resistance Indicator is a robust tool designed for MetaTrader 5 traders (also available for MT4). It aids in identifying crucial market levels where price direction may change by showcasing: Swing High and Swing Lows across all timeframes Previous Highs and Lows for Day, Week, and Month US Midnight level and Yesterday Midnight Level US Preopen 8:30 AM Level Rounded Levels This indicator features a toggle button, enabling you to display or hide these levels on the ch

Trading Exporter for AI Assistant Trading Exporter for AI Assistant è un indicatore professionale per MetaTrader 5, progettato per esportare dati di trading completi e strutturati in formato JSON. Il suo obiettivo è permettere a qualsiasi assistente di Intelligenza Artificiale (IA) — che sia gratuito o a pagamento come ChatGPT, Gemini, Copilot, Claude o DeepSeek — di analizzare le informazioni e offrire raccomandazioni, strategie e spiegazioni personalizzate. Raccomandazione Speciale: DeepSeek S
FREE

If you love this indicator, please leave a positive rating and comment, it will be a source of motivation to help me create more products <3 Key Takeaways Fisher is a repaint indicator. It recalculates previous bars when new bars become available. Modified to avoid repainting to accommodate some merchants. Fisher indicator is quite a simple histogram indicator that detects the trend's direction and strength and signals about trend changes. Traders look for extreme readings to signal potential p
FREE

SuperTrend Pro – Advanced Trend Detection Indicator (MT5) SuperTrend Pro is a modern, optimized trend-following indicator for MetaTrader 5 , designed to deliver clear trend direction, precise market structure, and a premium visual trading experience . It is based on an enhanced ATR-powered SuperTrend algorithm , combined with smart visuals, chart styling, and a real-time information panel. -Key Features - Advanced SuperTrend Logic Uses ATR (Average True Range) with adjustable Period and Multipli
FREE
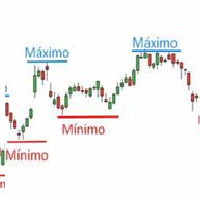
General Description of the Indicator This indicator is a visual tool that plots the high , low , and mid levels of each day on the chart. These levels are calculated based on the daily timeframe (D1) but can be displayed on any other timeframe (M1, M5, H1, etc.). Additionally, the indicator allows: Horizontal shifting of the high and low levels based on a user-specified number of days (parameter Shift ). Limiting the display to a specific number of days (parameter VisibleDays ).
FREE
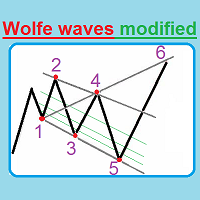
This unique indicator automatically builds Wolfe Waves and features a highly efficient trading strategy. Use If number 5 appears, wait till the first candle is closed behind Moving Average, then look at the three center lines showing what lot volume should be used if the fifth dot crossed the line 25%. The candle is closed behind Moving Average, and then we open a trade with the lot: = (Let's apply the lot of, say, (0.40), divide it into four parts and open a quarter of the lot (0.10)). If the

ICT, SMC, Smart Money Concept, Support and Resistance, Trend Analysis, Price Action, Market Structure, Order Blocks, Breaker Blocks, Momentum Shift, Strong Imbalance, HH/LL/HL/LH, Fair Value Gap, FVG, Premium & Discount Zones, Fibonacci Retracement, OTE, Buyside Liquidity, Sellside Liquidity, Liquidity Voids, Market Sessions, NDOG, NWOG,Silver Bullet,ict template
Nel mercato finanziario, un'analisi di mercato accurata è cruciale per gli investitori. Per aiutare gli investitori a comprendere me

Sei stanco di perdere le tendenze di mercato redditizie? Vorresti avere uno strumento affidabile in grado di identificare le continuazioni del trend con precisione e accuratezza?
Non guardare oltre! Il nostro indicatore di continuazione del trend è qui per potenziare la tua strategia di trading e aiutarti a stare al passo con il gioco.
L'indicatore di continuazione del trend è un potente strumento, creato appositamente per assistere i trader nell'identificazione e nella conferma dei modelli d

Indicatore per il trading manuale e l'analisi tecnica per il Forex.
È costituito da un indicatore di tendenza con il livello di apertura del giorno di negoziazione e da un indicatore a freccia per determinare i punti di ingresso.
L'indicatore non si ricolora; funziona quando la candela si chiude.
Contiene diversi tipi di avvisi per le frecce di segnalazione.
Può essere configurato per funzionare su qualsiasi grafico, strumento di trading o intervallo di tempo.
La strategia di lavoro si basa su
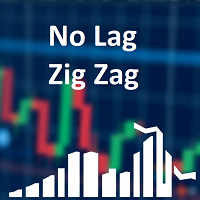
Classic ZigZag formula. But no lags and repaints. You can see on screenshots that it shows values between peaks and it is useful to test strategies based on indicator. Because sometimes people find a good idea about it but don't understand that repainting indicators have some things to keep in mind. The parameters are the same as original ZigZag indicator: Depth, Deviation and Backstep. Useful for visual analyze of the chart and cut strategies based on repainting peaks.
FREE

The Expert Advisor for this Indicator can be found here: https://www.mql5.com/en/market/product/116472 Introducing the Rejection Candle MT5 Indicator, a robust tool designed to revolutionize your trading experience on the MetaTrader 5 platform. Built to pinpoint potential reversals with precision, this indicator offers unparalleled insights into market sentiment shifts, empowering traders to seize profitable opportunities with confidence. Key Features: Advanced Rejection Candle Detection: Uncov
FREE
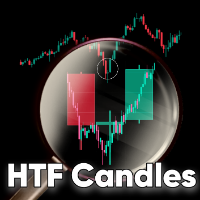
HTF Candles is an indicator which plots the outline of the higher time-frame candles on the lower candle. The indicator gives you the option to choose whether or not to view live current HTF candle, with no lag or repainting. Features No objects drawn on chart: The indicator does not plot any lines or rectangle objects on the chart, it simply draws the htf candles. This keeps your chart simple and clean. MTF Selection: The indicator allows you to choose all the different higher time-frames for e
Il MetaTrader Market offre un luogo pratico e sicuro dove acquistare applicazioni per la piattaforma MetaTrader. Scarica versioni demo gratuite di Expert Advisors e indicatori direttamente dal tuo terminale e testali nello Strategy Tester.
Prova le applicazioni in diverse modalità per monitorare le prestazioni ed effettuare pagamenti per i prodotti desiderati, utilizzando il sistema di pagamento MQL5.community.
Ti stai perdendo delle opportunità di trading:
- App di trading gratuite
- Oltre 8.000 segnali per il copy trading
- Notizie economiche per esplorare i mercati finanziari
Registrazione
Accedi
Se non hai un account, registrati
Consenti l'uso dei cookie per accedere al sito MQL5.com.
Abilita le impostazioni necessarie nel browser, altrimenti non sarà possibile accedere.