Regardez les tutoriels vidéo de Market sur YouTube
Comment acheter un robot de trading ou un indicateur
Exécutez votre EA sur
hébergement virtuel
hébergement virtuel
Test un indicateur/robot de trading avant d'acheter
Vous voulez gagner de l'argent sur Market ?
Comment présenter un produit pour qu'il se vende bien
Indicateurs techniques pour MetaTrader 5 - 15

Highly configurable Macd indicator.
Features: Highly customizable alert functions (at levels, crosses, direction changes via email, push, sound, popup) Multi timeframe ability Color customization (at levels, crosses, direction changes) Linear interpolation and histogram mode options Works on strategy tester in multi timeframe mode (at weekend without ticks also) Adjustable Levels Parameters:
Stochastic RSI Timeframe: You can set the lower/higher timeframes for Stochastic RSI. Stochastic RSI
FREE
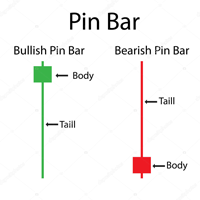
Pin bar pattern is characterized by a long upper or lower wick with a small body relative to the size of the wick with little to no lower or upper shadows. Pin bars are not to be traded in isolation , but need to be considered within the larger context of the chart analysis. A pin bar entry signal, in a trending market, can offer a very high-probability entry and a good risk to reward scenario.
Inputs Multiplier ; AlertOn - enable alerts; EmailAlert - enable email alerts; PushAlert - en
FREE

Développement de la version précédente de l'indicateur ZigZag WaveSize MT4 ZigZag WaveSize - indicateur standard ZigZag modifié avec ajout d'informations sur la longueur d'onde en points, niveaux et différentes logiques d'alertes
Améliorations générales : Adaptation du code pour MetaTrader 5 Travail optimisé avec les objets graphiques Nouveautés : Niveaux horizontaux aux extrêmes Choix du type de niveaux : horizontal/rayons/segments Filtre de niveaux liquides (non percés par le prix) Tampon po
FREE

Market Structure Highs and Lows Overview:
Market Structure Highs and Lows is a professional indicator that automatically detects and visualizes key price structure points — Higher Highs (HH), Higher Lows (HL), Lower Highs (LH), and Lower Lows (LL). It helps traders clearly see trend direction, reversals, and market flow through a clean ZigZag structure. How it works:
The indicator analyzes swing points using a ZigZag algorithm to define structural highs and lows. Uptrend: Sequence of HH and H
FREE

1. Overview The Scalping PullBack Signal indicator is a powerful technical analysis tool designed to help traders identify scalping opportunities based on potential pullback and reversal signals. This tool is particularly useful on lower timeframes (below 15 minutes) but can also be applied on higher timeframes for longer-term trades. This indicator integrates several key analytical components, providing a comprehensive view of trends and potential entry/exit points, helping you make quick and e
FREE
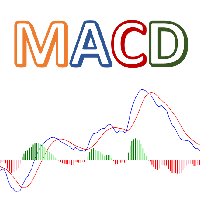
Colorful MACD is MT5 version of TradingView default MACD. This indicator has 4 different colors for MACD histogram, so it's so easy to detect fluctuations in histogram. Features: Colorful Histogram Bars Show/Hide Signal Line Show/Hide MACD Line Flexible price control Please call me if you need more input parameters or modified version of this indicator.
FREE

The indicator draws the daily open line. Parameters
GMT shift (minutes) The time zone could be shifted. The value is given in minutes. Draw closest regular bar's open price This parameter could fine-tune the open price line when using GMT shift. Yes - Draw the open line based on the current chart period's closest regular bar No - Draw the open line based on the M1 chart's closest bar. Let's assume that your shift is 10 minutes, and you are using H1 chart and the first candle in every day is 0
FREE
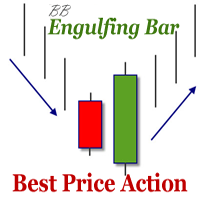
The indicator defines the Bullish and Bearish Engulfing Bar. The pattern has greater reliability when the open price of the engulfing candle is well above the close of the first candle, and when the close of the engulfing candle is well below the open of the first candle. For an engulfing bar to be valid it must fully engulf at least one previous bar or candle - includes all the body and the wick. The engulfing bar can engulf more than one bar as long as it completely engulfs the previous bar.
FREE

Bring the popular "Crosshair with Magnet Mode" functionality from modern charting platforms directly to your MetaTrader 5 terminal. Crosshair for MT5 is a precision utility tool designed for traders who demand accuracy. Unlike the standard MT5 crosshair, this smart tool automatically detects Open, High, Low, and Close prices on your candles. When your mouse hovers near a candle, the crosshair "snaps" to the nearest wick or body price, ensuring you are looking at the exact price level every tim
FREE

ZPOWER BUY & SELL INDICATOR
Trade Smarter. Trade Confidently. Trade Profitably.
Are you tired of second-guessing your trades? Do you enter late and exit too early — leaving money on the table? It’s time to upgrade your strategy with the ZPOWER BUY & SELL INDICATOR, built with institutional-grade logic that helps you catch high-probability trade setups with precision.
Why ZPOWER is Different
Unlike ordinary indicators that flood your charts with noise, ZPOWER is engineered with advanced
FREE

Magic Candles est un nouveau produit qui permet d'identifier la phase actuelle du marché (tendance haussière, baissière ou plate).
Cet indicateur peint des barres de différentes couleurs en fonction de l'état actuel du marché et signale à l'utilisateur les changements de tendance avec des alertes.
Magic Candles est parfait pour trader des devises (y compris les crypto-monnaies) et des options binaires.
Avantages Convient pour le scalping et le trading intrajournalier. L'indicateur ne redessi

Linear Regression Trending indicator analyzes price trends by plotting a linear regression channel based on user-defined parameters such as source (for example, close prices), channel length, and deviation multiplier.
How It Works: - The indicator calculates a linear regression line over the specified length, forming a channel with upper and lower boundaries offset by the deviation value. - It detects price breaks from the channel and optionally displays broken channel lines (in a customizable
FREE
Reverse RSI Signals Indicator
The Reverse RSI Signals indicator is a versatile technical analysis tool designed for MetaTrader 5 (MT5). It transforms traditional RSI calculations into dynamic price-based bands, integrates Supertrend for trend identification, and includes divergence detection for potential reversal signals. This overlay indicator provides visual and alert-based insights to help traders spot overbought/oversold conditions, trend shifts, and momentum divergences directly on the p
FREE

The Volume Weighted Moving Average (VWMA) is calculated based on Prices and their related Volumes giving importance to those candles with more Volume. During periods of almost equal volume distributed along the observed period (commonly, in low volume periods) the VWMA will be graphically similar to a Simple Moving Average. Used along other moving averages a VWMA could be used as an alert, filter or whatever your imagination could think of...
HOW TO "READ" THIS INDICATOR As any Moving Average.
FREE

VJ Sniper - MT5 Buy / Sell Indicator: This Indicator is as simple as Buy in Up Trend & Sell in Down Trend. There are Support / Resistance Graphic levels for choosing the best Entries. Background: Any in-built indicator of MT5 does not work as stand alone such as Stochastic, CCI or DeMarker etc. But combination of them with trend projection work & give the best results for Trading entries. So this Indicator is blended to give the best

INFOPad est un panneau d'information qui crée des informations sur la paire de devises sélectionnée dans le terminal MetaTrader 5. Il y a 5 fonctions de cet indicateur : Affiche les informations principales et principales sur le symbole sélectionné : Ask BID, Spread, Stop Level, Swap, Tick value, Commissions ; Affiche les objectifs futurs de la cible SL et de la cible TP (le nombre de points du stop loss et du take profit établis, le montant en dollars); Il montre le bénéfice reçu pour les péri
FREE

The Supertrend indicator is a trend-following technical analysis tool designed to help traders identify the direction of market trends and potential entry/exit points. It operates based on price data and Average True Range (ATR) to create a dynamic signal line that changes color depending on the current trend. Green color: Indicates an uptrend. Red color: Indicates a downtrend. Supertrend is a useful indicator for both short-term and long-term trading, helping to filter out market noise and focu
FREE

The draws trend lines with adjustable trend width, with trend breakout settings and notifications of trend breakout (Alert, Sound, Email) and of a new appeared arrow. Arrows point at the direction of the order to open (BUY, SELL).
Parameters MaxHistoryBars - the number of bars in the history. Depth (0 = automatic settings) - Search area. width trend ( 0 = automatic settings) - Trend width. (true = closed bars on direction trend),(false = just closed bars for line) - true = closure of candlestic
Introduction à l'indicateur ZigZag Optimized L'indicateur ZigZag Optimized , développé par MetaQuotes Ltd. et mis à jour en version 2.00, est un outil puissant d'analyse technique sur la plateforme MetaTrader 5. Conçu pour identifier les points de retournement significatifs en reliant les pics et les creux, il offre une précision accrue aux traders. Avantages clés Support précis des divergences : Aide à déterminer des zones de prix raisonnables, assurant une compatibilité élevée avec les algorit
FREE
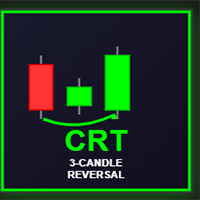
CRT Bomb Indicator - MT5 Full Version The CRT Bomb is a professional trading indicator that detects high-probability 3-candle reversal patterns (CRT - Candle Reversal Technique) across all timeframes and symbols. VPS is recomended so that you dont miss any CRT setups as they form , for entries you can use your manual analysis for confirmation like FVG, OBS etc Works on all Pairs ,Metals & Indices Key Features: Identifies impulse-trap-reversal candle structures Provides visual arrows and patter
The Ultimate Dashboard New Year Sale - save $20 (normal price $79) Indicators are useful for traders, but when you put them into a dashboard that can scan 28 symbols at once they become even better, and when you can also combine different indicators and timeframes to give you synchronized alerts, then they become awesome. This easy to use dashboard provides you with 32 leading indicators, use them individually or together, to create powerful combination alerts. So when you want to know that RS

Time your Entry and Exits with Average True Range (ATR) Trailing Stops ATR Trailing Stops are primarily used to protect capital and lock in profits on individual trades but they can also be used, in conjunction with a trend filter, to signal entries. The indicator will help make your calculation of stop loss easier as it will be visually aiding you in choosing where to put your stoploss level on the chart by calculating the current value of ATR indicator. For those who are unfamiliar with ATR, i
FREE

# Indicador Daily High - Danilo Monteiro - MT5
## Descrição O Daily High/Low Labels é um indicador personalizado para MetaTrader 5 que exibe automaticamente as máximas e mínimas diárias no gráfico, facilitando a identificação rápida dos níveis importantes de preço. O indicador marca os preços com etiquetas e linhas horizontais, permitindo uma visualização clara dos níveis críticos do dia atual e anterior.
## Principais Características
### 1. Marcação Automática - Exibe automaticamente as máxi
FREE

This indicator combines TRIX (Triple Exponential Moving Average) with a Moving Average, which can be simple, exponential, smoothed or weighted.
This combination is very useful to identify the main trend and when it is changing to a new direction.
The indicator also has signals on the chart that indicates the TRIX crossing with the Moving Average, as well as pop-up alerts and push (in the MT5 app).
Enjoy it!
FREE

Indicateur Aroon - Explication Complète Indicateur Aroon — Définition et Utilité L’indicateur Aroon est un outil d’analyse technique conçu pour identifier la force d’une tendance, son début et son éventuel affaiblissement. Il est composé de deux courbes : Aroon Up et Aroon Down . Ces lignes mesurent le temps écoulé depuis le dernier plus haut ou plus bas, permettant d’analyser précisément l’élan du marché. Lorsque Aroon Up reste proche de 100 et Aroon Down reste faible, le marché est généralemen
FREE

VOLUMIZED ORDER BLOCKS [Riz] - MT5 Indicator Smart Money Order Block Detection with Volume Analysis
Volumized Order Blocks is an advanced Smart Money Concepts (SMC) indicator that automatically detects institutional order blocks with integrated volume analysis. It identifies high-probability supply and demand zones where banks and institutions
FREE

Recevez des alertes lorsqu'une tendance éclate. Cet indicateur signale lorsque le prix effectue un mouvement important dans le sens de la tendance dominante. Ces signaux peuvent servir de points d'entrée, ou de points à ajouter à une position existante dans une tendance.
Remarque: Le suivi de tendance a un faible taux de victoire (moins de 50%), mais le rendement de la transaction gagnante moyenne est généralement 3 à 5 fois plus important que la transaction perdante moyenne.
Configuration S
FREE

This indicator draw a line on high and low levels of X number of days. It is possible to have an alert (in the software and mobile app) for when the price breaks the high or low of the current day. Configurações: Days - past days to calculate (1 = actual day only).
Alert when reach levels - activate the alert for specific levels or both.
Push notification - enable the alert to the mobile MT5 app.
Appearance
High - high level color.
Low - low level color.
Size actual day - thickness
FREE

This indicator is very useful for day traders or short term traders. (MT5 version) No need to calculate the number of pips manually, just look at the chart and you will see the Virtual Take Profit / Virtual Stop Loss target line and evaluate whether the entry point is feasible to reach the intended target or not.
Enter the intended Take Profit / Stop Loss pips for your trade. The indicator will display Virtual Take Profit / Virtual Stop Loss lines for you to easily see if the target is
FREE

If you like to use traditional Moving Averages (like SMAs and EMAs) to provide your trades for dynamic levels of Support and Resistance, you will love the Adaptive Moving Average (AMA). Created in 1995 by Perry Kaufman and presented to the world in his book " Smarter Trading : Improving Performance in Changing Markets ", the Adaptive Moving Average (also known as KAMA - Kaufman Adaptive Moving Average) has the goal to be the perfect companion for following a trend without noise, but s
FREE

DESCRIPTION:
-----------
KS Dynamic Trendlines is an advanced indicator that automatically detects swing points
and draws intelligent trendlines that adapt to market conditions in real-time.
KEY FEATURES:
------------
Automatic swing high/low detection
Dynamic trendline generation connecting swing points
Real-time break detection - broken trendlines disappear automatically
Next strongest trendline appears when current one breaks
Multi-timeframe support - detect on H4, display on M15
Parallel t
FREE
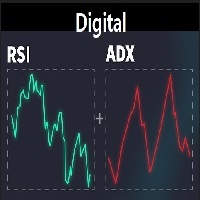
A lightweight digital indicator that combines the most important momentum tools directly on the chart. It displays real-time values of RSI, ADX, +DI, −DI, and DI Spread in a clean and compact format, without drawing any lines or graphical objects on the chart. Designed to provide fast insight into trend strength and the balance between buyers and sellers, without the need to open additional indicator windows. Fully customizable—font, size, and screen position can be adjusted easily.
FREE

This Mt5 Indicator Signals when there is two opposite direction bars engulfed by current bar. has a recent Exponential Moving Average Cross and past bar was oversold/bought Expert Advisor Available in Comments Free Version Here : https://www.mql5.com/en/market/product/110114?source=Site  ; Full Alerts for mt5 terminal , phone , email, print to file, print to journal Buy Signal ( blue line ) Past ema cross ( set at 30 bars back ) Past bar rsi is oversold ( level 40 ) Engulfing bar closes
FREE

The Range Filter Buy and Sell indicator is a trend-following technical analysis tool designed to identify optimal entry and exit points in the market. It filters out market noise by creating dynamic bands around price movements, generating clear buy and sell signals when price breaks through these bands. Key Features Dynamic Range Filtering : Uses a sophisticated algorithm to calculate adaptive bands that adjust to market volatility Trend Identification : Clearly visualizes the current trend dir
FREE

Cet outil puissant identifie automatiquement les lignes de tendance, vous aidant à rationaliser votre stratégie de trading et à prendre des décisions plus éclairées. Version MT4
Fonctionnalités clés Détection automatique des lignes de tendance : L'indicateur "Basic Trendline" scanne le marché des lignes de tendance potentielles et les affiche instantanément sur votre graphique.Cela vous fait gagner un temps précieux et vous assure de ne jamais manquer une tendance importante. Panneau convivia
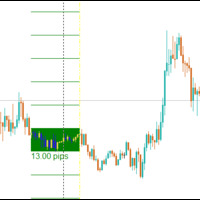
The Central Bank Dealers Range (CBDR) is a key ICT concept, used to project potential highs and lows for the day based on market conditions during a specific time window. The CBDR is utilized to forecast price movements in both bullish and bearish market conditions. By identifying this range, traders can better anticipate the price levels that may form as the day progresses.
CBDR and Standard Deviation A key feature of the CBDR is its application of standard deviation , a statistical measure u
FREE

This comprehensive technical indicator calculates and plots up to 3 moving averages with 3 different periods. By employing three moving averages of distinct lookback periods, the trader can confirm whether the market has indeed experienced a change in trend or whether it is merely pausing momentarily before resuming its prior state. SX Golden MA Pack for MT4 is available here . The shorter the moving average period, the more closely it tracks the price curve. When a security initiates an upt
FREE

This indicator is a simple tool to spot a possible trend.
When the ribbon below the price bars, It will turn to Green color and the trend is seen to be bullish When the ribbon above the price bars, it will turn to Red color and the trend is seen to be bearish. It can be used a either Entry Signal Exit Signal or trailing stop, so it is very versatile. By default color : Green is UP trend and Red is Down trend and this work perfect with Bar4Colors.ex5
FREE

GEN Sessions Volume Profile Developer: Gede Egi GEN Sessions Volume Profile is an MT5 indicator designed to display the volume distribution for each trading session (daily) in the form of a Volume Profile . With this tool, traders can easily see at which price levels the highest trading activity has occurred during a session, making it easier to identify key market areas. The indicator automatically plots Session Boxes, Point of Control (POC), Value Area High (VAH), Value Area Low (VAL), and Va
FREE

Using the Stochastic Oscillator with a Moving Average is a simple but very efficient strategy to predict a trend reversal or continuation.
The indicator automatically merges both indicators into one. It also gives you visual and sound alerts.
It is ready to be used with our programmable EA, Sandbox, which you can find below: Our programmable EA: https://www.mql5.com/en/market/product/76714 Enjoy the indicator!
This is a free indicator, but it took hours to develop. If you want to pay me a coff
FREE

The idea of a Value Chart indicator was presented in the very good book I read back in 2020 , " Dynamic Trading Indicators: Winning with Value Charts and Price Action Profile ", from the authors Mark Helweg and David Stendahl. The idea is simple and the result is pure genius: Present candlestick Price analysis in a detrended way!
HOW TO READ THIS INDICATOR
Look for Overbought and Oversold levels. Of course, you will need to test the settings a lot to find the "correct" one for your approach. It
FREE

Overview: The US Dollar Index (DXY) is a key financial indicator that measures the strength of the US Dollar against a basket of six major world currencies. This index is crucial for traders and investors as it provides a comprehensive view of the overall market sentiment towards the US Dollar and its relative performance. All Products | Contact Composition: The DXY's composition is as follows: Euro (EUR): 57.6% Japanese Yen (JPY): 13.6% British Pound (GBP): 11.9% Canadian Dollar (CAD): 9.1%
FREE

Master the market: harness the power of statistical arbitrage
This indicator showcases the price action of multiple instruments on a single chart, enabling you to compare the fluctuations of different assets and seamlessly implement statistical arbitrage strategies. Its main usage is to find correlated symbols which are temporarily out of whack.
[ Installation Guide | Update Guide | Troubleshooting | FAQ | All Products ] Find overbought or oversold currency pairs easily Plot up to six currency
FREE
OmniSignal Navigator – Scalping intelligent aux niveaux clés Tradez comme un professionnel avec cet indicateur quotidien/hebdomadaire High-Low-Close, conçu pour le scalping et le trading de cassures de précision.
Pourquoi ça marche ? Idéal pour le scalping : cible les zones clés (PDH/PDL/PDC et PWH/PWL/PWC) sur les unités de temps M2, M3, M5 et M15. (Unités de temps courtes = plus de signaux, unités de temps longues = moins de signaux) Aucune analyse graphique nécessaire : attendez s
FREE

Identify key turning points with reliable fractal analysis
This indicator examines the price structure of fractals of different periods to determine possible reversal points in the market, providing timing to positional traders that already have a fundamental or technical valuation model. Unlike its younger brother, Reversal Fractals , this indicator won't miss reversals because of the period selected, and will find reversal fractals on a zig-zag fashion, ignoring those reversals which do not

Im Sorry Ai Signal v1.26 – Precision Gold Scalping for MT5 Elevate your trading with Im Sorry Ai Signal , the latest technical indicator from the WinWiFi Robot Series . Specifically engineered for Gold (XAUUSD) scalpers on the MetaTrader 5 platform, this tool simplifies complex market movements into clear, actionable visual signals. Designed with a focus on Price Action within the M5 (5-Minute) timeframe , this indicator helps traders identify high-probability entry points in the fast-paced gol
FREE

Bienvenue sur RSI Colored Candles, un indicateur innovant conçu pour améliorer votre expérience de trading en intégrant l'indice de force relative (RSI) directement dans votre graphique de prix ! Contrairement aux indicateurs RSI traditionnels, RSI Colored Candles utilise un schéma de quatre couleurs pour représenter les niveaux de RSI directement sur vos bougies, vous offrant ainsi des aperçus précieux en un coup d'œil ! Caractéristiques et avantages : Conception Économisant de l'Espace : Adieu
FREE

This is the famous Sunflower indicator for Metatrader5. This indicator marks possible tops and bottoms on price charts. The indicator identifies tops and bottoms in the asset's price history, keep in mind that the current sunflower of the last candle repaints, as it is not possible to identify a top until the market reverses and it is also not possible to identify a bottom without the market stop falling and start rising. If you are looking for a professional programmer for Metatrader5, please
FREE

The Advanced Support and Resistance Indicator for MetaTrader 5 leverages sophisticated pivot point detection algorithms to autonomously identify and visualize critical price levels on the chart. Utilizing a configurable pivot period (default: 20 bars) and data source (High/Low or Open/Close), it intelligently scans historical price action within a user-defined loopback window (default: 290 bars) to pinpoint pivot highs and lows with strict validation criteria for enhanced precision. Pivots are d
FREE
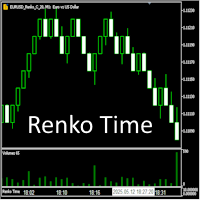
Индикатор предназначен для работы с ренко-графиками, построенными Renko Maker PRO или Renko Maker DEMO . Особенность реализации ренко-баров в терминале MetaTrader 5 такова, что из-за их вневременной природы (формирование новых баров зависит исключительно от изменения цены, а не от временных интервалов), время открытия каждого ренко-бара в истории оказывается искусственно сдвинутым в прошлое. Поэтому, чтобы видеть время открытия ренко баров, нужно воспользоваться этим индикатором Renko Time.
FREE

G-Labs Market Maker Dashboard - Exclusive Seasonal Offer Elevate your trading with the original G-Labs Market Maker Dashboard, available for a limited time at just $70 USD. Ideal for starter traders, this dashboard has been enhanced with new features and now includes a comprehensive training video. This indicator is for people trading the market makers method and is the entry level dashboard for that strategy is available for both mt4 and mt5. its a market scanner in real time showing peak forma

Candle Number Indicator for MetaTrader 5 The Candle Number Indicator displays a numeric label on each candlestick, starting from the most recent bar. This tool assists traders in visually tracking candle progression, which may support strategies based on time, structure, or pattern identification.
Features: Numbers each candle from the current bar backward Allows custom color, horizontal or vertical text orientation, and label offset Option to limit display to recent candles (e.g., last 10 bar
FREE
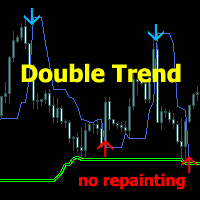
Trading System Double Trend MT5 - système de trading indépendant composé de plusieurs indicateurs. Détermine la direction de la tendance générale et donne des signaux dans la direction du mouvement des prix.
Peut être utilisé pour le scalping, le trading intrajournalier ou intrasemaine.
Possibilités
Fonctionne sur toutes les périodes et instruments de trading (Forex, crypto-monnaies, métaux, actions, indices.) Lecture visuelle simple des informations sans charger de graphique L'indicateur ne

SAR Colored Indicator with Alarm – Enhance Your Trading Strategy Are you tired of constantly monitoring charts for trend reversals? Introducing the SAR Colored Indicator with Alarm – a powerful, user-friendly tool designed to transform the classic Parabolic SAR (Stop and Reverse) into a dynamic, visually intuitive, and alert-driven system. Perfect for traders of all levels, this indicator is now available in the MQL Market and ready to elevate your trading experience. What is the SAR Colored I
FREE

ICT Unicorn Killer — Complete Liquidity Reversal Detector IMPORTANT: Use in combination with the Multi-Time-Frame 'Unicorn Hunter' (scanner) for a complete detect and kill system. https://www.mql5.com/en/market/product/153999
Unicorn Killer identifies high-probability smart-money reversal setups by combining five key technical confluences into one streamlined visual tool: Fractals → Liquidity Sweep → Break of Structure → Breaker Block → Fair Value Gap → VALID UNICORN! When a Valid Unicorn
FREE
BRAIN Indicator – Smart Buy & Sell Signal Tool (MT5) BRAIN Indicator is a powerful signal generator designed to detect high-probability trade setups based on smart combinations of momentum and price behavior. Built for precision, it displays clear BUY/SELL arrows directly on your chart — no repaint, no confusion. Fully compatible with Volatility Indices (e.g., V75), Forex, Crypto, and more.
Fast. Focused. Built to trade smart — like a brain.
Key Features: Clean signal
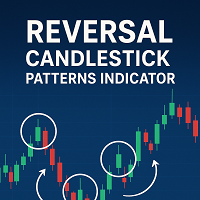
Reversal Candlestick Patterns Indicator — Free Version This MT5 indicator identifies common bullish and bearish candlestick reversal patterns and displays them directly on the chart.
It can be used on any market and timeframe, providing traders with clear visual references for potential reversal points. Main Features Automatic detection of well-known candlestick reversal patterns Works on all available MT5 timeframes Can be applied to Forex, Stocks, Commodities, Indices, and Cryptocurrency char
FREE

Trend Dashboard / Trend Scanner – Smart Multi-Timeframe Tool Our Trend Dashboard is an advanced tool for trend analysis that allows you to monitor multiple symbols and timeframes in one place. It displays the current trend direction on popular intervals such as M1, M5, M15, M30, H1, H4, and D1, enabling traders to quickly assess market conditions without manually checking multiple charts. Features: Trend indicators for multiple timeframes in a single dashboard Color-coded trend display: bullish,
FREE

Indicateur de Sessions de Trading L'Indicateur de Sessions de Trading visualise les points hauts et bas ainsi que les heures de début et de fin des sessions de trading asiatique, de Londres et de New York directement sur votre graphique. Fonctionnalités : Visualisation des principales sessions de trading Mise en évidence des points hauts et bas Affichage des heures de début et de fin de chaque session Heures des sessions personnalisables Facile à utiliser et efficace Personnalisabilité : Chaque
FREE
Shaolin Trend Follow v2.1
Optimisé pour EURUSD sur MetaTrader 5 Un indicateur léger, dédié uniquement aux signaux, suivant une méthodologie top-down : il confirme d’abord la tendance principale sur H4, puis attend des déclencheurs d’entrée ajustés à la volatilité sur M15. Pas d’ordres automatiques ni de gestion de l’argent — simplement des repères clairs / lorsque les conditions sont réunies, pour que vous puissiez agir à votre convenance. Confirmation de la tendance H4 Parabolic SAR + filtr
FREE

Engulfing Candle Detector
Detectable pattern Double Candlestick Patterns Bullish Engulfing
The first candle is black candle. The second candle opens with a gap below the real body of the black candle but rallies upwards to close above the real body of the black candle. In other words, the second candle's real body completely engulfs the first candle's real body Bearish Engulfing
The first candle is white candle. The second candle opens with a gap above the real body of the white candle but dec
FREE
If you love this indicator, please leave a positive rating and comment, it will be a source of motivation to help me create more products <3 Key Takeaways VWAP is a trading benchmark that typically is most useful to short-term traders. VWAP is used in different ways by traders . Traders may use it as a trend confirmation tool and build trading rules around it. Also, If prices below VWAP and move above it, c an be used by traders as a sell signal. If prices above VWAP and move below it, ca
FREE

BUY INDICATOR AND GET EA FOR FREE AS A BONUS + SOME OTHER GIFTS! ITALO TREND INDICATOR is the best trend indicator on the market, the Indicator works on all time-frames and assets, indicator built after 7 years of experience on forex and many other markets. You know many trend indicators around the internet are not complete, does not help, and it's difficult to trade, but the Italo Trend Indicator is different , the Italo Trend Indicator shows the signal to buy or sell, to confirm the signal t
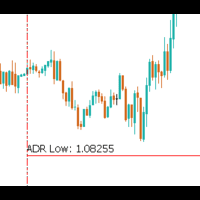
The Average Daily Range (ADR) is a powerful tool for traders, especially those focused on intraday and scalping strategies. It provides valuable insights into the expected price movement for the day and how price action is behaving relative to historical trends. The ADR indicator shows the following key information: Today's ADR : The typical range of price movement for the current trading day, based on historical data. 3x Today's ADR : Three times the current ADR, showing potential price moveme
FREE

BUY INDICATOR AND GET EA FOR FREE AS A BONUS + SOME OTHER GIFTS! ITALO VOLUME INDICATOR is the best volume indicator ever created, and why is that? The Indicator works on all time-frames and assets, indicator built after 7 years of experience on forex and many other markets. You know many volume indicators around the internet are not complete, does not help, and it's difficult to trade, but the Italo Volume Indicator is different , the Italo Volume Indicator shows the wave volume, when market

En sécurité informatique, une attaque par force brute consiste en une méthode systématique d'essais et d'erreurs pour découvrir des mots de passe, des identifiants de connexion ou des clés cryptographiques. Inspirés par cette approche, nous avons développé Brute Force Trend, un outil d'analyse de marché utilisant des algorithmes pour identifier les tendances et les points de retournement.
Principales fonctionnalités :
Plusieurs méthodes de calcul : Neuf méthodes différentes de traitement du p
FREE

Volume Pressure Meter Analyzes tick volume flow to show buying and selling pressure with multi-timeframe confirmation. Overview This indicator displays a histogram with gradient colors representing pressure intensity. A trend bias label indicates dominant pressure direction with percentage display for pressure breakdown. A visual gauge bar shows buy/sell pressure ratio at a glance. The indicator includes multi-timeframe analysis capability with popup alerts. Color schemes and display settings ar
FREE

About:
The Nadaraya-Watson Envelope is a sophisticated yet practical technical indicator that helps traders identify overbought and oversold conditions using advanced kernel regression methods. This is the MT5 only Version.
For MT4 Version go here: https://www.mql5.com/en/market/product/158640/
Key Features ATR-Based Bands: Three upper and three lower bands provide graduated overbought/oversold zones Logarithmic Scale Calculation Center Line - bullish (teal) or bearish (red)
What is the Nad
FREE

Simple ATR (Average True Range) Channel to find your Stop Loss and/or Take Profit. Indicator allows to draw a second multiplier if you need different values for SL and TP. Leave the second multiplier to 0 if not used.
Settings + Length
+ Smoothing
+ Multiplier #1 (default 1.5)
+ Multiplier #2 (set to 0 if not used)
+ High price
+ Low price
+ show price line
+ colors can be changed
Please leave wishes in the comments. Reviews are also welcome.
FREE

Fractal Model Indicator for Metatrader , meticulously crafted around the renowned Fractal Model by TTrades. This powerful tool empowers traders to navigate price action with precision, leveraging multi-timeframe analysis to anticipate momentum shifts, swing formations, and trend continuations. Designed for MetaTrader , the Fractal Model Indicator combines advanced algorithmic insights with customizable features, making it an essential addition for traders seeking to capitalize on expansive mar
MetaTrader Market - les robots de trading et les indicateurs techniques pour les traders sont disponibles directement dans votre terminal de trading.
Le système de paiement MQL5.community est disponible pour tous les utilisateurs enregistrés du site MQL5.com pour les transactions sur les Services MetaTrader. Vous pouvez déposer et retirer de l'argent en utilisant WebMoney, PayPal ou une carte bancaire.
Vous manquez des opportunités de trading :
- Applications de trading gratuites
- Plus de 8 000 signaux à copier
- Actualités économiques pour explorer les marchés financiers
Inscription
Se connecter
Si vous n'avez pas de compte, veuillez vous inscrire
Autorisez l'utilisation de cookies pour vous connecter au site Web MQL5.com.
Veuillez activer les paramètres nécessaires dans votre navigateur, sinon vous ne pourrez pas vous connecter.