TrendBite MT5
- 指标
- 版本: 1.50

TrendBite v1.5 - 专业趋势跟踪指标
开发者:8aLt4
版本:1.5
平台:MetaTrader 5
概述
TrendBite v1.5是一款先进的技分析指标,旨在识别市场趋势变化并为投资者提供清晰的买卖信号。该工具基于布林带算法,能精准捕捉趋势反转点,既适合新手交易者,也适用于经验丰富的交易者。
核心功能
趋势识别
自动趋势分析:实时捕捉市场上升与下降趋势
基于布林带:采用可靠数学模型构建的计算系统
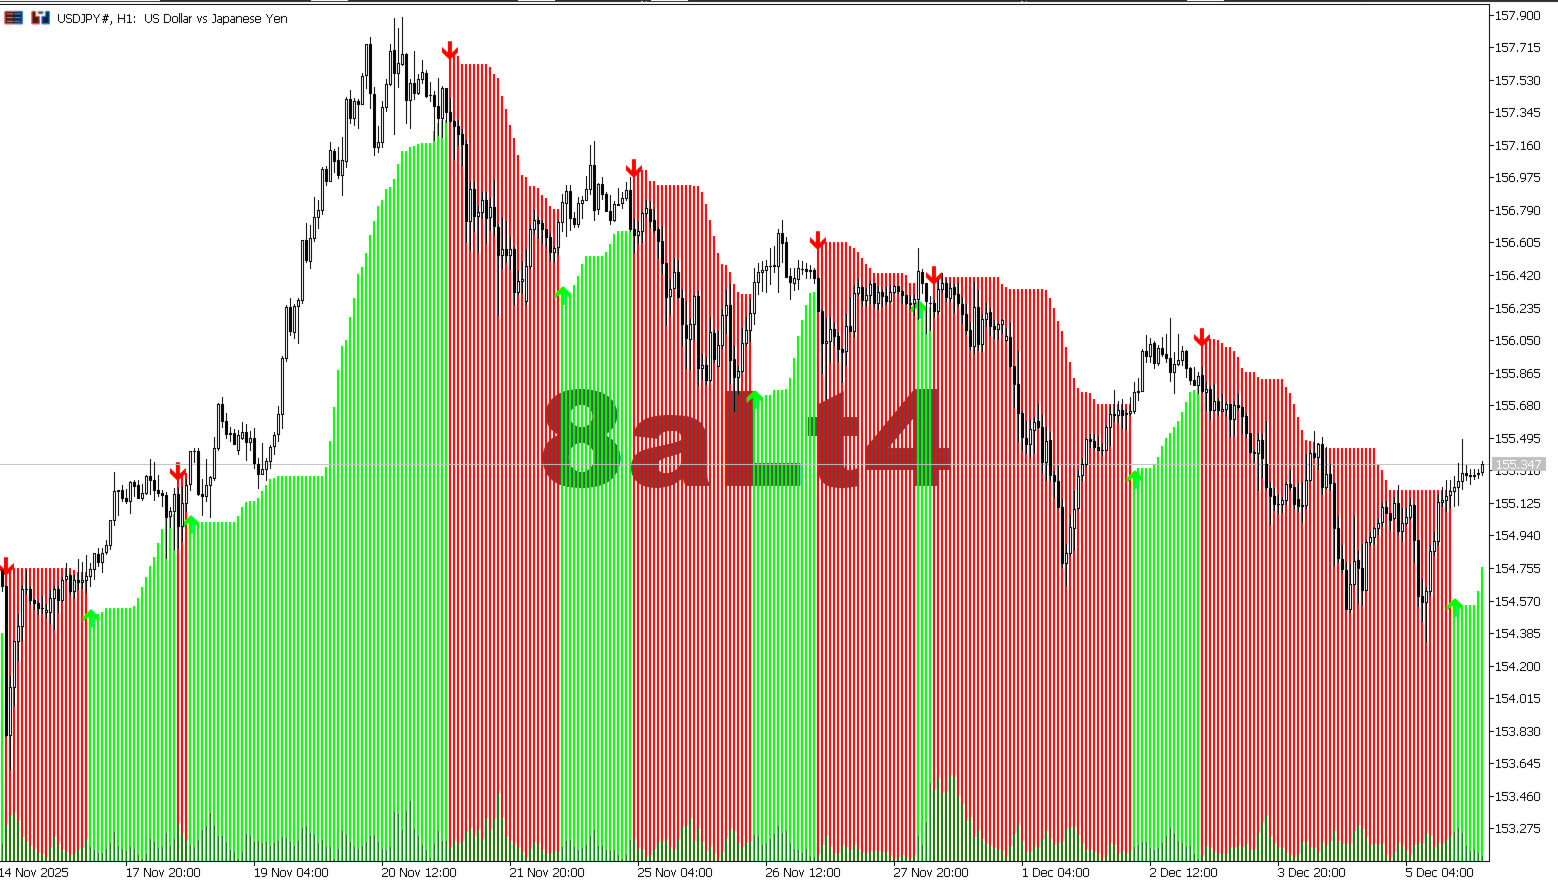
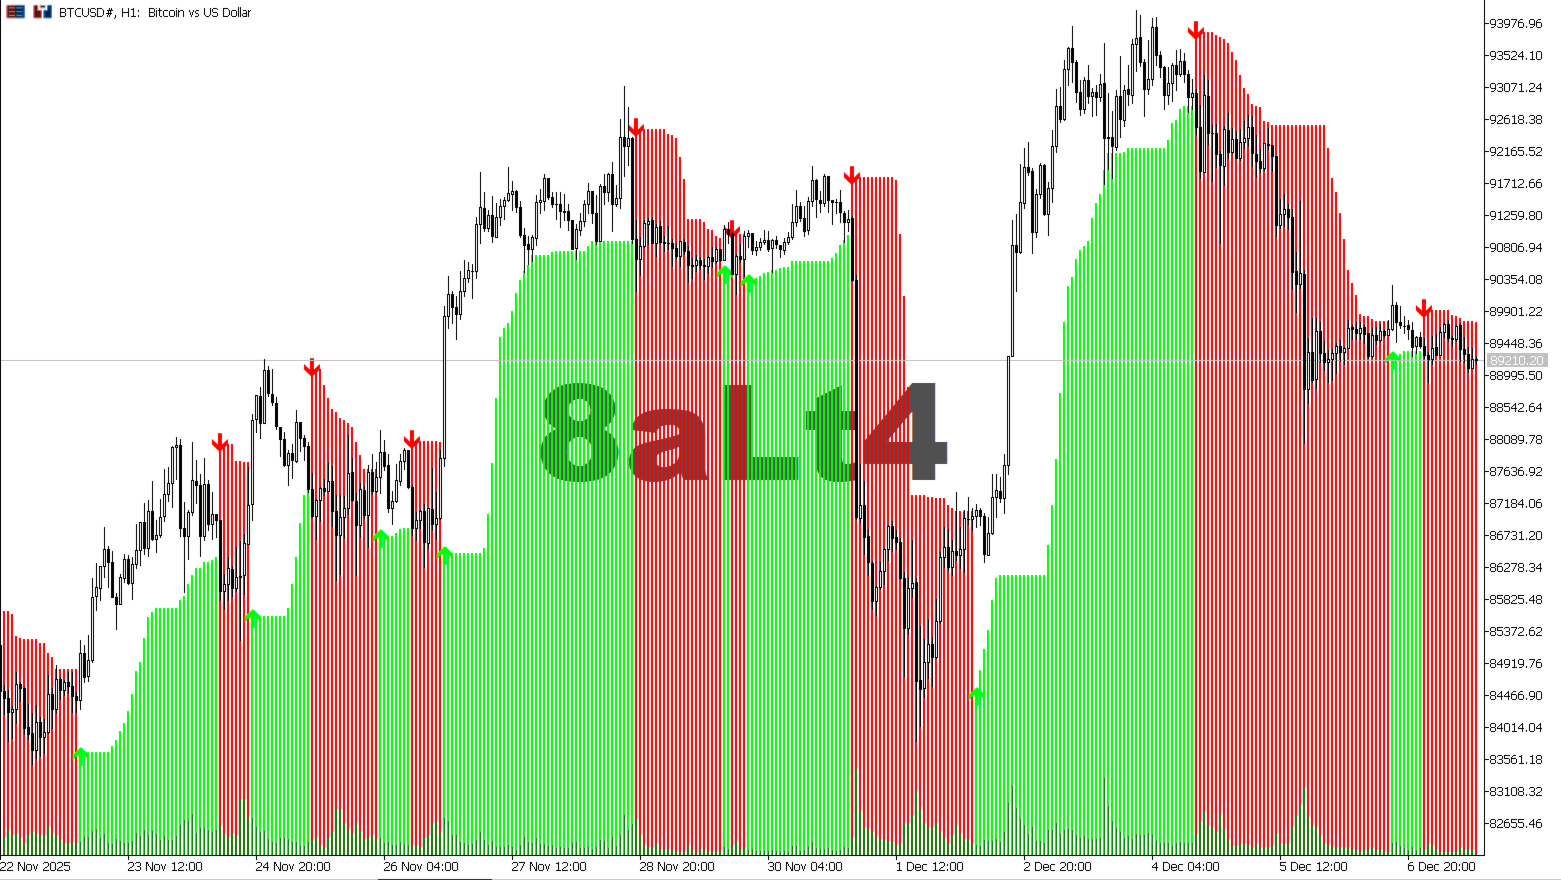
视觉清晰度:通过绿色(上升)和黄色(下降)柱状图直观展示趋势状态
买卖信号
绿色箭头(↑):提示买入机会
红色箭头(↓):提示卖出机会
清晰可视化:趋势线助您轻松追踪持仓方向
柱状图显示:直观评估趋势强度
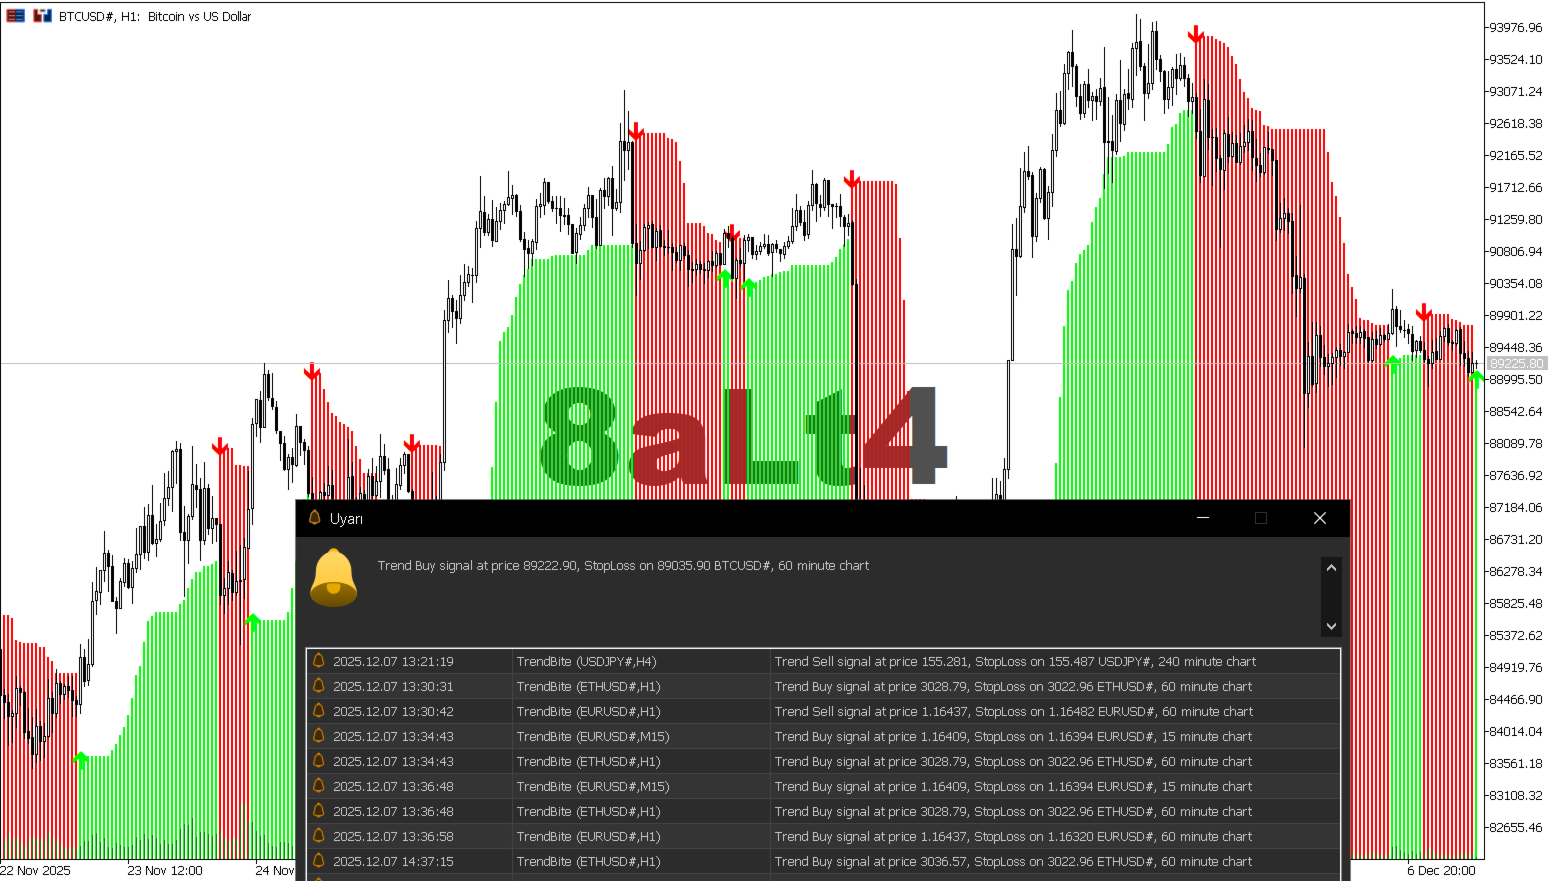
警报系统
声音提醒:新信号生成时自动通知
邮件支持:通过邮件接收关键信号
详细信息:每条警报均包含价格水平和交易建议
用户友好界面
自动关闭网格:自动关闭网格以获得更清晰的图表
可自定义ZigZag:自由开启或关闭趋势线
参数设置
SignalPeriod(默认值:15)
信号计算周期
数值越高 = 信号越少但更可靠
数值越低 = 信号更多但更敏感
ArrowPeriod(默认值:2)
箭头指示敏感度
影响布林带宽度
ShowZigZag(默认:false)
显示/隐藏趋势线
true = 显示白色趋势线
false = 仅显示箭头和柱状图
AlertON(默认:true)
开启/关闭声音提醒
收到新信号时获取通知
Email(默认:false)
开启/关闭电子邮件通知
需在MetaTrader中设置电子邮件
如何使用?
1. 买入策略
出现绿色箭头 → 买入机会
绿色柱状图上升 → 上升趋势增强
白色趋势线(ZigZag开启时)向上→趋势持续
2. 卖出策略
红色箭头出现时→卖出机会
红色柱状图上升时→下跌趋势增强
白色趋势线(ZigZag开启时)向下倾斜 → 趋势持续
3. 风险管理
始终使用止损
用其他指标确认信号
高波动时期保持谨慎
风险回报比保持在1:2或更高
使用技巧
最佳时间周期:针对H1、H4和日线图优化
适用市场:可用于外汇、加密货币、股票及大宗商品市场
模拟账户:实盘交易前请在模拟账户测试
回测功能:通过历史数据验证性能
重要提示
本指标无法保证100%准确性
并非所有信号都能带来盈利,亏损属正常现象
风险管理应始终优先考虑
需关注市场新闻与经济数据
结合自身交易策略使用
优势
轻松安装与操作
简洁专业的界面
实时信号生成
灵活的参数设置
低系统资源占用
兼容所有MetaTrader 5经纪商