Auto Fibonacci

5

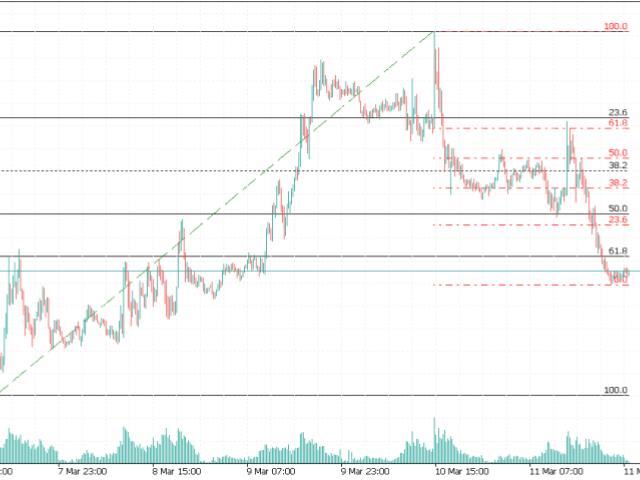
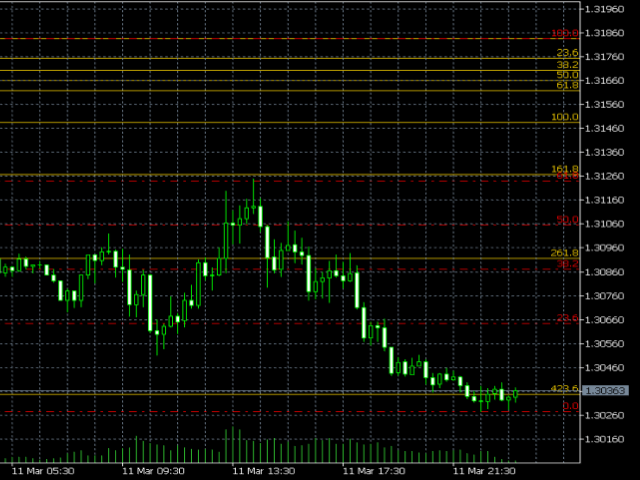
This indicator calculates fibonacci levels via moving averages trend and draw these lines. You can change fast and slow Moving Averages settings for customization.
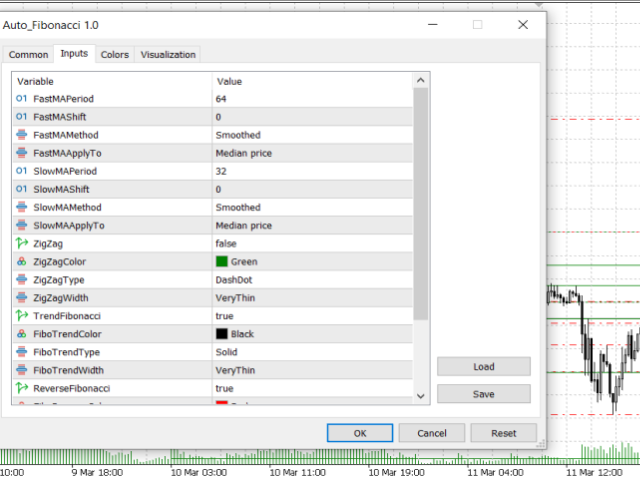
Inputs:

  • Fast MA Time Period :  64
  • Fast MA Shift: 0
  • Fast MA Method: Smoothed
  • Fast MA Apply To: Median Price
  • Slow MA Time Period: 32
  • Slow MA Shift: 0
  • Slow MA Method: Smoothed
  • Slow MA Apply To: Median Price
  • ZigZag: False
  • ZigZag Color: Red
  • ZigZag Type: DashDot
  • ZigZag Width: VeryThin
Fibo Settings
  • TrendFibonacci: True
  • FiboTrendColor: Black
  • FiboTrendType: Solid
  • FiboTrendWidth: VeryThin
  • ReverseFibonacci: True
  • FiboReverseColor: Red
  • FiboReverseType: Solid
  • FiboReverseWidth: VeryThin
  • FiboRayLeft: false
  • FiboRayRight: false


评分 3
Douglas R.
20
Douglas R. 2025.02.06 18:39 
 

i can see mql5 for personalize in portuguese?

Natascha Jeske
181
Natascha Jeske 2024.05.06 04:31 
 

Excellent indicator. I've been looking for a long time. Would it be possible to adjust the font size? It's a little too small.

alan5000
28
alan5000 2022.03.24 23:51 
 

It works really good.

推荐产品
RSI Divergence F
Andrey Dik
5 (3)
一个专业的交易工具是RSI和价格之间的背离指标,它允许您及时收到关于趋势反转的信号或捕捉价格回调走势(取决于设置)。 指标设置允许您根据RSI峰值的角度和价格的百分比变化来调整发散的强度,这使得微调信号强度成为可能。 指标代码经过优化,并作为Ea交易的一部分进行了非常快速的测试。  指标不重绘,交易方向的箭头正好位于信号出现的位置--在柱的开口处。 Fractal True . PeriodRSI_P     = 14 ;           //Period IndentFrom50_P  = 10.0 ;         //Indent +- from 50 [0...50] LeftBars_P      = 1 ;           //LeftBars RightBars_P     = 1 ;           //RightBars IndDivForce_P   = 15.0 ;         //Divergences force of indicator (not for the Lite version) PriceDivForce_P = 0.01
FREE
Renko Chart
Marcin Konieczny
3.56 (9)
This indicator allows to display Renko charts in the indicator window. Renko charts show only price movements that are bigger than the specified box size. It helps to eliminate noise and allows to focus on main trends. Time is not a factor here. Only price movements are taken into account. That's why Renko chart is not synchronized with the main chart it is attached to. Indicator works in two modes: CLOSE - only close prices are taken into account while building the chart HIGH_LOW - only high/l
FREE
Multi-timeframe trend indicator based on the ADX / ADXWilder indicator with Fibonacci levels The indicator shows trend areas using ADX or ADXWilder indicator data from multiple timeframes. The impulse mode of the indicator allows you to catch the beginning of a trend, and several "Screens" with different timeframes allow you to filter out market noise. Fibonacci levels are added to the price chart, which have flexible settings. How the indicator works: if PDI is greater than NDI, then   it`s
FREE
Trendline mt5 indicator
David Muriithi
4 (2)
Are you tired of drawing trendlines every time you're analyzing charts? Or perhaps you would like more consistency in your technical analysis. Then this is for you. This indicator will draw trend lines automatically when dropped on a chart. How it works Works similar to standard deviation channel found on mt4 and mt5. It has 2 parameters: 1. Starting Bar 2. Number of bars for calculation The   starting bar   is the bar which drawing of the trend lines will begin, while the   number of bars for c
FREE
Follow The Line MT5
Oliver Gideon Amofa Appiah
4.6 (35)
This indicator obeys the popular maxim that: "THE TREND IS YOUR FRIEND" It paints a GREEN line for BUY and also paints a RED line for SELL. (you can change the colors). It gives alarms and alerts of all kinds. IT DOES NOT REPAINT and can be used for all currency pairs and timeframes. Yes, as easy and simple as that. Even a newbie can use it to make great and reliable trades. NB: For best results, get my other premium indicators for more powerful and reliable signals. Get them here: https://www.m
FREE
Prometheus Analyst
Humphrey Mangera
PROMETHEUS TECHNICAN VERSION Free | By THE SONS A gift from The Sons — no strings, no trial, no expiry. Every trader deserves access to professional-grade market intelligence. That belief is why Prometheus Technical Version exists, and why it costs nothing. Consider it our handshake to the trading community. What You're Getting This is not a simplified tool dressed up as a gift. Prometheus Technican Version is a fully built, institutional-quality technical analysis indicator running a dual-model
FREE
Free automatic Fibonacci is an indicator that automatically plots a Fibonacci retracement based on the number of bars you select on the BarsToScan setting in the indicator. The Fibonacci is automatically updated in real time as new highest and lowest values appears amongst the selected bars. You can select which level values to be displayed in the indicator settings. You can also select the color of the levels thus enabling the trader to be able to attach the indicator several times with differe
FREE
MACD Enhanced
Nikita Berdnikov
5 (3)
Introducing the MACD  Enhanced – an advanced MACD (Moving Average Convergence Divergence) indicator that provides traders with extended capabilities for trend and momentum analysis in financial markets. The indicator uses the difference between the fast and slow exponential moving averages to determine momentum, direction, and strength of the trend, creating clear visual signals for potential entry and exit points. Attention! To achieve the best results, it is recommended to adapt the indicator
FREE
Dual WMA Entry System
Donovan Tjin-a-tak
专业交易指标,在图表上同时显示两条加权移动平均线(WMA),并自动识别低动能及震荡市场状态,帮助交易者避免在不稳定环境中入场。 WMA1 基于开盘价计算,并带有轻微偏移,用于判断趋势方向。 WMA2 基于收盘价计算,用于确认当前动能强弱。 当两条 WMA 之间的距离缩小时,系统会自动将 K 线标记为灰色,提示市场进入震荡或整理阶段,从而减少在无趋势环境中的错误交易。 适用于外汇、指数、大宗商品等所有交易品种,以及所有时间周期。 升级至 SuperSmooth WMA Trading System Pro 专业版在相同 WMA 基础上增加完整信号系统,包括进场与出场信号、多空K线着色、高周期 EMA 趋势过滤器、MACD 动能确认、SMA 方向过滤器、实时提醒功能以及可配置周期过滤器。 仅当所有过滤条件同时满足时才生成信号,大幅降低假信号,提高交易质量与稳定性。 如果您觉得这个指标有帮助,请考虑留下评价。您的反馈可以帮助其他交易者发现这个工具。
FREE
Five Minute Drive
Kenan Ozkarakas
5 (2)
"Five Minute Drive" indicator that is designed to be used in the 5 minute timeframe only. One of its most important advantages is that it shows the general trend in the upper time frames when looking at the 5-minute timeframe. Therefore, when opening positions in the 5 minute timeframe, when it is in line with the trends in the upper timeframes, you are less likely to be upside down. If you can interpret the curvilinear and linear lines drawn by this indicator on the graphic screen with your geo
FREE
Coral Indi
Dinh Duong Luong
Coral trend is   a trend-following indicator that is widely popular among FOREX traders . It is usually used as a confluence with other indicators. It uses combinations of moving averages with complex smoothing formulas! It has two configurable parameters: Coefficient   - smoothing ratio (*) Applied price Calculation: Coral = (-0.064) * B6 + 0.672 * B5 - 2.352 * B4 + 2.744 * B3
FREE
Multi-timeframe trend indicator, based on the ADX / ADXWilder indicator The indicator shows trend areas using ADX or ADXWilder indicator data from multiple timeframes. The impulse mode of the indicator allows you to catch the beginning of a trend, and several "Screens" with different timeframes allow you to filter out market noise. How the indicator works: if PDI is greater than NDI, then it`s bullish movement; if PDI is less than NDI, then it`s bearish movement; to determine any trend, it is
FREE
LongTerm
Edoardo Centorame
LongTerm —— 中长期趋势方向分析指标 LongTerm 是一款用于解读 中长期趋势强度与质量 的 方向性分析指标 ,其设计重点明确聚焦于 多头(Long)趋势分析 。 它 不是 入场指标,也 不是 用于精确择时的工具,而是一种分析型指标,旨在帮助交易者理解 市场何时具备、何时不具备中长期多头趋势的有利条件 ,从而有效降低短周期波动所带来的噪音干扰。 设计目标 LongTerm 的核心目标在于: 识别 强劲且结构清晰的多头趋势 区分趋势的 扩张、放缓与衰竭阶段 提供对 主导方向性市场环境 的清晰解读 它是专为 波段交易(Swing Trading) 和 中长期趋势分析 而设计的理想工具。 颜色解读与市场状态 LongTerm 采用精心设计的颜色结构,使不同多头趋势阶段的识别更加直观,清晰区分市场中 最佳与最差的趋势环境 。 绿色线(正向倾斜并位于蓝线之上) 该状态代表 最理想的市场条件 。 多头趋势强劲、稳定且结构良好 价格运动具备连续性和明确方向 市场处于趋势扩张阶段 这是进行 中长期多头分析 的最佳环境。 / 黄色或橙色线(位于蓝线之上) 表示
FREE
Donchian Breakout And Rsi
Mattia Impicciatore
5 (1)
概述 本指标是经典 Donchian 通道 的增强版,增加了多种实用的交易功能。 除了标准的三条线(最高、最低和中线),系统能够检测 突破 ,并在图表上用箭头进行可视化标记,同时只显示 与当前趋势方向相反的那条线 ,让图表更加简洁。 功能包括: 可视化信号 :突破时在图表上绘制彩色箭头 自动通知 :弹窗、Push 推送和 Email 邮件 RSI 过滤 :根据市场相对强弱验证信号 个性化设置 :颜色、线条粗细、箭头符号、RSI 阈值等 工作原理 Donchian 通道计算: 上轨线 :最近 N 根已收盘 K 线的最高价 下轨线 :最近 N 根已收盘 K 线的最低价 中线 :最高价和最低价的平均值 看涨突破 :收盘价高于上轨线 看跌突破 :收盘价低于下轨线 指标会: 绘制三条 Donchian 通道线 仅在 方向变化后的首次突破 绘制箭头 隐藏顺应趋势方向的那条线(上涨趋势: 只显示红色下轨线;下跌趋势: 只显示绿色上轨线) 可选用 RSI 过滤突破信号,减少虚假突破 支持实时发送通知 参数说明 Donchian 通道设置 indPeriod :计算通道高低点的已收盘 K 线数量 Lin
FREE
FX Clock
Abderrahmane Benali
FXClock – Professional Clock Indicator for Traders Please leave a 5 star rating if you like this free tool! Thank you so much :) The FXClock indicator is a practical and simple tool that displays time directly on your trading platform, allowing you to track multiple key pieces of information at the same time. It is specially designed to help traders synchronize their trading with market hours and global sessions. Key Features: Displays the broker server time with precision. Displays your local c
FREE
该指标是一种分析工具,结合了由 Patrick Mulloy、Mark Jurik、Chris Satchwell、Alan Hull 等作者开发的 37 种不同的移动平均线变体。它提供了历史虚拟测试的能力。 该指标可用于各种工具,包括黄金、加密货币、股票指数、货币对和其他资产。 集成的可视化回测器允许用户模拟虚拟交易头寸、跟踪结果并直观地评估每个移动平均线变化的有效性。这有助于交易者快速识别市场状况。 该工具还包括“最大可能利润”功能(理想退出点),说明在最有利可图的点关闭每个头寸时的假设交易结果。 此外,还提供虚拟止损功能,可在视觉测试期间进行风险管理和控制潜在损失。这有助于交易者在现实条件下评估他们的策略。 此工具对于旨在优化交易策略的经验丰富的交易者以及希望深入了解移动平均线如何影响交易绩效的初学者都很有价值。 设置说明: 显示最大利润 :在图表上显示一条曲线,表示考虑止损后的潜在最大利润。 显示最小利润 :在图表上显示一条代表最小利润情景的曲线,模拟持有头寸直到趋势逆转。 最大利润的虚拟止损点数 :定义虚拟止损点数的大小。 分析中的条形图数量 :指定分析中包含多少条形图。例如
FREE
TrendBite MT5
Burak Baltaci
TrendBite v1.5 - 专业趋势跟踪指标 开发者:8aLt4 版本:1.5 平台:MetaTrader 5  概述 TrendBite v1.5是一款先进的技分析指标,旨在识别市场趋势变化并为投资者提供清晰的买卖信号。该工具基于布林带算法,能精准捕捉趋势反转点,既适合新手交易者,也适用于经验丰富的交易者。  核心功能  趋势识别 自动趋势分析:实时捕捉市场上升与下降趋势 基于布林带:采用可靠数学模型构建的计算系统 视觉清晰度:通过绿色(上升)和黄色(下降)柱状图直观展示趋势状态  买卖信号 绿色箭头(↑):提示买入机会 红色箭头(↓):提示卖出机会 清晰可视化:趋势线助您轻松追踪持仓方向 柱状图显示:直观评估趋势强度  警报系统 声音提醒:新信号生成时自动通知 邮件支持:通过邮件接收关键信号 详细信息:每条警报均包含价格水平和交易建议  用户友好界面 自动关闭网格:自动关闭网格以获得更清晰的图表 可自定义ZigZag:自由开启或关闭趋势线  参数设置 SignalPeriod(默认值:15) 信号计算周期 数值越高 = 信号越少但更可靠 数值越低 = 信号更多但更敏感
FREE
Indicator and Expert Adviser  EA Available in the comments section of this product. Download with Indicator must have indicator installed for EA to work. Mt5 indicator alerts for bollinger band and envelope extremes occurring at the same time. Buy signal alerts occur when A bullish candle has formed below both the lower bollinger band and the lower envelope  Bar must open and close below both these indicators. Sell signal occur when A bear bar is formed above the upper bollinger band and upper
FREE
ATR Plus
Ivan Pochta
5 (1)
ATR Plus is an enhanced version of the classic ATR that shows not just volatility itself, but the directional energy of the market . The indicator converts ATR into a normalized oscillator (0–100), allowing you to clearly see: who dominates the market — buyers or sellers when a trend begins when a trend loses strength when the market shifts into a range where volatility reaches exhaustion zones ATR Plus is perfect for momentum, trend-following, breakout and volatility-based systems. How ATR Plus
FREE
LT Agression Indicator
Thiago Duarte
5 (3)
This is a buyer and seller aggression indicator that analyzes the shape of each candle and project this data in a histogram form. There are 4 histograms in one. On the front we have two: Upper - Buyer force. Lower - Seller force. At the background we also have two histogram, both with same color. They measure the combined strenght of buyers and sellers. This histograms can be turned off in Input Parameters. It is also possible to have the real or tick volume to help on this force measurement. IN
FREE
Mitimom
Danil Poletavkin
The indicator is based on Robert Miner's methodology described in his book "High probability trading strategies" and displays signals along with momentum of 2 timeframes. A Stochastic oscillator is used as a momentum indicator. The settings speak for themselves period_1 is the current timeframe, 'current' period_2 is indicated - the senior timeframe is 4 or 5 times larger than the current one. For example, if the current one is 5 minutes, then the older one will be 20 minutes The rest of the s
FREE
Donchian Pro
Paulo Henrique Faquineli Garcia
4.75 (4)
The Donchian Channel Channels are among the most popular tools of technical analysis, as they visually convey to the analyst the limits within which most price movement tends to occur. Channel users know that valuable information can be obtained at any time, whether prices are in the central region of a band or close to one of the border lines. One of the best known techniques to explore these concepts is Bollinger Bands. However, John Bollinger was not the only one to research the application
FREE
This indicator is a zero-lag indicator and displays  strength of trend change . True Trend  Oscillator Pro works best in combination with True Trend Moving Average Pro that displays exact trend as is. Oscillator value is exact price change in given direction of the trend. True Trend Moving Average Pro: https://www.mql5.com/en/market/product/103586 If you set PERIOD input parameter to 1 this indicator becomes a sharpshooter for binary options. Developers can use True Trend Oscillator in Exper
FREE
FlatBreakout MT5
Aleksei Vorontsov
FlatBreakout MT5 (Free Version) Flat Range Detector and Breakout Panel for MT5 — GBPUSD Only FlatBreakout MT5   is the free version of the professional FlatBreakoutPro MT5 indicator, specially designed for flat (range) detection and breakout signals on the   GBPUSD   pair only. Perfect for traders who want to experience the unique fractal logic of FlatBreakout MT5 and test breakout signals on a live market without limitations. Who Is This Product For? For traders who prefer to trade breakout of
FREE
ThreePointsChannelFree
Dimitr Trifonov
5 (1)
This is a free version of the indicator, the period between the vertical lines is always 30 bars. In the paid version the period can be set by user, so a configuration with many ThreePointsChannel indicators with different periods is possible. The principle of construction - on top of any number of bars set by the user, a channel is constructed with maximum and minimum lines so that the bars touch the maximum and minimum of the channel at exactly three points. The name of the indicator follows
FREE
Pivot Points Indicator – a fast, reliable, and fully customizable pivot detection for MetaTrader 5. This indicator uses MetaTrader’s native iHighest and iLowest functions to identify pivot highs and lows by scanning for the highest and lowest prices within a user-defined window of bars. A pivot is confirmed only when the current bar is the absolute maximum or minimum within the selected range, ensuring accurate and timely signals based on robust built-in logic. Key Features No Repainting : Onc
FREE
This Mt5 Indicator Signals when there is two opposite direction bars engulfed by current bar.  has a recent Exponential Moving Average Cross and past bar was oversold/bought Expert Advisor Available in Comments  Free Version Here : https://www.mql5.com/en/market/product/110114?source=Site&nbsp ; Full Alerts for mt5 terminal , phone , email, print to file, print to journal  Buy Signal ( blue line ) Past ema cross ( set at 30 bars back ) Past bar rsi is oversold ( level 40  ) Engulfing bar closes
FREE
Super Trend eu
Emin Ulucanli
4.83 (6)
SUPERTREND; It is a trend following indicator based on the SuperTrend ATR created by Olivier Seban. It can be used to detect changes in trend direction and locate stops. When the price falls below the indicator curve, it turns red and indicates a downtrend. Conversely, when the price moves above the curve, the indicator turns green, indicating an uptrend. Like other indicators, it works well on SuperTrend when used in conjunction with other indicators such as MACD, parabolik SAR, Bollinger Band
FREE
Daily Support and Resistance Levels 是一款专业指标,基于经典枢轴点方法自动计算并显示日内交易关键价格水平。 主要功能: 自动计算枢轴点(PP) 三个阻力位(R1, R2, R3) 三个支撑位(S1, S2, S3) 显示前一天高点/低点 实时信息面板 市场趋势方向(多头/空头)提示 显示与最近价格水平的距离 完全自定义颜色与样式 每日自动更新 支持所有周期 计算方法:基于昨日最高价、最低价、收盘价的经典枢轴点算法。 交易用途: 支撑/阻力反弹交易 突破策略 区间震荡交易 市场方向判断 盈利目标设置 使用方法: 将指标加载到图表 自动生成水平线 价格 > PP = 多头倾向 价格 < PP = 空头倾向 S1-S3 = 支撑区域 R1-R3 = 阻力区域 自定义设置: 枢轴点/支撑/阻力颜色 线条宽度与样式 显示/隐藏价格标签 显示/隐藏信息面板 面板位置与字体大小 显示/隐藏前日高低点 优点: 专业界面 无重绘 资源占用低 支持所有经纪商 适合剥头皮与日内交易 免费用于展示我的MQL5能力 如果喜欢,请留下评价。
FREE
RSI abcd
Francisco Gomes Da Silva
4.33 (3)
RSI ABCD形态查找器:技术策略 1. 指标工作原理 结合 经典RSI 与自动检测 ABCD谐波形态 。 主要组件 标准RSI (可调周期) 高低点标记 (箭头) ABCD形态 (绿/红线) 超买(70)和超卖(30)过滤器 2. MT5设置 period = 14 ; // RSI周期 size = 4 ; // 最大形态尺寸 OverBought = 70 ; // 超买水平 OverSold = 30 ; // 超卖水平 Filter = USE_FILTER_ YES ; // 确认过滤器 3. 交易策略 3.1. 买入信号(看涨ABCD) 条件: RSI形成: 低点( A ) → 高点( B ) → 更高低点( C ) D 高于超卖区(30)但低于 C 确认:绿色连线A-B-C-D 目标: TP1: B-C的61.8% TP2: B-C的100% 止损: 低于 D 3.2. 卖出信号(看跌ABCD) 条件: RSI形成: 高点( A ) → 低点( B ) → 更低高点( C ) D 低于超买区(70)但高于 C 确认:红色连线A-B-C-D 目标: TP1: B-C的6
FREE
该产品的买家也购买
SuperScalp Pro
Van Minh Nguyen
4.72 (18)
SuperScalp Pro – 高级多重过滤剥头皮指标系统 SuperScalp Pro 是一款高级剥头皮指标系统,将经典 Supertrend 与多重智能确认过滤器相结合。该指标在 M1 到 H4 的所有时间框架上均运行良好,尤其适用于 XAUUSD、BTCUSD 及主要外汇货币对。可作为独立系统使用,也可灵活整合到现有交易策略中。 指标集成超过 11 个过滤器,包括快慢 EMA、用于趋势判断的三条 EMA、EMA 斜率 (EMA slope)、RSI、ADX、成交量、VWAP、布林带突破(Bollinger Bands Breakout)以及 MACD 背离过滤器。智能蜡烛过滤器用于确认蜡烛收盘并剔除弱信号,而以三条 EMA 结合 MACD 背离的趋势识别机制则有助于筛选出更高胜率的交易信号。 SuperScalp Pro 基于 ATR 自动计算进场(Entry)、止损(Stop Loss)和止盈(Take Profit)水平。所有重要价格水平均直接显示在图表上,方便用户管理风险并做出更精准的交易决策。 系统在超过 5,000 根蜡烛上进行模拟与性能分析,展示完整指标如胜率、总交
Azimuth Pro
Ottaviano De Cicco
5 (6)
上市促销 Azimuth Pro 前100位买家特惠价 299 美元。最终价格为 499 美元。 散户与机构入场的区别不在于指标,而在于位置。 大多数交易者在任意价格水平入场,追逐动量或对滞后信号做出反应。机构投资者等待价格到达供需真正转换的结构性水平。 Azimuth Pro 自动映射这些水平:波段锚定VWAP、多时间框架结构线,以及仅在高概率位置出现的ABC形态。 Azimuth Pro 专为需要结构分析和智能自动化的专业交易者打造。 Azimuth 以外科手术般的精度映射市场结构,而Azimuth Pro增加了智能层:自动检测您的交易风格、智能配置的移动平均线,以及经过20年数据回测优化的参数。结果是专业级分析自动适应您的交易品种和时间框架。 这是我们Merkava Labs每天为自己和客户使用的指标。 PRO版本的独特之处 智能配置 Pro版本理解您的交易环境。将它放在EURUSD M15上,它知道您在做日内交易。放在BTCUSD H4上,它会调整为波段交易。无需手动调整。 自适应移动平均线 标准EMA有效。但ATR自适应StepMA(响应波动率)和动
Power Candles MT5
Daniel Stein
5 (7)
Power Candles – 适用于所有市场的基于强度的入场信号 Power Candles 将 Stein Investments 经过验证的强度分析直接带入价格图表。与仅对价格作出反应不同,每一根蜡烛都基于真实的市场强度进行着色,使交易者能够立即识别动能累积、强度加速以及清晰的趋势转换。 一套逻辑,适用于所有市场 Power Candles 可自动适用于 所有交易品种 。该指标会检测当前品种是否为外汇货币对或非外汇市场,并在内部自动应用相应的强度模型。 外汇与黄金 使用 FX Power Delta 数值(绝对范围最高至 100) 指数、加密货币和 CFD 使用 IX Power 强度数值(绝对范围最高至 50) 所需的强度计算已直接嵌入 Power Candles。本指标在蜡烛着色和信号逻辑方面无需额外安装任何其他指标。 以强度状态替代价格噪音 每根蜡烛都会被归类为九种清晰定义的强度状态之一: 中性 轻度、中度、强烈、极端空头 轻度、中度、强烈、极端多头 这种基于状态的方法能够过滤随机的价格波动,专注于有意义的市场参与行为。它帮助交易者识别新的方向性阶段正在形成,而不是对单根蜡
Entry In The Zone and SMC Multi Timeframe is a real-time 2-in-1 market analysis tool that combines market structure analysis and a No Repaint BUY / SELL signal system into a single indicator, built on Smart Money Concepts (SMC) — a widely adopted framework used by professional traders to understand market structure. This indicator helps you see the market more clearly, make decisions based on structure rather than guesswork, and focus on high-probability zones where price is more likely to react
Divergence Bomber
Ihor Otkydach
4.9 (86)
购买该指标的每位用户将额外免费获得以下内容: 原创工具“Bomber Utility”,该工具会自动跟踪每一笔交易,设置止损和止盈点,并根据策略规则自动平仓; 适用于不同交易品种的指标设置文件(Set 文件); 三种不同风险模式下的 Bomber Utility 设置文件:“最低风险”、“平衡风险” 和 “观望策略”; 一套详细的 视频操作手册,帮助您快速完成安装、配置并开始使用本交易系统。 注意: 要获取以上所有赠品,请通过 MQL5 的私人消息系统联系卖家。 我为您介绍原创的自定义指标 “Divergence Bomber”(背离轰炸机),它是一套基于 MACD 背离交易策略 的“全功能”交易系统。 该技术指标的主要任务是识别 价格与 MACD 指标之间的背离,并发出交易信号(包括推送通知),指示未来价格可能的运动方向。平均而言,这些信号的准确率超过 98%。有关该指标如何工作的详细说明,请观看本页面上的视频演示。 该系统使用 止损订单 和 动态回撤平仓机制 来管理交易。 Divergence Bomber 指标的主要特点: 支持交易的品种: AUDCAD、AUDCHF、AUDSG
购买此指标即可免费获得我的专业交易管理器。 首先,值得强调的是,这个交易系统是一个非重绘、非重画和非滞后的指标,这使得它非常适合手动和机器人交易。 在线课程,手册和下载预设。 “智能趋势交易系统 MT5”是专为新手和经验丰富的交易者量身定制的综合交易解决方案。它结合了超过 10 个优质指标,具有 7 多个强大的交易策略,使其成为适用于各种市场条件的多功能选择。 趋势跟随策略:提供精确的入场和止损管理,以有效地跟随趋势。 反转策略:识别潜在的趋势反转,使交易者能够利用区域市场的机会。 剃头策略:专为快速准确的日内交易和短期交易而设计。 稳定性:所有指标都不会重绘、不会重画和不会滞后,确保可靠的信号。 定制:支持自定义策略,以满足个人交易偏好。超过 7 种策略和组合可帮助您找到最佳策略。 信号清晰度:提供箭头信号,以指示清晰的入场和退出点。 实时警报:通过交易进出警报使交易者保持了解。 深入分析:提供更高时间框架的趋势分析和实时交易监控。 自适应颜色编码:利用蜡烛颜色编码来显示成交量、趋势和反转蜡烛信号。通过蜡烛颜色分析市场方向。 “智能趋势交易系统 MT5”赋予交易者必要的工具,以便在
Meridian Pro
Ottaviano De Cicco
5 (1)
Meridian Pro:MT5专业多时间框架趋势矩阵 概览 Meridian Pro 是 Merkava Labs 推出的多时间框架趋势矩阵,将方向状态、强度、动量条件和矩阵一致性压缩到一个紧凑面板中。一个自适应引擎,从M1到W1一致应用。无需逐品种调参。无需堆叠指标。一个结构化读数覆盖所有资产和所有时间框架。 上市优惠 — Meridian Pro 优惠价 USD 99 (限时)。常规价格:USD 149 。 1. Meridian Pro 为何不同 一个引擎,而非互不相连的指标仪表盘 许多MTF仪表盘只是在各时间框架重复原始指标状态。Meridian Pro在整个矩阵中使用一个自适应趋势引擎,面板中的每一行都来自同一个结构化框架。这使其读取快速、使用简洁,在真实图表条件下实用。 合成时间框架架构 Meridian Pro不依赖常规的零售MTF方法,而是从 M1数据 构建统一的内部矩阵结构。无经典MTF同步问题。无因脆弱的高时间框架拼接导致的重绘或延迟。无因不稳定时间框架依赖导致的面板冻结。在不同高时间框架数据质量的经纪商之间具有更好的稳健性。 2. 面板显示内容 Bias — 每
OmniSync Projection
Antonio-alin Teculescu
5 (1)
Chronos Fractal Engine is an innovative price projection indicator for MetaTrader 5, designed to transform your technical analysis by intelligently identifying and projecting historical price patterns. Built upon an advanced correlation algorithm and the fractal principles of the market, this powerful tool visualizes potential future price movements, giving you a unique edge in your trading decisions. What is Chronos Fractal Engine? At its core, the Chronos Fractal Engine employs a sophisticat
Gold Entry Sniper
Tahir Mehmood
5 (8)
Gold Entry Sniper – 专业多周期ATR黄金交易仪表盘,适合黄金剥头皮与波段交易 Gold Entry Sniper 是一款先进的 MetaTrader 5 指标,旨在为 XAUUSD 及其他品种提供精准的 买/卖信号 。基于 ATR 移动止损逻辑 和 多周期分析仪表盘 ,适合剥头皮交易者与波段交易者,帮助识别 高概率黄金入场点 。 主要功能与优势 多周期信号分析 – 同时显示 M1、M5、M15 趋势方向。 基于ATR的动态止损 – 根据波动性自动调整。 专业图表仪表盘 – 展示信号状态、ATR水平、线性回归中线和交易方向。 清晰买卖标记 – 自动箭头与文字标签提示。 离场提示与交易管理 – 自动检测离场信号锁定利润。 全面自定义 – 调整仪表盘位置、颜色、字体及参数。 专为黄金优化 – 适用于 M1至M15 黄金剥头皮 ,也适合外汇、指数与加密货币。 为什么选择 Gold Entry Sniper? 为追求 快速、精准、可视化交易决策 的交易者打造,ATR 与多周期确认结合,帮助你抓住 最佳黄金入场点
Trend Screener Pro MT5
STE S.S.COMPANY
4.85 (104)
使用趋势筛选指标释放趋势交易的力量:由模糊逻辑和多货币系统提供支持的终极趋势交易解决方案! 使用趋势筛选器(由模糊逻辑提供支持的革命性趋势指标)提升您的趋势交易。 它是一个强大的趋势跟踪指标,结合了超过 13 种高级工具和功能以及 3 种交易策略,使其成为使您的 Metatrader 成为趋势分析器的多功能选择。 限时优惠:趋势筛选指标终身仅需 50 美元。 ( 原价 250$ ) (优惠延长) 体验趋势筛选器 100% 无需重新绘制的准确性,确保您的交易决策不受过去价格变化的影响。 释放多时间框架和多货币功能的多功能性,使您能够以无与伦比的信心在外汇、商品、加密货币和指数领域进行交易。 利用 Trend Screener 的综合策略套件增强您的交易: - 趋势跟踪策略和趋势延续策略 :趋势筛选器的趋势跟踪策略提供清晰的趋势延续信号,让您有效捕捉趋势走势并管理风险。 - 反转策略和早期入场点策略 :趋势筛选器的反转策略可检测市场方向的潜在变化,使您能够预测趋势反转并利用疲弱的市场趋势。通过早期入场点,您可以在潜在的趋势变化之前定位自己 获取可观的利润。 - 倒卖策略: 趋势筛选器的倒卖
Btmm state engine pro
Garry James Goodchild
5 (3)
BTMM State Engine Pro is a MetaTrader 5 indicator for traders who use the Beat The Market Maker approach: Asian session context, kill zone timing, level progression, peak formation detection, and a multi-pair scanner from a single chart. It combines cycle state logic with a built-in scanner dashboard so you do not need the same tool on many charts at once. What it does Draws the Asian session range; session times can follow broker server offset or be set in inputs. Tracks level progression (L
Power Bar MT5
Daniel Stein
在冒真金白银之前, 先看看哪种策略真正适合你的品种。 Power Bar 可在任何品种和任何时间周期上检测 极端价格K线 , 然后即时回测3种不同的交易策略, 让你并排比较胜率、盈亏比和收益。全部集成在一个交互式面板中。 无需猜测。无需过度拟合。只看数据。 Power Bar 有何独特之处? 大多数指标只给你一个信号, 让你猜测它是否有效。Power Bar 更进一步: 它用 三种策略 测试每个信号并展示统计数据。一键切换 FlipFlop、Momentum 和 Reversal, 即刻看到数据变化。 FlipFlop - 始终持仓。信号入场, 反向信号出场。我们的研究表明, 这在 US30、US500 和 DAX 等趋势性指数上效果最佳。 Momentum - 顺信号方向交易。基于 ATR 的固定 SL/TP。适用于趋势延续形态的均衡方法。 Reversal - 逆信号交易(反向操作)。我们的回测显示, 在 JPY 外汇交叉盘上胜率超过 70%, 因为极端K线标志着衰竭而非延续。 更改参数, 即时查看结果 无需打开指标属性。直接在面板中通过 +/- 按钮调整 ATR 倍数、周期、
FX Trend MT5 NG
Daniel Stein
5 (4)
FX Trend NG:新一代多市场趋势智能分析工具 概述 FX Trend NG 是一款专业的多时间周期趋势分析与市场监控工具,帮助您在几秒钟内全面了解市场结构。 无需在多个图表之间来回切换,您可以立即看到哪些品种处于趋势中、哪里动能正在减弱,以及哪些时间周期之间存在强烈共振。 限时发布优惠 – 仅需 $30(6个月) 或 $80 终身授权 即可拥有 FX Trend NG 。 已经是 Stein Investments 客户? -> 发送消息 以获取专属客户群访问权限。 需要帮助或安装指导? -> 请访问 Stein Investments 官方页面 。 1. FX Trend NG 的核心优势 三状态趋势逻辑 —— 不只是 Buy 或 Sell • 大多数指标仅显示两种状态:Buy 或 Sell。 • FX Trend NG 增加第三种状态: Fade 。 • Fade 表示趋势强度正在减弱,在完全反转之前提前发出信号。 这种结构化逻辑让您看到趋势变化过程,而不仅仅是简单方向信号。 多时间周期分析(M1 至 MN1) • 从短线交易到中长线交易全面覆盖。 • 快速识别趋势
Crystal Heikin Ashi Signals
Muhammad Jawad Shabir
5 (2)
Crystal Heikin Ashi Signals - Professional Trend & Signal Detection Indicator Advanced Heikin Ashi Visualization with Intelligent Signal System for Manual & Automated Trading Final Price: $149 ---------> Price goes up $10 after every 10 sales . Limited slots available — act fast . Overview Crystal Heikin Ashi Signals is a professional-grade MetaTrader 5 indicator that combines pure Heikin Ashi candle visualization with an advanced momentum-shift detection system. Designed for both manual traders
RFI levels PRO MT5
Roman Podpora
3.67 (3)
该指标能够准确显示反转点和价格回落区域。     行业领军人物 。您能洞察新趋势的形成,并以最高的精准度做出决策,掌控每一笔交易。 VERSION MT4     -    与……结合时,展现其最大潜力     趋势线专业版   指标 该指标显示的内容: 新趋势开始时的反转结构和反转水平及其激活。 显示屏   获利了结   和   止损   风险回报比最低的水平     RR 1:2       。 具有智能减值逻辑的止损。 显示指定指标中两种趋势类型的反转形态。 指标: 根据     趋势线     (全球趋势变化) 潮流专业版     (趋势快速变化) 简单有效   扫描器   实时趋势(新增)。 多时间框架工具筛选。 展示   利润   在 LOGIC AI 信号之后。 以下列出今日走势积极的金融工具。(RB键) 能够为终端启用通知(警报)功能,并向移动设备推送通知。 逻辑人工智能     — 利用人工智能寻找最佳切入点。 只有在启用 MTF(多时间框架分析)模式时,该功能才可用。 兼容性。 当与趋势线指标结合使用时,该指标能发挥其最大潜力。 这     RFI LEVELS
Trend indicator AI mt5
Ramil Minniakhmetov
5 (16)
趋势人工智能指标是一个伟大的工具,将加强交易者的市场分析结合趋势识别与可操作的进入点和逆转警报。 该指标使用户能够自信和精确地驾驭外汇市场的复杂性 除了主要信号,趋势Ai指标识别在回调或回调期间出现的次要入口点,使交易者能够利用既定趋势内的价格修正。 重要优势: *MT4及MT5工程 *明确买入或卖出信号 ·不重绘 *适用于所有资产 小心我不卖EA或设置电报它骗局. 所有设置免费在这里的博客。  重要! 购买后立即与我联系,以获得指示和奖金! 真实的操作监控以及我的其他产品可以在这里找到: https://www.mql5.com/en/users/mechanic/seller&nbsp ; 设置和输入: 建议为所有资源设置默认设置。 第...
Bill Williams Advanced
Siarhei Vashchylka
5 (11)
Bill Williams Advanced is designed for automatic chart analysis using Bill Williams' "Profitunity" system. The indicator analyzes four timeframes at once. Manual (Be sure to read before purchasing) Advantages 1. Analyzes the chart using Bill Williams' "Profitunity" system. Signals are displayed in a table in the corner of the screen and on the price chart. 2. Finds all known AO and AC signals, as well as zone signals. Equipped with a trend filter based on the Alligator. 3. Finds "Divergence Bar
Atomic Analyst MT5
Issam Kassas
3.94 (31)
首先值得强调的是,该交易指标是非重绘、非延迟的指标,这使其成为手动和机器人交易的理想选择。 用户手册:设置、输入和策略。 Atomic Analyst是一种PA价格行动指标,利用价格的力量和动量来寻找市场上更好的机会。配备了高级过滤器,可帮助去除噪音和假信号,并提高交易潜力。使用多层复杂的指标,Atomic Analyst扫描图表,并将复杂的数学计算转化为任何初学者都能理解并用来做出一致交易决策的简单信号和颜色。 “Atomic Analyst”是专为新手和经验丰富的交易者量身定制的综合交易解决方案。它将高级指标和一流功能融合为一体的交易策略,使其成为所有类型交易者的多功能选择。 日内交易和剥头皮策略:专为快速准确的日内交易和短期交易而设计。 日内和摆动交易策略:可用作追求价格大幅波动的日内和摆动交易者的可靠工具。 多货币和市场:凭借其可靠的精度,在不同的工具和市场上运作。 多个时间框架:可在多个时间框架上使用,性能良好。 稳定性:所有指标均不重绘、不重绘和不滞后,确保可靠的信号。 信号清晰度:提供箭头信号,用于清晰的入场和出场点。 实时警报:通过交易入场、SL和TP警报通知交易者
Quantum TrendPulse
Bogdan Ion Puscasu
5 (22)
介绍 Quantum TrendPulse   ,这是一款终极交易工具,它将 SuperTrend   、   RSI 和 Stochastic 的强大功能整合到一个综合指标中,以最大限度地发挥您的交易潜力。该指标专为追求精准和效率的交易者而设计,可帮助您自信地识别市场趋势、动量变化以及最佳进入和退出点。 主要特点: 超级趋势整合: 轻松跟随当前的市场趋势并乘上盈利浪潮。 RSI 精度: 检测超买和超卖水平,非常适合把握市场逆转时机,可用作 SuperTrend 的过滤器 随机精度: 利用随机振荡在波动的市场中寻找隐藏的机会, 用作超级趋势的过滤器 多时间范围分析: 从 M5 到 H1 或 H4,在不同时间范围内关注市场动态。 可定制的警报: 当您的自定义交易条件得到满足时收到通知,这样您就不会错过任何交易。 无论您是新手还是经验丰富的交易员,   Quantum TrendPulse 都能为您提供所需的优势,帮助您增强策略并自信地进行交易。借助这一强大的指标,将洞察力转化为利润 — 掌控您的交易! ***购买 Quantum TrendPulse,即可免费获得 Quantum Tr
Gann Made Easy MT5
Oleg Rodin
5 (2)
Gann Made Easy   是一个专业且易于使用的外汇交易系统,它基于使用先生理论的最佳交易原则。 W.D.江恩。该指标提供准确的买入和卖出信号,包括止损和获利水平。您甚至可以使用推送通知在旅途中进行交易。 购买后请联系我,即可免费获得交易指导和超棒的额外指标! 您可能已经多次听说过江恩交易方法。通常 Gann 的理论不仅对于新手交易者而且对于那些已经有一定交易经验的人来说都是非常复杂的东西。这是因为江恩的交易方法在理论上并不那么容易应用。我花了几年时间来完善这些知识,并将最好的原则应用到我的外汇指标中。 该指标非常易于应用。您所需要的只是将其附加到您的图表并遵循简单的交易建议。该指标不断进行市场分析工作并寻找交易机会。当它检测到一个好的入口点时,它会为您提供一个箭头信号。该指标还显示止损和获利水平。 换句话说,当您像先生一样进行交易时,该指标会为您提供最佳江恩建议。江恩亲自告诉你此时此刻该做什么。但最好的部分是您不需要了解任何有关江恩交易原则的知识,因为该指标会为您完成整个市场分析工作。
PZ Trend Trading MT5
PZ TRADING SLU
3.8 (5)
许多盈利交易者不仅知道如何识别市场趋势,而且也能把握趋势建立后的交易机会。 Pz 趋势交易 指标设计用来在趋势行情中尽可能的赚取利润。 已建立的趋势提供了一揽子交易机会,但大多数趋势交易指标完全忽视了它们,让交易者在趋势行情时完全不知道该如何做!一般趋势指标只通知有关的趋势变化,但根本不足以得到卓越的回报. Pz 趋势交易 指标比一般趋势指标显示多达 20 倍的交易 , 因为它注重所谓的市场时机。它不仅显示当前的市场趋势,也有回调,内柱线的突破和调整。它令您在趋势回调之后介入,安全的柱线内突破金字塔加仓,以及发现潜在的反转,和已知的调整。 趋势改变 一个趋势改变在市场方向变化时发生。趋势变化在图表上用带数字的彩色圆圈显示。蓝色 (1) 信号为上涨开始, 而红色 (1) 信号为下跌开始。趋势变化并非评估当前价格动作的结果, 它意味着交易设置是不定时地。如果您正确使用本指标, 在趋势变化时, 您将将已经入场 (参看下面的调整)。 回调 但凡趋势在运动中,行情上下抖动,盈利者收割利润,且其它参与者入场。趋势回调代表好的买入机会,通常是由主力获利离场导致。如果行情在回调后回归上行, 指标将
ARICoins
Temirlan Kdyrkhan
ARICoin is a powerful trading companion designed to generate high-probability entry signals with dynamic TP/SL/DP levels based on volatility. Built-in performance tracking shows win/loss stats, PP1/PP2 hits, and success rates all updated live. Key Features: Buy/Sell signals with adaptive volatility bands Real-time TP/SL/DP levels based on ATR Built-in MA Filter with optional ATR/StdDev volatility Performance stats panel (Success, Profit/Loss, PP1/PP2) Alerts via popup, sound, push, or email Cust
RelicusRoad Pro MT5
Relicus LLC
5 (24)
RelicusRoad Pro: 量化市场操作系统 终身访问限时 70% 折扣 - 加入 2,000+ 交易员社区 为什么大多数交易者即使拥有“完美”指标也会失败? 因为他们在真空中交易 单一概念 。没有背景的信号是赌博。要持续获胜,您需要 共振 (CONFLUENCE) 。 RelicusRoad Pro 不是一个简单的箭头指标。它是一个完整的 量化市场生态系统 。它描绘价格运行的“公允价值之路”,区分市场噪音和真实的结构性突破。 停止猜测。开始用机构级“路”逻辑进行交易。 核心引擎:“Road” (路) 算法 系统的核心是 Road Algo ,一个实时适应市场条件的动态波动率通道。它投射出 安全线 (平衡) 和价格可能反转的 扩展水平 。 Simple Road: 典型市场的标准结构映射。 Smooth Road: 针对震荡盘整的降噪计算。 Breakout Road: 专为识别波动率扩张和爆发性走势而调整。 1. 算法动量与确认 我们的“剥头皮箭头”不只是简单的交叉。它们利用 高阶多项式逻辑 过滤噪音,确保信号与主周期一致。我们检测动量、价格行为和 Road 结构汇聚的精确入场
FX Power MT5 NG
Daniel Stein
5 (31)
FX Power:分析货币强度,助您做出更明智的交易决策 概述 FX Power 是一款专业工具,帮助您全面了解主要货币和黄金在任何市场条件下的真实强度。通过识别强势货币用于买入,弱势货币用于卖出, FX Power 简化了交易决策,并帮助您发现高概率的交易机会。不论您是想跟随趋势还是通过极端的 Delta 值预测反转,这款工具都能完美适应您的交易风格。别再盲目交易——用 FX Power 让您的交易更加智慧。 1. 为什么 FX Power 对交易者极具价值 实时货币和黄金强度分析 • FX Power 实时计算并显示主要货币和黄金的相对强度,助您全面了解市场动态。 • 监控领先或落后资产,轻松识别值得交易的货币对。 全面的多时间框架视图 • 跟踪短期、中期和长期时间框架的货币和黄金强度,以便将您的交易策略与市场趋势保持一致。 • 无论是快进快出的短线交易还是更长期的投资策略, FX Power 都能为您提供所需的信息。 Delta 动态分析用于趋势和反转 • 极端 Delta 值常常预示反转机会,而平缓的 Delta 变化则确认趋势延续。 • 使用 Delta 分析,轻
Currency Strength Dashboard Pro
Anastasia Danilova
5 (1)
Currency Strength Dashboard Pro 适用于 MetaTrader 5 的专业级实时货币强度分析面板。 该指标同时对 8 种主要货币 (EUR、USD、GBP、JPY、CHF、AUD、CAD、NZD)进行强度计算,并基于 28 个货币对 在多个时间周期上进行分析和显示。 该面板让交易者能够 一眼看清整个市场状况 —— 无需额外计算,也无需在多个图表之间切换。 计算方法 该指标基于一种 先进的数学货币强度计算方法 ,相比许多类似指标常用的 RSI 方法 ,具有更高的准确性和客观性。 该方法同时分析 全部 28 个货币对之间的关系 ,从而提供更清晰、更无偏差的市场真实强弱对比。 实时分析面板 主表格显示 8 种货币 的完整数据: Rank(排名) — 按整体强度排序, 1 为最强,8 为最弱 。 Strength(强度) — 当前货币强度的数值。 Change(变化) — 与上一根K线相比的强度变化。 Slope(斜率) — 强度趋势方向:上升、下降或横盘。 时间周期数据(M15、H1、H4、D1) — 各时间周期的独立强度值。 Composite(综合值) —
CGE Trading Suite
Carl Gustav Johan Ekstrom
5 (1)
CGE Trading Suite delivers the analytical edge typically reserved for professional trading desks. The platform integrates a full suite of analytical tools into one seamless workflow: dynamic grid mapping, liquidity behavior analysis, ECM, trend lines, MIDAS, trade cycles, and directional channel projections. Together, these provide a unified view of market structure and momentum. Directional clarity is further enhanced by the capital flow index, which measures currency basket strength to identif
HFT Spike Detector
OMG FZE LLC
5 (2)
[ My Products ] , [ My Channel ]   ,  [ LIVE SIGNAL ] HFT Spike Detector HFT Spike Detector 是一款专业的 tick 监控工具,旨在实时分析和测量高频交易(HFT)引发的价格剧烈波动。 其目标是通过数值数据帮助您识别由经纪商引起的异常滑点、流动性缺口以及毫秒级价格跳动。 由于它分析的是实时逐笔数据流和订单执行条件,因此无法通过回测进行准确评估。 您可以购买此EA,并结合现成的参数设置文件(set文件)实现自动化: VolumeHedger EA 工作原理 该 Expert Advisor 会实时分析每一个传入的 tick 数据,并: 价格变化速度 每秒 tick 密度 滑点幅度 同方向微观流动 进行测量并以图表面板形式展示。 因此,您可以看到除点差之外的真实执行质量。 面板显示指标 Slippage 显示监控 tick 中的最大滑点值(以 points 为单位)。 用于检测突发流动性缺口和激进的价格跳动。 Avg Slippage 显示所有传入 tick 的滑点平均值(以 p
ARIPoint
Temirlan Kdyrkhan
ARIPoint is a powerful trading companion designed to generate high-probability entry signals with dynamic TP/SL/DP levels based on volatility. Built-in performance tracking shows win/loss stats, PP1/PP2 hits, and success rates all updated live. Key Features: Buy/Sell signals with adaptive volatility bands Real-time TP/SL/DP levels based on ATR Built-in MA Filter with optional ATR/StdDev volatility Performance stats panel (Success, Profit/Loss, PP1/PP2) Alerts via popup, sound, push, or email Cu
Trend Lines PRO MT5
Roman Podpora
5 (1)
趋势线专业版 -     有助于了解市场真正转变的方向。该指标显示了真正的趋势反转点以及主要参与者重新入场的点位。 你看     BOS线路   无需复杂设置或不必要的干扰,即可在高时间框架内显示趋势变化和关键水平。信号不会重绘,并在K线收盘后仍保留在图表上。 MT4 版本   - 与 RFI LEVELS PRO 指示器结合使用时,可发挥其最大潜力 该指标显示的内容: 真正的转变   趋势线(BOS线) 一旦信号出现,它就始终有效!这与会重绘的指标有着重要的区别,后者可能会发出信号后又改变信号,从而导致资金损失。现在,您可以更精准、更准确地进入市场。此外,还有一个功能:在箭头出现后,K线会着色,直到达到目标价位(止盈)或出现反转信号为止。 重复条目   以及主要玩家的充值 为了提高寻找入场点时的视觉清晰度,我们创建了一个模块,该模块首先显示买入/卖出区域,并在该区域内寻找最佳入场点。此外,我们还加入了智能逻辑来管理止损位,该逻辑会随着时间的推移逐步降低止损位的大小,从而降低入场时的初始风险( 移动止损位 )。 信号强度水平     (BOS) 该指标采用三个显著性等级来衡量趋势变化
Berma Bands
Muhammad Elbermawi
5 (8)
Berma 波段 (BBs) 指标对于寻求识别和利用市场趋势的交易者来说是一种有价值的工具。通过分析价格与 BBs 之间的关系,交易者可以辨别市场是处于趋势阶段还是区间波动阶段。 访问[ Berma Home Blog ] 了解更多信息。 Berma 带由三条不同的线组成:上 Berma 带、中 Berma 带和下 Berma 带。这些线围绕价格绘制,直观地表示价格相对于整体趋势的变动。这些带之间的距离可以洞察波动性和潜在的趋势逆转。 当 Berma Bands 线相互分离时,通常表明市场正在进入横盘或区间波动时期。这表明缺乏明确的方向性。交易者可能会发现在这些时期内很难识别趋势,因此可能需要等待更清晰的趋势出现。 当 Berma Bands 线汇聚成一条线时,通常表示趋势环境强劲。这种汇聚表明存在明显的方向性偏差,因为价格波动性足以随趋势而变化。交易者可能会发现在这些时期更容易识别潜在的入场点和出场点,因为趋势的势头可以提供有利的交易机会。然而,重要的是要注意整体趋势中的潜在回调或修正。 Berma 带根据价格蜡烛图与上带和下带的相互作用提供明确的买入和卖出信号。当价格蜡烛图首
作者的更多信息
All in One Pivot Point
Ali Gokay Duman
5 (7)
This indicator calculates support and resistance prices in multi-timeframe with different formulation and draw them on the chart that style do you choose. And If you want, Indicator can alert you when the current price arrive these pivot levels. Formulations: Classic, Camarilla, Woodie, Demark, Floor, Fibonacci Alert Options: Send Mobil Message, Send E-mail, Show Message, Sound Alert Levels: PP, S1, S2, S3, S4, S5, R1, R2, R3, R4, R5, TC, BC  and Middle Points Why do you need this indicator: Ti
FREE
This Expert Advisor follows your channel lines that you draw. and when the price reaches these support and resistance trend lines, EA send open or close order automatically. You must draw two trend line with same color for EA to work, not equidistant channel line. and this color must be specified in ChannelColor parameter Strategies: Inside Channel Strategy: If the price reaches bottom trend line, the EA will place a buy order. and when the price reaches the top trend point, EA send close order
FREE
You can use this tool to create as many pending orders (limit order) as you want in one button press. All inputs must be in points. You can use this useful tool when such as FED speech times. User Inputs: MagicNumber = Magic number DeviationPoint = Deviation point number for limit orders Level = You can choise how many level do you want to create pending orders. BuyOrder = true/false SellOrder = true/false StartDistance = Distance between each level. StepDistance = Distance to be added increment
FREE
Lows And Highs
Ali Gokay Duman
5 (5)
This indicator draws the highest and the lowest prices of the previous periods on the chart. And If you want, Indicator can alert you when the current price arrives   these levels. For example: If you are watching the H1 timeframe, Indicator shows you the  lowest and the highest prices of H4, D1, W1 and M1 periods. So you don't need to open the other periods of chart windows. Alert Options: Send Mobil Message, Send E-mail, Show Message, Sound Alert Time Periods:  M1, M5, M15, M30, H1, H2, H3, H
FREE
MA ZigZag
Ali Gokay Duman
5 (2)
This indicator calculates trend via two different moving averages and draw zigzag trend lines. You can change fast and slow Moving Averages settings for customization. Inputs: Fast MA Time Period :  64 Fast MA Shift: 0 Fast MA Method: Smoothed Fast MA Apply To: Median Price Slow MA Time Period: 32 Slow MA Shift: 0 Slow MA Method: Smoothed Slow MA Apply To: Median Price ZigZag Color: Red ZigZag Type: DashDot ZigZag Width: VeryThin 
FREE
Gann Pivot Levels
Ali Gokay Duman
4.17 (6)
This indicator calculates gann support and resistance prices with use gann pyramid formulation and draw them on the chart. And If you want, Indicator can alert you when the current price arrive these pivot levels. Alert Options: Send Mobil Message, Send E-mail, Show Message and Sound Alert Levels: S1, S2, S3, S4, S5, R1, R2, R3, R4, R5 Inputs:  GannInputPrice: Input price for gann pyramid formulation. GannInputDigit: How many digit do you want to use for calculation formula. (The number and the
FREE
Pivot Point Expert
Ali Gokay Duman
5 (1)
This indicator calculates support and resistance prices in multi-timeframe with different formulation and draw them on the chart that style do you choose. And If you want, Indicator can alert you when the current price arrive these pivot levels. Formulations: Classic, Camarilla, Woodie, Demark, Floor, Fibonacci Alert Options: Send Mobil Message, Send E-mail, Show Message, Sound Alert Levels: PP, S1, S2, S3, S4, S5, R1, R2, R3, R4, R5, TC, BC and Middle Points Why do you need this indicator: Tim
FREE
You can send MetaTrader screenshot easily to your identified telegram channel via press the send button that on the chart. TelegramBotToken: Telegram API credentials. You can create API credentials on my.telegram.org web page ChatId: Your telegram chatId. Secreenshots will be sending this channel - Please do not press the button repeatedly. This may cause your bot or ip address to be blocked. - You have to add telegram api address ( https://api.telegram.org ) in Option > Expert Advisors > Allow
FREE
This indicator draws on the chart high and low prices of different periods . And If you want, Indicator can alert you when the current price arrive these levels. Alert Options:   Send Mobil Message, Send E-mail, Show Message, Sound Alert Time Periods:  M1, M5, M15, M30, H1, H4, D1, W1, MN Inputs:  TimeShift: You can set start hour for calculating. And that way you can see levels independently from broker server's time-zone. PipDeviation: You can set price sensibility for alert (Default: 3) Lines
FREE
You can send MetaTrader screenshot easily to your identified telegram channel via press the send button that on the chart. TelegramBotToken: Telegram API credentials. You can create API credentials on my.telegram.org web page ChatId: Your telegram chatId. Secreenshots will be sending this channel  - Please do not press the button repeatedly. This may cause your bot or ip address to be blocked. - You have to add telegram api address ( https://api.telegram.org ) in Option > Expert Advisors > Allow
FREE
This utility exports candle data   which you chosed by input parameter  to CSV  file. Time Frames:  M1,M5,M15,M30,H1,H4 Inputs: StartTime: Start time for exporting data. EndTime:   End time for exporting data. DataType: Close, Open, High, Low, Median(HL/2), Typical(HLC/3), Weighted(HLCC/4), Pip(H-L). DecimalSeperator: Decimal seperator for candle price data. (Default = ".") CSVDelimiter: Delimiter character for CSV file.  (Default = ";") * This utility exports candle data horizontally. That me
FREE
筛选:
Douglas R.
20
Douglas R. 2025.02.06 18:39 
 

i can see mql5 for personalize in portuguese?

Natascha Jeske
181
Natascha Jeske 2024.05.06 04:31 
 

Excellent indicator. I've been looking for a long time. Would it be possible to adjust the font size? It's a little too small.

Ali Gokay Duman
16337
来自开发人员的回复 Ali Gokay Duman 2024.05.06 12:16
Thank you for your feedback. Of course, I will add it to my notes.
alan5000
28
alan5000 2022.03.24 23:51 
 

It works really good.

Ali Gokay Duman
16337
来自开发人员的回复 Ali Gokay Duman 2022.03.25 21:25
Thank you for your review
回复评论