 MetaTrader 5
 エキスパート
 インディケータ
 ライブラリ
ライブラリ
 ユーティリティ
 ウィジェット
 ルール
ルール
YouTubeにあるマーケットチュートリアルビデオをご覧ください
ロボットや指標を購入する
仮想ホスティングで
EAを実行
EAを実行
ロボットや指標を購入前にテストする
マーケットで収入を得る
販売のためにプロダクトをプレゼンテーションする方法
MetaTrader 4のためのテクニカル指標 - 169
 以下にリストされているテクニカル指標からのシグナルは、MetaTrader4プラットフォームで取引を開始および終了する際に重要な役割を果たします。
指標の本質は、価格変動の予測を目的とした金融銘柄価格の数学的変換です。
以下にリストされているテクニカル指標からのシグナルは、MetaTrader4プラットフォームで取引を開始および終了する際に重要な役割を果たします。
指標の本質は、価格変動の予測を目的とした金融銘柄価格の数学的変換です。 
Have you ever wondered why your Stop Losses get triggered down to the exact pip, only for the market to immediately reverse in your intended direction? This is not a coincidence – this is a Liquidity Sweep, also known as a Stop Hunt. Central Bank algorithms and Market Makers require massive order volume to transition their huge positions, and this volume is heavily clustered as resting orders above and below key high-timeframe (HTF) swing highs and lows. Liquidity Map PRO is a professional marke

GapZone Pro – Dynamic Gap Trading Engine for MT4
The Gap That Evolves with the Market Most gap indicators detect a gap once, draw a box, and never change it again. GapZone Pro is different. Its proprietary Dynamic Gap Engine continuously recalculates the active market gap as price evolves. As the size of the gap expands or contracts, every Fibonacci level, retracement zone, and distance calculation updates automatically in real time. Instead of trading yesterday's gap, you're trading the marke

ML RSI | AI Classification & Ranking Overview ML RSI | AI Classification & Ranking is an adaptive RSI intelligence system that combines momentum analysis, historical analog recognition, machine learning classification, confidence scoring, and dynamic trend management into a single framework. Rather than interpreting RSI solely through traditional overbought and oversold thresholds, the indicator examines how similar RSI environments have behaved historically and uses those observations to classi

Here's a professional Japanese translation suitable for the MQL5 Market. Multi-Engine London Breakout Matrix Pro(インタラクティブ・マルチペア・ダッシュボード搭載) 短い説明 ロンドンセッションのブレイクアウトゾーン、3つのマルチタイムフレーム・トレンドメーター、クリック操作対応のインタラクティブ・マルチペア・ダッシュボード、そしてスマートなプライスリジェクションシグナルを組み合わせた、高度なマルチエンジン・ロンドンセッショントレーディングシステム(Ultimate Dashboard)。 詳細説明 Multi-Engine London Breakout Matrix Pro は、機関投資家レベルのロンドンセッション分析を実現するプロフェッショナル向けトレーディングツールです。単なるロンドンセッションボックスではなく、本格的なトレーディングワークステーションとして設計されています。 本インジケーターは、ロンドン市場のオープニングレンジ・ブレイクアウトと、3つのマルチタイムフ

Trade Status Panel MT4 Trade Status Panel MT4 is a clean dashboard indicator designed to help traders monitor account performance and risk directly on the chart. It displays key trading statistics such as daily, weekly, and monthly performance, recorded drawdown, profit factor, recovery factor, and current spread in a compact and easy-to-read panel. This tool is useful for traders who want to quickly check their trading condition without opening the account history or switching between multiple

Innovator Trend Sniper This trend indicator combines the power of an adaptive trend filter with dynamic volatility assessment (ATR), filtering out false flat-market movements. 100% NO REPAINT: The arrow appears strictly at the close of the current candle. Once the candle closes — the signal remains on the chart forever. You can easily verify the entire history of the indicator manually. Smart False-Entry Filter: The indicator ignores "sleepy" sideways markets. A buy or sell signal is generat

Gold Session Trap Distance Map Gold Session Trap Distance Map is a clean intraday liquidity-mapping indicator designed for XAUUSD traders who want to track where price still has unfinished business from major trading sessions. Instead of filling the chart with random support and resistance, this indicator focuses on one simple idea: unbroken session trap zones can act like future liquidity magnets. The indicator tracks key session trap areas from the major trading periods and displays live dista

Overview EMA Cross Pullback Pro is a professional non-repaint trend-following indicator designed for traders who use EMA crossovers and pullback entries. It combines fast and slow EMA analysis with reversal confirmation to identify high-probability trading opportunities. The indicator automatically detects: EMA Cross BUY and SELL signals Pullback/Reversal confirmation Trend direction Profit/Loss statistics Monthly performance summary Historical signal analysis from a user-defined start date Buil

QB Schumann Market Resonance MT4 QB Schumann Market Resonance MT4 is an advanced market rhythm indicator inspired by the concept of resonance and market pressure analysis. Instead of relying on traditional lagging indicators, it evaluates the balance between bullish and bearish pressure using candle structure, volatility, momentum, and tick activity to identify potential turning points and directional strength. The indicator displays an intuitive dashboard with live Bull Pressure, Bear Pressure,

The indicator MTF Sidebar is part of the of the Shved Market Analysis System (SMAS). Collects and synchronizes multi-timeframe market data, providing a comprehensive overview as part of the integrated SMAS ecosystem.
About the Creator and Algorithm Uniqueness: This indicator was designed and developed by the original creator of the very first, now classic, Shved Supply and Demand indicator, which has earned the trust of thousands of traders worldwide. The current MTF Sidebar for MT4 is the

Crypto_Forex MT4用インジケーター「RSIと2本の移動平均線」、リペイント機能なし。 - このインジケーターは、モメンタムトレードシステムに最適です。 - 「RSIと2本の移動平均線」インジケーターは、RSI自体の高速移動平均線と低速移動平均線を確認できます。 - このインジケーターは、トレンドの転換を早期に把握する機会を提供します。 - 「RSIと2本の移動平均線」は、買われ過ぎ/売られ過ぎゾーンからトレンド方向へのモメンタムを捉えるために使用できます。 - このインジケーターはパラメータ設定で簡単に設定できます。 - このインジケーターはどの時間足でも使用できます。 PC/Mobile alerts! Click here to see high quality Trading Robots and Indicators! これは、このMQL5ウェブサイトでのみ提供されるオリジナル製品です。

Crypto_Forexインジケーター アリゲーター Higher Time Frame for MT4 - アリゲーターインジケーターは、最も強力なトレンドインジケーターの一つです。HTFはHigher Time Frame(高時間枠)の略です。 - このインジケーターは、トレンドトレーダーやプライスアクションエントリーとの組み合わせに最適です。 - HTFアリゲーターインジケーターを使用すると、高時間枠のアリゲーターを現在のチャートに表示できます。 - グリーンラインがレッドラインより上に、かつレッドラインがブルーラインより上にある場合にのみ、買いエントリーを検討します。チャート上の直近のスイングの最大値で、買いストップ注文を設定します。 - グリーンラインがレッドラインより下に、かつレッドラインがブルーラインより下にある場合にのみ、売りエントリーを検討します。チャート上の直近のスイングの最小値で、売りストップ注文を設定します。 - HTFアリゲーターインジケーターは、低リスクで大きな利益を獲得する機会を提供します。 Click here to see high quality

Borders Arrow Signals MT4 The Ultimate Non-Repainting Smart Arrow Trading Indicator Borders Arrow Signals MT4 is a professional-grade MetaTrader 4 indicator designed for traders who demand precision, reliability, and high-probability trade entries. Built for the MT4 trading platform, it delivers intelligent Buy and Sell signals based on advanced market analysis while maintaining exceptional speed and efficiency. Unlike conventional arrow indicators that repaint historical signals and create fals

Crypto_Forex MT4用インジケーター「ダブルハンマーパターン」。リペイントなし、遅延なし。 - インジケーター「ダブルハンマーパターン」は、プライスアクショントレードにおいて非常に強力なインジケーターです。 - このインジケーターは、稀ではあるものの効果的なパターン、すなわちチャート上の強気なダブルハンマーパターンを検出します。 - 強気なダブルハンマーパターン - チャート上に青い矢印シグナルを表示します(画像参照)。 - PCとモバイルの両方でアラート機能を備えています。 - インジケーター「ダブルハンマーパターン」は、サポートレベル/レジスタンスレベルと組み合わせるのに最適です。 Click here to see high quality Trading Robots and Indicators! これは、このMQL5ウェブサイトでのみ提供されるオリジナル製品です。

Volume Profile ASA Professional Volume Profile Indicator for MetaTrader 4 Volume Profile ASA is a modern professional Volume Profile indicator designed for traders who make trading decisions based on real market activity rather than price movement alone. The indicator builds a Volume Profile directly on the chart, displaying the distribution of trading volume across price levels and helping traders quickly identify the most important market areas. Volume Profile ASA automatically calculates and

Gold Fuel is a professional MT4 chart-mapping indicator designed for traders who study price-leg movement, candle structure, reaction zones, and 161.8 completion targets. The indicator uses a selected market leg as the active structure, then automatically projects the working direction and displays the relevant zone and target map. It shows only the active directional zone, helping keep the chart clean and focused. When the selected leg projects downward, the indicator displays the active sell

バージョン 2 の新機能: - チャート上のコントロールパネル:全機能をワンクリックで切替、ドラッグで自由に移動可能、位置は自動保存 - 期間ごとのローソク足本数:日足・週足・月足・年足を個別に 1..N 本表示( 1= 現在、 2= 現在 + 直近、 … ) - 新しい配色方式:期間ごとに 1 色 — 陽線は明るい色調、陰線は同じ色の暗い色調 - チャート上のカラーパレット:設定画面を開かずワンクリックで各期間の色を変更 - 期間ごとの FILL ボタン:実体を強く塗り潰し、方向を透明度で表現(陽線 60% 透過、陰線 40% 透過) - ラベルのフォントサイズをパネルから直接調整可能 - CANDLES ボタン:チャート自身のローソク足を非表示 / 表示;元のチャートモードは必ず復元されます - ピクセル単位の正確な整列:ビッグキャンドルがチャートのバーに正確に一致(週末・セッションギャップによるずれを修正) - パネルの全設定(状態・本数・色・位置)は時間足変更や端末再起動後も保持されます

Crypto_Forex インジケーター「ダイナミック売られ過ぎ/買われ過ぎゾーンを備えた DeMarker」MT4 用。再描画なし。 - DeMarker オシレーター曲線は、インジケーター計算期間中の以前の高値と安値に対する現在の価格位置を示します。 - ダイナミック買われ過ぎゾーンから売りエントリーを行い、ダイナミック売られ過ぎゾーンから買いエントリーを行うのに最適です。 - このインジケーターは、プライスアクションエントリーと組み合わせるのにも最適です。 - ダイナミック買われ過ぎゾーン - 黄色の線より上。 - ダイナミック売られ過ぎゾーン - 緑の線より下。 - DeMarker 自体は、他のオシレーターの中で最も効率的な定期的なダイバージェンス信号を提供します。 - PC およびモバイルアラート付き。 Click here to see high quality Trading Robots and Indicators! これは、この MQL5 ウェブサイトでのみ提供されるオリジナル製品です。

Crypto_Forex MT4用インジケーター Heiken Ashi Histo Filter は、優れた効率的な補助取引ツールです!再描画不要! - 高度な新しい計算方法を採用 - パラメーター「計算価格」には10種類のオプションがあります。 - プライスアクションパターンとの組み合わせに最適: - 緑色のヒストグラム - 強気の買いパターンを探します。 - マゼンタ色のヒストグラム - 弱気の売りパターンを探します。 - このインジケーターを使用すれば、標準的な戦略であってもアップグレードできる機会が豊富にあります。 - モバイル、PC、メールアラート機能を搭載しています。 Click here to see high quality Trading Robots and Indicators! これは、このMQL5ウェブサイトでのみ提供されるオリジナル製品です。

Part of the Shved Market Analysis System (SMAS).
Identifies areas of maximum Supply and Demand zone density and confluence, providing deeper market insight as part of the integrated SMAS ecosystem.
Shved Supply and Demand Cluster Profile is a revolutionary, high-performance visualization tool designed to map market volume density and supply/demand zone clusters, created by a professional trader for traders.
The Shved Supply and Demand Cluster Profile is a core component and the analytical h

Divergence Matrix Pro for MetaTrader 4 Divergence Matrix Pro is a confirmed multi-oscillator divergence indicator for MetaTrader 4. It detects regular and hidden divergence between price and selected oscillators, then presents the confirmed structure through divergence lines, pivot labels, action markers, an optional current-timeframe Matrix Panel and optional alerts. The indicator is an analysis and confirmation tool. It does not open or close trades, and the signal score is not a win rate or a

Read detailed blogpost here: https://www.mql5.com/en/blogs/post/772233
Features at a Glance Linear regression center line with statistically accurate curved deviation bands Three band calculation modes: RMA of High-Low Range, Standard Deviation, and True ATR Candle coloring in two modes: Heatmap (position inside the bands) and Volume-Weighted Colored Bars (VWCB) Straight regression channel (Channel 1) with up to 3 deviation levels Future projection channel (Channel 2) with optional Higher Timef

Gold Swing Break Target Map is a MetaTrader 4 indicator designed to display projected target levels after a confirmed swing high or swing low is broken. The indicator is intended to help traders answer a common chart question: If price breaks this swing high, where could it continue upward? If price breaks this swing low, where could it continue downward? The tool does not open, close, or manage trades. It is designed for chart analysis and discretionary trading decisions. Main Purpose Gold Swin

概要 Candle Timer Countdown Pro for MT4 は、MetaTrader 4 向けのローソク足クローズ・カウントダウンインジケーターです。現在のローソク足が閉じるまでの残り時間をチャート上に表示し、円形の進捗アークと組み合わせることで、ローソク足が今どの段階にあるかを一目で把握できます。 新しい tick が届いたときだけ更新される一般的なカウントダウンインジケーターとは異なり、このインジケーターはサーバー時間のアンカーとローカル時計による補間を使用します。tick が少ない場面でも安定したカウントダウン表示を維持し、停止、急なジャンプ、時間のずれを抑えます。 M1 チャートで短期売買を行う場合でも、H1、H4、D1 チャートでトレンドやローソク足パターンを確認する場合でも、現在のローソク足がいつ閉じるかを正確に把握することは、エントリータイミングの改善、終値ベースの形状確認、早すぎる判断の回避に役立ちます。 このタイマーが異なる理由 多くの MT4 カウントダウンインジケーターは主に TimeCurrent() に依存しています。MetaTrader 4

Hull Suite — Responsive Trend Engine for MT4 (figure 1) Overview **Hull Suite** brings the famous **Hull Moving Average** — created by Alan Hull in 2005 — to MetaTrader 5 in a single, flexible, ready-to-trade package. The Hull Moving Average is prized for one reason: it is **extremely responsive yet remarkably smooth**. It hugs price closely, cuts lag to a minimum, and still delivers clean, readable curves — exactly what a discretionary or systematic trader needs to read trend direction at a gl

Indo Scalper Multi TF Multi Pair Indo Scalper Multi TF Multi Pair is a powerful trading indicator designed to help traders identify trend direction and high-probability entry opportunities using Multi-Timeframe (MTF) confirmation . Built for multiple currency pairs, it is ideal for both scalping and intraday trading. Features Multi-Timeframe (MTF) Trend Confirmation Supports Multiple Currency Pairs Helps Identify Trend and Market Momentum Suitable for Scalping & Intraday Trading Clean,

OSB Pro Oscillator は、高度なカスタムインジケーターであり、効率的なプライスアクション補助ツールです。 - 高度な新しい計算方法を採用しています。 - 新世代のオシレーター - 使い方は画像をご覧ください。 - OSB Pro Oscillatorは、プライスアクションと売られ過ぎ/買われ過ぎのトレンドシグナルの正確なエントリーポイントを見つけるための補助ツールです。 - 売られ過ぎの値:30未満。 - 買われ過ぎの値:70以上。 - このインジケーターを使用すれば、標準的な戦略であってもアップグレードする機会が数多くあります。 - 標準的なオシレーターよりもはるかに高速で正確です。 - インジケーターには情報ディスプレイがあり、インジケーターが接続されている通貨ペアの現在のスプレッドとスワップが表示されます。 - 情報ディスプレイには、口座残高、エクイティ、マージンも表示されます。 - 情報ディスプレイはチャートの任意の場所に配置できます。 使用方法: - プライスアクションフィルターとして(画像参照)。 - 主要トレンド方向へのエントリーシグナルとして(画像参照

Crypto_Forex MT4用インジケーター「 シューティングスターパターン 」。リペイントなし、遅延なし。 - インジケーター「シューティングスターパターン」は、プライスアクショントレードにおいて非常に強力なインジケーターです。 - インジケーターはチャート上で弱気なシューティングスターパターンを検出します。チャート上に赤い矢印シグナルが表示されます(画像参照)。 - PC、モバイル、メールアラート機能付き。 - インジケーター「シューティングスターパターン」は、サポートレベル/レジスタンスレベルと組み合わせるのに最適です。 - 下降トレンドまたは横ばいの市場状況でこのインジケーターを使用するのが最適です。 Click here to see high quality Trading Robots and Indicators! これはMQL5ウェブサイトでのみ提供されるオリジナル製品です。

MT4用 Ultimate AIO ICT Concept Indicator: Smart Money Concepts を自動的にマスターする 毎日何時間も手作業でチャートを分析することに疲れていませんか? AIO ICT Concept インジケーターは、Smart Money Concepts をマスターするための完全なオールインワンソリューションです。手動によるテクニカル分析の推測や感情的な疲労を排除するように設計されたこの強力なアルゴリズムツールは、最も重要なプライスアクション要素をチャート上に直接、自動的にマッピングします。 市場の方向性と上位足のバイアスをマスターする (Master Market Direction and High Timeframe Bias): 市場がどこに向かっているかを知ることは、戦いの半分です。当社の高度な Market Structure マッピングと Change in State of Delivery (CISD) の検出により、真の市場トレンドを即座に特定できます。日次および週次の方向性のバイアスを一目で簡単に判断できます。スイン

The Ultimate Market Structure Indicator: Essential Tape Reading Tool for All Traders(究極の市場構造インジケーター:すべてのトレーダーに必須のテープリーディングツール) 市場の方向性を推測するのをやめ、絶対的な確信を持ってトレードを始めましょう。 Market Structure Indicator は、MetaTraderチャート上で値動きの真のリズムをマッピングするために綿密に設計されたプロ仕様のチャートツールです。 このツールには、 スマートマネーコンセプト(SMC) や インナーサークルトレーダー(ICT) の手法で普及した用語が含まれていますが、 このインジケーターはSMCやICTトレーダー専用のものではありません。 市場構造は金融市場の共通言語です。クラシックなプライアクション・トレーダー、スイングトレーダー、スキャルパーのいずれであっても、 テープリーディング(板読み・値動きの読解) をマスターするには、構造的な高値と安値についての深い理解が必要です。このインジケーターは自動テープリーディ

Pattern Builder — MetaTrader 4 用カスタムスイングパターンスキャナー Pattern Builder は、任意のカスタムスイングパターンを手描きで作成し、複数の時間足にわたって Market Watch 内のすべての銘柄から統計的に類似した値動きの形状をスキャンできる MetaTrader 4 用インジケーター兼マーケットスキャナーです。ヘッドアンドショルダー、トライアングル、フラッグなど固定形状に限定される従来のチャートパターンインジケーターとは異なり、この MT4 パターン認識ツールでは独自のプライスアクションパターンを自由に定義でき(スイングポイント数・形状ともに任意)、Dynamic Time Warping(DTW)や Procrustes 解析を含む 11 項目の重み付け類似度エンジンによりリアルタイムで一致する形状を検出します。 主な機能: XYグリッド上のインタラクティブなパターン描画ボード、ピクセル単位でのスイングポイント配置 多指標類似度エンジン:形状、角度シーケンス、傾き、リトレースメント、エクステンション、スイング比率、縦横比、トレ

Quantum Trend Ribbon Quantum Trend Ribbon is a premium trend-following indicator designed to help traders identify market direction with confidence. By combining an adaptive moving average with a dynamic trend ribbon, it filters out market noise and highlights the dominant trend, allowing you to focus on high-probability trading opportunities. The clean and intuitive interface makes it easy to understand market conditions at a glance without cluttering your chart. Key Features Adaptive Trend De

BALOGUN SMC ELITE — Professional Smart Money Concepts Indicator
KEY FEATURES: Strict BUY/SELL Alternation — Only 1 BUY followed by 1 SELL (no signal spam) Non-Repainting Signals — Signals confirmed on closed bars only Zone-Limited NO TRADE Markers — Clear visual zones showing when NOT to trade Multi-Factor Confluence Scoring — 0-100% quality score per setup Professional Dashboard — Real-time trend, confluence, and signal status Multi-Channel Alerts — Popup, Push, Email, and S

Crypto_Forexインジケーター「 CCI FLAT Detector 」は、取引における効率的な補助ツールです!リペイント不要。 このMT4対応の優れたインジケーターで、あなたの取引手法をアップグレードしましょう。 - このインジケーターは、チャート上の価格がフラットな領域を表示します。「フラット感度」パラメータを搭載しており、フラットな領域を検知します。 - 「CCI FLAT Detector」は、プライスアクションエントリーの確認や、他のインジケーターと組み合わせて使用できます。 - トレンドフォローシステムでフラットゾーンを検出し、そこでの取引を回避するために使用できます。 - リバーサルスキャルピング(フラットな境界からの反転取引)にも使用できます。 - 標準的なCCIオシレーターの代わりに「CCI FLAT Detector」を使用する機会は数多くあります。 - Commodity_Channel_Index (CCI)は、現在の価格と過去の平均価格の差を測定します。 - +200以上のゾーンで売りエントリー、-200以下のゾーンで買いエントリーを行うのに最適です

Crypto_Forex インジケーター「MA スピード」、MT4 用、リペイントなし。 移動平均のスピードは、ユニークなトレンド インジケーターです。 - このインジケーターの計算は、物理学の方程式に基づいています。 - スピードは、移動平均の 1 次導関数です。 - MA スピード インジケーターは、MA 自体が方向を変える速度を示します。 - MA スピードを使用して、標準戦略でもアップグレードする機会がたくさんあります。SMA、EMA、SMMA、LWMA に適しています。 - トレンド戦略では、MA スピードを使用することをお勧めします。インジケーターの値が < 0 の場合: トレンドが下降し、インジケーターの値が > 0 の場合: トレンドが上昇します。 - 時間枠 - 任意。取引ペア - 任意。 - インジケーターには、モバイルおよび PC アラートが組み込まれています。 パラメーター (設定は非常に簡単です): 1) スピードの期間。推奨値は 3 ~ 7 です。スピードの期間が低いほどインジケーターの感度が高まり、その逆も同様です。 2) MA の期間 (この MA の
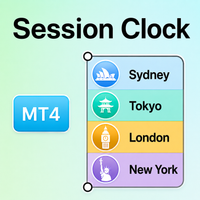
Session Clock MT4 Know Which Forex Session Is Active – Without Manual Time Calculations Session Clock MT4 is a clean trading-time dashboard for MetaTrader 4. It displays the four major Forex market sessions – Sydney, Tokyo, London, and New York – together with their opening times, closing times, live status, and the countdown to the next session. Forex market activity changes throughout the day. Some periods are quiet, while others bring faster price movement and higher volatility. Session Clock

Smart Moves Binary Indicator for MT4 Overview Smart Moves Binary Indicator is a technical analysis indicator for MetaTrader 4 (MT4) designed to help traders identify potential BUY and SELL opportunities after candle confirmation. Signals are generated only after the current candle has closed, ensuring that confirmed arrows remain fixed on historical bars without recalculation. The indicator is suitable for any Forex currency pair and supports multiple timeframes, making it adaptable to differen

Multi-Timeframe Anchored VWAP Indicator (Custom Period & Standard Deviation Channels) — Technical Description Overview
This indicator extends the traditional VWAP with multi-timeframe anchoring, session reset, and standard deviation channels, providing a dynamic "fair value" reference area. All calculations are based on currently visible price and volume data; the indicator contains no future functions, does not repaint, and does not drift. Core Features Multi-Timeframe Anchoring Automatically

このコードは、MetaTrader 4 (MQL4) 向けに開発された Smart Money Concepts (SMC) のインジケーター(構造分析エンジン&多通貨監視ダッシュボード) です。市場の構造変化(ブレイク)を自動で検知し、大口注文の痕跡である機関投資家ゾーンをチャート上に描写しながら、バックグラウンドで複数通貨ペアの市場状況を同時にスキャンします。 このインジケーターの機能とシグナルの読み方を分かりやすく解説します。 1. コア・アーキテクチャ:市場構造の計算エンジン このコードは、Smart Money Concepts の主要な3つの要素を自動化しています。 スイング・ハイ/ロー(構造の起点): SwingPeriod (デフォルトは5本)で指定された本数分のK線が、左右のK線よりも高値(または安値)であるかを判定し、有効な反転ポイント(山と谷)を割り出します。 BOS (Break of Structure - 構造の破壊): 実体の 終値 が、過去に確定したスイングポイントを完全に更新すると、チャート上に点線を引き、 「Bullish BOS(上昇の構造ブレイ

HARMONIC STRATEGY SUITE PRO MT5 Harmonic Strategy Suite Pro は、MT5専用に設計されたプロフェッショナルなハーモニックパターン検出インジケーターおよび検証(バックテスト)ダッシュボードです。単にラインを引くだけの一般的なインジケーターとは異なり、本ツールはチャート上に検証エンジンを内蔵しており、目標確率の算出、および視認性を極限まで高めるためのレイアウト自動最適化を行います。 主な機能と特徴 インタラクティブな可動式パネル: 各パターンごとに過去最大100回の履歴から統計データ(エントリー到達率、T1/T2勝率、平均/合計収益率)をリアルタイムで追跡・算出します。 チャート上での一発非表示 (ON/OFF)機能: ダッシュボード上のON/OFFボタンをクリックするだけで、該当パターンの描画を非表示にできます。バックグラウンドでのバックテスト統計計算は継続されます。 厳格な指値注文バックテスト: 実際のトレードをシミュレートします。パターン確定後にD点へ指値注文 (Limit Order)を配置。もし価格が指値に

Ichimoku Strength Meter MT4 is a professional multi-timeframe indicator for MetaTrader 5 that combines currency strength, pair recommendations, Ichimoku trend direction and moving average bias in a clear dashboard. The indicator analyzes the 8 most important currencies: USD, EUR, GBP, JPY, CHF, AUD, CAD and NZD From this, all 28 major currency pairs are automatically calculated and evaluated according to strength, trend direction and signal quality. Main functions Multi-timeframe currency stre

Trend Scanner Dashboard Matrix is an advanced, ultra-optimized matrix panel for MetaTrader 4 designed for trend and institutional traders who need to monitor multiple financial instruments and timeframes simultaneously from a single screen. Stop clogging your platform with dozens of open charts. This dashboard analyzes market flow correlation in real-time and alerts you the exact moment an asset enters a strong trend or a correction phase. Key Features Real-Time Trend Matrix: Dynamically

VWAP Volume Price Customized Cycle FX-AIEA — Multi-Timeframe Anchored VWAP Indicator (Technical Features & Parameter Discussion) Overview This indicator extends the traditional VWAP (Volume Weighted Average Price) with multi-timeframe anchoring and customizable session reset mechanisms, aiming to provide a dynamic "fair value" reference area. The indicator constructs symmetric volatility boundaries via triple standard deviation channels (±1σ/±2σ/±3σ), which can serve as reference dynamic support

Quiet Confluence is a multi-factor technical analysis indicator for MT4. It combines Bollinger Band trend context, breakout scoring, MACD divergence, volatility states, and support and resistance information in one chart workspace. It is designed for traders who want to review several aspects of market conditions without switching between multiple indicators.
Key features:
- Displays Bollinger upper and lower bands with a direction-sensitive middle band. - Calculates breakout scores from pric

Bollinger Insight is a tick-volume price distribution tool for MT4. It displays a volume profile, point of control, value area, and low-volume regions directly on the main chart, helping users examine where market activity was concentrated within the selected range.
Key features:
- Builds a Tick Volume Profile across configurable price rows. - Displays the point of control and supports a developing POC mode. - Calculates VAH and VAL with an adjustable value-area ratio. - Detects low-volume no

Market Structure Toolkit identifies and annotates price structure, structural breaks, character changes, swing points, and supply and demand regions on MT4 charts. It brings commonly used market-structure tools into one configurable indicator.
Key features:
- Supports external and internal structure modes. - Marks BoS and CHoCH, with optional CHoT and liquidity-sweep lines. - Detects bullish and bearish order blocks, supply zones, and demand zones. - Can remove invalidated zones or retain and

Squeeze Momentum compares Bollinger Bands with the Keltner Channel to identify volatility compression and release, while a color-coded histogram displays momentum direction and change. It is intended for reviewing low-volatility phases and subsequent volatility expansion.
Key features:
- Identifies no-squeeze, squeeze-on, and squeeze-released states. - Uses four histogram states for rising bullish, fading bullish, strengthening bearish, and fading bearish momentum. - Provides adjustable Bolli

MQL5ブログ: https://www.mql5.com/en/blogs/post/772494 MT4版: https://www.mql5.com/en/market/product/185408 MT5版: https://www.mql5.com/en/market/product/185407
RSI HEATMAP [tambangEA]は、相対力指数(RSI)、RSIシグナルライン、確定済みクロスオーバーロジック、動的なサポート/レジスタンスレベル、リアルタイムの市場情報、そして高速な複数銘柄チャートナビゲーションを組み合わせた、プロフェッショナルなモメンタムおよび市場構造分析インジケーターです。
このインジケーターは、トレーダーがモメンタムの方向性を把握し、重要な反応レベルを特定し、ボラティリティと取引コストを監視し、チャートを手動で再オープンすることなく選択した銘柄間を迅速に切り替えられるように設計されています。
FX、金、指数、商品など、MetaTraderでサポートされているあらゆる金融商品に適しています。
主な機能 SMAベースのシグナルラインを備

//+---------------------------------------------------------------------------------------------------------------------------- //+----------------------------------------------------------------------------------------------------------------------------
支撑阻力指标.无漂移.参考波浪理论构建. 设计参数: 初始显示K线数:参数为自定义历史K线起点.参数为1000表示从当前K起前1000根K线起算. 周期数:过滤连续上涨或下跌的周期间隔.即:此周期内再次突破视为继续前述趋势,不计入新的波浪极值点. 突破至少M点:此参数限制新高(低)须比前高(低)突破至少此点数,才视为有效突破. //+----------------------------------------------------------------------------

Session Volume Profile SMC は、価格がどこへ動いたかだけでなく、市場が実際にどこで取引したのかを示します。セッションごと(日・週・月)に、横方向のボリュームプロファイルをチャート上に直接構築し、最も活動が集まり、その後も価格が尊重しやすい価格水準を明らかにします。
多くのチャートは価格しか表示しません。Volume Profile は欠けていた次元、すなわち 各価格でどれだけ取引されたか を加えます。本インジケーターはそれをセッション単位の分かりやすい読み取りに変え、その上に Smart Money Concepts(SMC)のマーケットストラクチャーの視点を重ね、ボリュームとストラクチャーを一つのツールで把握できるようにします。
描画する内容
各セッションについて、 POC (Point of Control=最も取引された価格)、 VAH と VAL (バリューエリアの上限・下限)、そしてセッションの大半のボリュームを含む網掛けの バリューエリア を伴う完全なボリュームプロファイルを描画します。セッション確定後、その POC・VAH・VAL は次のセ

4‑Bar Breakout Indicator — MT4 The 4‑Bar Breakout Indicator is a clean, mechanical, non‑repainting tool designed to highlight potential turning points and continuation signals based on a simple four‑candle pattern. It works on any timeframe and any symbol, providing clear visual arrows and dots whenever a breakout condition is met. This indicator is intentionally simple: no filters, no smoothing, no repainting, no lagging logic. Just pure price action — the same way discretionary traders have us

UT Bot Alerts — ATR Trailing Stop Buy/Sell Signals Overview UT Bot Alerts is a trend-following signal indicator built on the popular ATR Trailing Stop method. It automatically detects when price breaks through the trailing stop level and prints clear Buy / Sell arrows directly on your chart, backed by a complete real-time alert system . Whether you are a scalper or a swing trader, UT Bot Alerts helps you catch entries the moment the trend shifts — without staring at the screen all da

Spartan: T rend, Reversals and Exhaustions Indicator I believe trading must be made easy. Spartan is a premium indicator designed to identify the direction of price movements and reversal and exhaustion point. I know it is hard to find quality indicators. Spartan is free from repainting. To cut noise, it layers optional filters on top of the core RSI logic. ATR can require minimum volatility before a signal is allowed, or adjust how far arrows sit from the candle. ADX can block signals in flat,

SSL Hybrid — Complete NNFX Baseline, Trend & Exit System **Baseline, confirmation, continuation and exit — the four pillars of a rules-based trend system, in one indicator.** SSL Hybrid is the MetaTrader port of one of the most popular NNFX (No Nonsense Forex) tools on TradingView. It combines a configurable **baseline** with a volatility channel, the classic **SSL trend line**, an **SSL2 continuation signal** filtered by ATR, and a fast **exit line** that prints unambiguous exit arrows — plus

Shved Structure Engine Part of the Shved Market Analysis System (SMAS) Shved Structure Engine is a professional market structure analysis module designed to automatically build dynamic market channels based on Supply & Demand technology. Unlike traditional channel indicators that rely on moving averages, regression lines, or price extremes, Structure Engine analyzes market structure and automatically generates adaptive channels that reflect changing market conditions. Using proprietary

Nova Multi Timeframe Ema Scanner Pro は、MetaTrader 4 向けのプロフェッショナルな市場スキャナー兼トレードプランニング用インジケーターです。複数のチャートを頻繁に切り替える手間を減らし、マルチタイムフレームのトレンド分析を1つのダッシュボードに整理することを目的としています。 このインジケーターは、Market Watch に表示されている対象銘柄をスキャンし、3つの時間足における設定可能な高速・中速・低速 EMA 構造を分析します。条件を満たしたセットアップはフィルタリングおよび順位付けされ、シグナル強度、品質、高時間足の整合性、リスクリワード比、プランスコア、シグナル経過時間などの情報とともに表示されます。 内蔵の高時間足ターゲットエンジンは、実用的なスイング目標レベルを探索し、T1、T2、T3 の構造化されたターゲットプランを作成できます。さらに、エントリー基準、無効化レベル、ターゲットゾーンも表示できます。 主な機能: マルチタイムフレーム EMA コンフルエンススキャン Market Watch の複数銘柄分析 Fast、Mi

Support Resistance Channels (SRchannel) **Automatic, self-adjusting support & resistance zones — ranked by real strength, with break alerts straight to your phone.** Most S/R tools draw a thin line at every swing and leave you to guess which one matters. **SRchannel** does the opposite: it finds the pivot points, groups the ones that cluster together into a **zone (channel)**, scores each zone by how many pivots and price touches it holds, and then shows only the **strongest** ones. The colors

Chandelier Exit / Stop — ATR Stop-and-Reverse Trend Filter **Know where the trend ends before it turns against you.** Chandelier Exit is a classic volatility-based trailing stop that hangs off the highest high (in an uptrend) or the lowest low (in a downtrend) by a multiple of Average True Range. It plots a clean stop-and-reverse line that follows price as long as the trend holds — and flips the moment price closes through it. The current trend is highlighted right on the chart, and every flip

Asymmetric Swing Intelligence System: A Nonlinear Market State Classification Algorithm
Is Your System Getting Stopped Out in a Dead Flat? ▷ This is the ultimate challenge for automated trading systems. During prolonged sideways consolidation, standard algorithms react linearly to every tick, chasing the price and opening a flood of false trades inside market noise. It is time to upgrade your market analysis to rigid, discrete logic. KPTF Technology: Physics Against Chaos ▷ The ASI prod

KT Opening Gaps インジケーターは、チャート上に New Week Opening Gaps と New Day Opening Gaps を描画し、それぞれの CE 中央値を表示します。さらに、価格がそのギャップに触れたか、完全に埋めたかを追跡し、現在表示している銘柄で過去のギャップがどのように推移したかもレポートします。 各ギャップは、任意で表示できる境界線付きのシェードゾーンとして描かれ、50% 水準には点線の CE ラインが表示されます。ラベルには、ギャップの種類、日付、ポイント単位のサイズ、CE 価格が表示されます。週足ベースのギャップと日足ベースのギャップには別々の色を使用し、上方向のギャップと下方向のギャップも色分けされます。
統計パネル
オープニングギャップの動きは、すべての銘柄で同じではありません。そのため、このインジケーターは思い込みで判断するのではなく、実際の履歴データをもとに測定します。読み込み時にチャート履歴をスキャンし、その銘柄で過去に発生したオープニングギャップを検出して、それぞれの後に価格がどう動いたかを記録します。 週のギャップについ

Interactive Structure Dashboard(SMC Engine) Interactive Structure Dashboard は、機関投資家レベルの Market Structure(市場構造) と Smart Money Concepts(SMC) を自動分析するために開発された高度なインジケーターです。リアルタイムで流動性の変化と注文フローを追跡し、市場ノイズを排除することで、高確率なエントリーポイントを明確に可視化します。 ライブ対応のマルチ通貨ダッシュボードとアルゴリズムによるゾーン反応監視機能を搭載しており、 1つのチャートから6つの時間足 にわたって複数の通貨ペアを同時に監視できます。 主な機能 アルゴリズムによるスイング検出エンジン 厳密なマルチバー・フラクタルフィルターを使用し、本物の市場構造の高値・安値を自動検出します。手動でラインを描画する必要がなく、分析ミスを大幅に削減します。 BOS(Break of Structure)の自動描画 Break of Structure(BOS) を自動的に検出し、正確な水平ラインとして表示・追跡します

プロフェッショナル RSI MTF 通貨強弱 Dashboard システム(MT4) 1. 通貨強弱エンジン 単一の通貨は単独で取引することはできません。必ず通貨ペアとして取引されます。 そのため、本システムでは主要8通貨から構成される28通貨ペアを分析し、各通貨の絶対的な強さを計算します。 対象通貨: USD - 米ドル
EUR - ユーロ
GBP - 英ポンド
JPY - 日本円
AUD - 豪ドル
CAD - カナダドル
CHF - スイスフラン
NZD - ニュージーランドドル 本インジケーターは RSI(相対力指数)を基本計算に使用します。 RSIは0〜100の範囲で正規化されているため、EUR/USDやUSD/JPYなど価格スケールが異なる通貨ペアでも公平に比較できます。 通貨強度計算方式 通貨がベース通貨の場合 例: EUR/USD 計算: Strength = RSI(EUR/USD) 通貨がクォート通貨の場合 例: EUR/USD の USD 計算: Strength = 100 - RSI(EUR/USD) 最終的な通貨強度: Currency Strength =

Unique Professional 8 Snipe r is a multi-timeframe indicator that combines 8 different technical conditions to generate high probability BUY/SELL signal set ups and gives high probability precise entries. It's a non-repaint indicator with 8 confirmations and then a precise entry when all conditions are met. Alerts and Push Notifications with Entry ,Tp and Sl MT 4 and MT5 Direct EA is free along with the purchase of indicator Limited offer for few users only till 30th of September
Best Fo

Smart Divergence Finder Indicator In-depth Analysis: A Practical Guide to Trend, Divergence, and Resonance Indicator Introduction Smart Divergence Finder is an intelligent main-chart comprehensive indicator designed for MT4/MT5 platforms. It overcomes the fragmented limitations of traditional sub-chart divergence analysis by integrating: Trend determination Multi-indicator divergence detection Intelligent signal filtering
All key trading signals are displayed directly on the price chart. Its co

Balanced Price Range (BPR) Pro Indicator - Master ICT Concepts(バランス・プライス・レンジ(BPR)プロ・インジケーター - ICTコンセプトをマスターする) 重なり合うフェアバリューギャップ(FVG)を探して目を疲れさせるのはもうやめましょう。 Balanced Price Range (BPR) Pro インジケーターを使用して、インナーサークルトレーダー(ICT)手法における最も爆発的なプライスアクションのシグネチャーをマスターしてください。本格的なトレーダー向けに設計されたこのツールは、市場で最も確率の高いセットアップの1つの検出を自動化し、アルゴリズムの精度をチャートに直接もたらします。 ICTにおけるバランス・プライス・レンジ(BPR)の力 ICT手法において、Balanced Price Rangeは単なる通常のギャップではありません。アグレッシブな買いサイドのデリバリー(BISI)とアグレッシブな売りサイドのデリバリー(SIBI)が完全に重なり合う、非常に特殊で高確率なゾーンです。 インターバンク価格デリバリ

AURORA AUTO FIBONACCI — GOLD EDITION
Automatic Fibonacci levels + optional Bollinger Bands
Draws the Fibonacci retracements fully automatically
Detects the swing high and swing low on its own
Golden Pocket (0.618–0.65) highlighted as a zone
Optional Bollinger Bands – switch off when not needed
Clean, calm, no chart clutter
Works on any instrument and any timeframe
Aurora Auto Fibonacci takes the manual drawing off your hands. Theindicator finds the most recent relevant swing high a

Black Horse Finder Indicator In-depth Analysis: A Practical Guide to Trend, Support/Resistance, and Multi-Signal Trading Indicator Introduction Black Horse Finder is a comprehensive main-chart indicator designed specifically for the MT4 platform. Originating from the classic TongDaXin composite main chart logic, it breaks through the limitations of single moving averages or isolated indicators. It highly integrates trend determination, dynamic support/resistance levels, multiple buy signals (su

Why load 23 indicators when you can have them all in one interactive, clickable dashboard? Stop cluttering your charts with tangled lines and confusing histograms. Trading is about clarity and fast decision-making, not chaos. This advanced dashboard condenses 23 of the most powerful technical indicators into a single, sleek, and highly optimized panel. Get instant, real-time market analysis at a glance without sacrificing your chart space. Key Features The "Single Verdict" Engine: The dashboa

Wave Structure Pulse is a professional MetaTrader 4 indicator designed to identify high-quality trading zones with clearly defined entry, stop-loss, and profit targets. The indicator focuses on selecting precise areas where price may begin a strong directional movement. Its purpose is to help traders enter from better locations, avoid late entries, and follow a clear trading plan directly on the chart. Accurate Trading Zones Wave Structure Pulse identifies carefully selected Buy and Sell zones i

ICT OTE Scanner Pro (MT4) Smart Money Swing Detection + Optimal Trade Entry Zones — With a Built-In Signal Strength Score Stop Guessing Where "Smart Money" Will Enter. Start Measuring It. Every ICT trader knows the theory: find the swing, wait for the retracement into the 62%–79% Optimal Trade Entry (OTE) zone, and enter with the trend. The problem is execution — manually marking swings on every pair, every timeframe, is slow, subjective, and inconsistent. ICT OTE Scanner Pro automates the en
MetaTraderマーケットは、履歴データを使ったテストと最適化のための無料のデモ自動売買ロボットをダウンロードできる唯一のストアです。
アプリ概要と他のカスタマーからのレビューをご覧になり、ターミナルにダウンロードし、購入する前に自動売買ロボットをテストしてください。完全に無料でアプリをテストできるのはMetaTraderマーケットだけです。

取引の機会を逃しています。
- 無料取引アプリ
- 8千を超えるシグナルをコピー
- 金融ニュースで金融マーケットを探索