Market Structure Toolkit

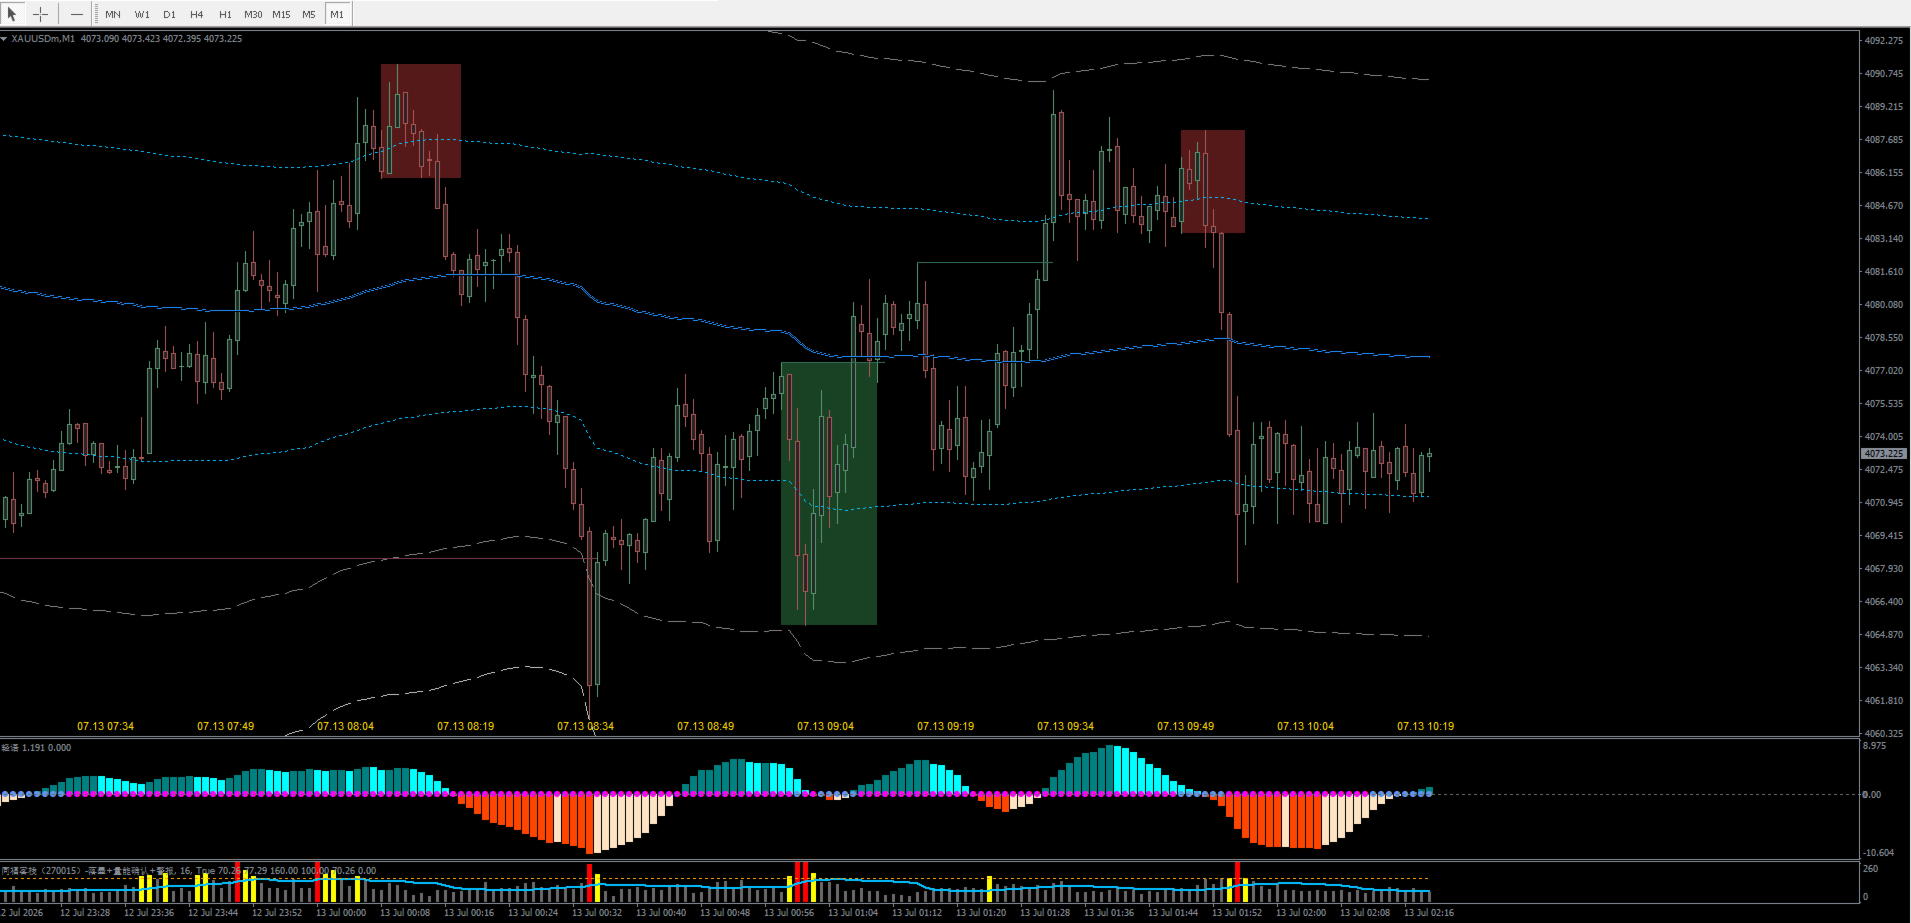
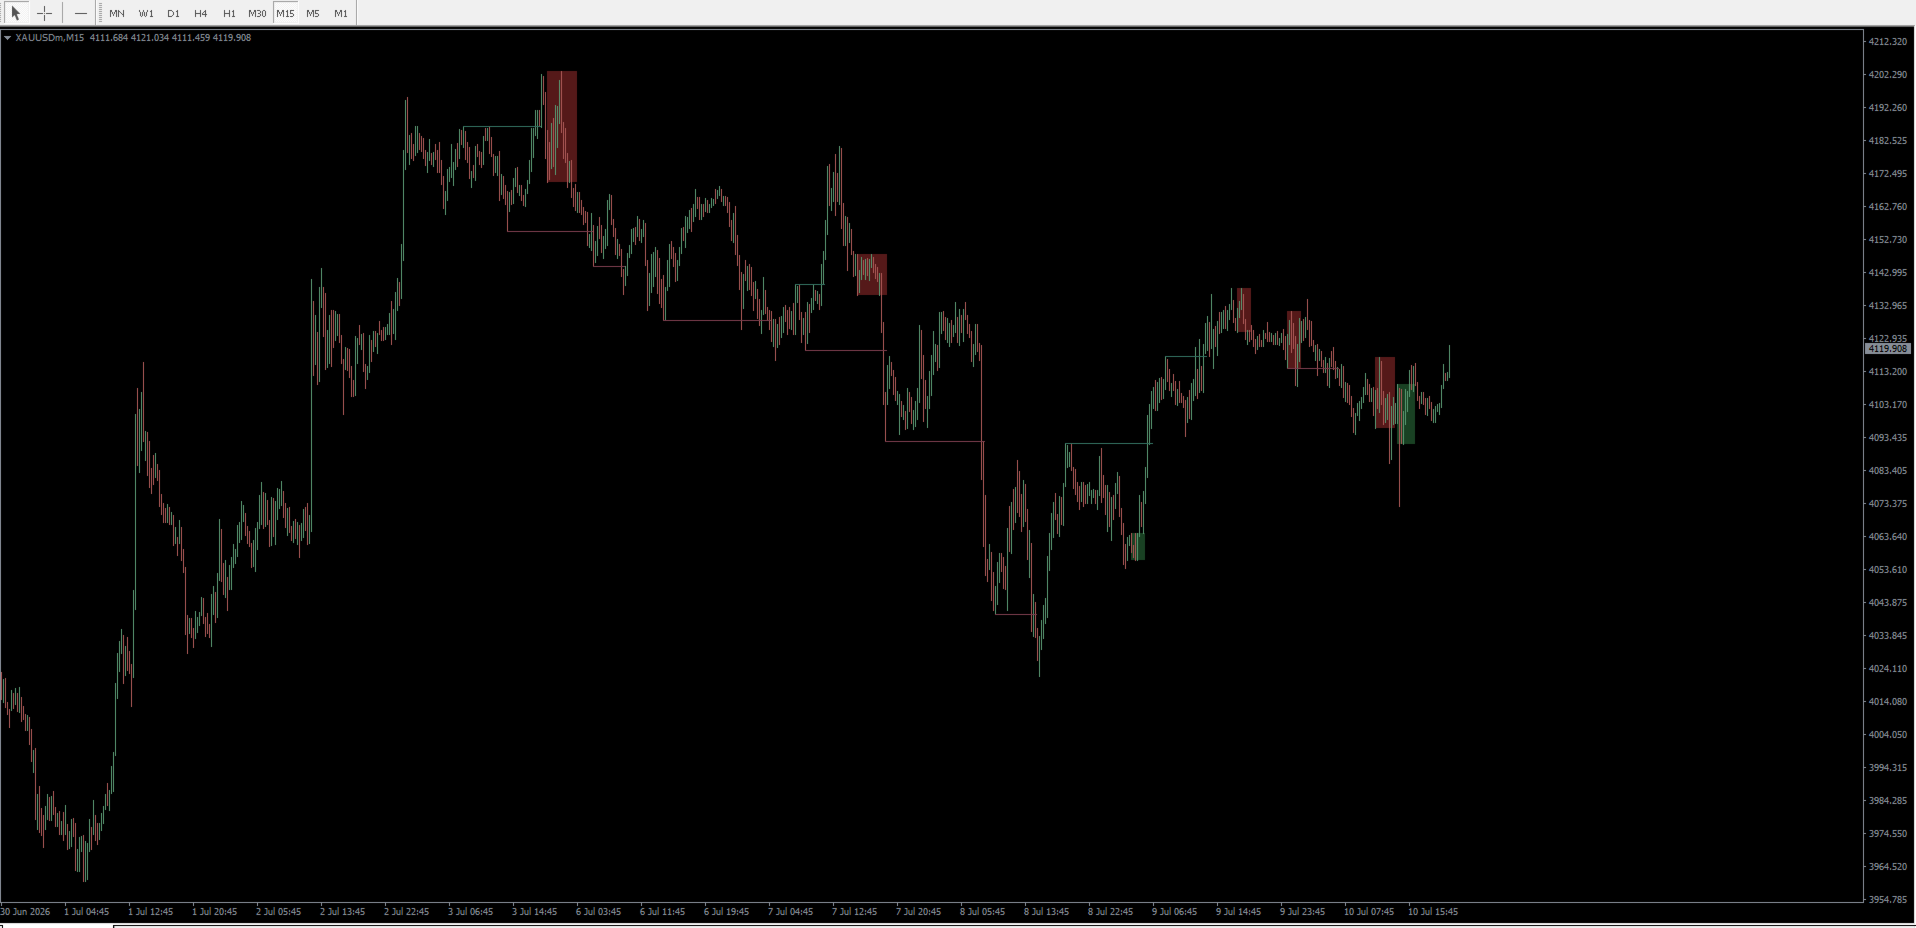
Market Structure Toolkit 用于在 MT4 图表上识别和标注价格结构、结构突破、市场特征变化、摆动点以及供需区域。它将常用的市场结构观察工具集中在一个可配置指标中。

主要功能:

- 支持外部结构和内部结构分析模式。
- 标记 BoS、CHoCH,并可选择显示 CHoT 与流动性扫盘线。
- 识别看涨和看跌订单块、供应区及需求区。
- 可删除已失效区域,或保留、弱化已经缓解的区域。
- 可选 ZigZag、HH、HL、LH、LL 摆动标签及内部变化箭头。
- 支持当前周期或指定信号周期。
- 提供供需、摆动高低点、结构突破和市场变化提醒。
- 可限制历史计算 K 线和图表对象数量,以控制图表负载。

市场结构会随着新价格数据和摆动确认而发展,尚未确认的结构可能发生变化。本工具用于辅助图表分析,不提供自动交易或结果保证。

---
推荐产品
The indicator detects and displays М. Gartley's Butterfly pattern. The pattern is plotted by the extreme values of the ZigZag indicator (included in the resources, no need to install). After detecting the pattern, the indicator notifies of that by the pop-up window, a mobile notification and an email. The pattern and wave parameters are displayed on the screenshots. The default parameters are used for demonstration purposes only in order to increase the amount of detected patterns. Parameters z
Overview Harmonic Patterns MT4 is a technical analysis indicator designed for the MetaTrader 5 platform. It identifies and displays harmonic price patterns, such as Butterfly, Cypher, Crab, Bat, Shark, and Gartley, in both bullish and bearish directions. The indicator calculates key price levels, including entry, stop loss, and three take-profit levels, to assist traders in analyzing market movements. Visual elements and customizable alerts enhance usability on the chart. Features Detects six ha
这个指标可以检测通过手动和自动方法绘制在图表上的谐波图案。 添加您的评论,请 备注 该指标具有控制面板,并将保存每个(图表和时间框架)的设置。您可以将其最小化,以在图表上腾出更多空间,或者如果您更喜欢使用其他分析工具,可以按下关闭按钮隐藏图表上的所有指标数据。 当您使用此指标并更改设置、添加指标(如移动平均线或布林带)时,指标会自动保存您的编辑模板,您可以随时加载它们。 如果您使用的是Windows 10操作系统,请右键单击MetaTrader图标 > 兼容性 > 更改高DPI设置 > 系统(增强),以获得最佳的屏幕设置(应在高清设备上进行)。 该指标简单地基于谐波交易理论进行图表上的谐波图案检测。如果您希望深入学习,您可以搜索Scott Carney撰写的名为《谐波交易第1卷和第2卷》的书籍。 该指标具有价格和时间警示线。 指标将在您检测到的图案上绘制斐波那契扇形。 指标将绘制支撑/阻力射线。 指标具有批量计算器,帮助您管理风险。 您可以从较高时间框架手动加载绘制的对象到较低时间框架。 重置按钮将清除所有保存的设置(所有/当前)时间框架。 该指标具有警报/通知系统,将为您提供信号的目
PZ Harmonacci Patterns
PZ TRADING SLU
3.17 (6)
可以说,这是您可以为MetaTrader平台找到的最完整的谐波价格形成自动识别指标。它检测19种不同的模式,像您一样认真对待斐波那契投影,显示潜在的反转区域(PRZ),并找到合适的止损和获利水平。 [ 安装指南 | 更新指南 | 故障排除 | 常见问题 | 所有产品 ] 它检测19种不同的谐波价格形态 它绘制了主要,衍生和互补的斐波那契投影(PRZ) 它评估过去的价格走势并显示每个过去的形态 该指标分析其自身的质量和性能 它显示合适的止损和获利水平 它使用突破来表明合适的交易 它在图表上绘制所有样式比率 它实现了电子邮件/声音/视觉警报 受斯科特·M·卡尼(Scott M. Carney)的书的启发,该指标旨在满足最纯粹和最熟练的交易者的需求。但是,它采取了一种使交易更容易的方式:在向交易发出信号之前,它会等待Donchian朝正确方向突破,从而使交易信号非常可靠。 斐波那契投影与向量无关 它实现了电子邮件/声音/推送警报 它绘制了ABCD投影 重要提示: 为了符合 Scott M. Carney先生 的商标申诉,某些图案名称已重命名为不言自明的替代方式, Scott M.
Gartley Projection D
Oleksandr Medviediev
3.71 (7)
具有经过验证的概念和盈利能力的最佳、最有效、可靠的产品。感谢您的考虑。  该指标根据H.M.Gartley的发展(《股票市场利润》,1935年)识别和确认谐波模式(XABCD)。 它将D点投影为透视投影中的一个点(在设置中指定ProjectionD_Mode = true)。 不会重绘。当工作时间段的柱形图关闭时,如果已识别的模式点在Patterns_Fractal_Bars柱中未移动,则在图表上出现一个箭头(指向预期价格运动的方向)。从此刻起,箭头将永久保留在图表上。 注意:连续出现2-3个或更多箭头 - 这是市场条件的变化,而不是重绘。 总共有85种模式(包括Gartley-222和Gartley-222WS,完整列表可在评论部分的Google Drive链接中找到)。在所有已识别的模式中,只有最新识别的模式填充了单一颜色。 参数 DrawPatterns(true/false)- 以实心颜色绘制模式 ProjectionD_Mode(true/false)- 定义D点作为透视投影模式 Patterns_Fractal_Bars - 在认定为形成分形的情况下,最新

Monster Harmonic Indicator
Paul Geirnaerdt
4.59 (29)
Monster Harmonics Indicator is a harmonic pattern indicator. It recognizes Gartley, Bat, Crab, Butterfly, Cypher, White Swan, Black Swan, Shark and several other patterns. Projected patterns that are not yet completed are recognized, too. Monster even shows the PRZ (Potential Reversal Zone). Users can add their own user defined patterns to Monster. Besides the current pattern, Monster also shows all patterns in the symbols history. Monster will provide alerts for developing patterns. Introduced
Alpha Trend sign Alpha Trend sign 是我么长期以来非常受欢迎的交易工具,它可以验证我们的交易系统,并且明确的提示交易信号,并且信号不会漂移。 主要功能: •  根据市场显示活跃区域,根据指标可以很直观的判断当前行情是属于趋势行情,还是震荡行情。    并根据指标的指示箭头切入市场,绿色箭头提示买入,红色箭头提示卖出。 •  建议使用5分钟以上的时间周期进行交易,避免因为小周期波动出现频繁的交易信号。 •  您也可以开启信号提示,以免错过最佳的交易时机。 •  本指标不但可以很好的预测趋势行情,也可以在宽幅震荡行情中获利。 •  本指标本着大道至简的原则,适合不同阶段的交易者使用。 注意事项: •  Alpha Trend sign 有明确的进出场信号,不建议逆势操作,以免造成损失。 •  Alpha Trend sign 是特别成熟的指标,我们团队人手一个,使用它可以实现稳定盈利。     
Voenix
Lorentzos Roussos
4.58 (12)
谐波模式扫描仪和交易员。一些图表模式 包括的模式: ABCD 模式 加特利模式 蝙蝠图案 密码模式 3驱动模式 黑天鹅图案 白天鹅图案 Quasimodo 模式或 Over Under 模式 替代蝙蝠图案 蝴蝶图案 深蟹纹 蟹纹 鲨鱼纹 五O型 头肩形态 上升三角形图案 一二三模式 和 8 种自定义模式 Voenix 是一款多时间框架和多对谐波模式扫描仪,支持 25 种图表和斐波那契模式。它采用自定义块光学算法,无需重新绘制,无需依赖确认步骤即可迅速发现可能的模式(与锯齿形计算不同)。 它可以自动交易您选择的模式、发送通知或只是将它们收集在一个表格中以便于访问和评估。 交易最多可以有 3 个利润目标,并且,在每个目标关闭的订单百分比方面的差异。 还提供了一个简单的步进跟踪功能。 每种形态都可以用自己的止损、目标、止损计算模式、警报设置、交易设置进行调整,并且可以在交易(或通知)之前接受额外的过滤器 这些过滤器是 rsi、macd、布林带、随机震荡指标和基本支撑和阻力解决方案的基本指标。 模式被收集在一个快速访问表上,并且可以根据它们的出现时间、类型、它们出现的符号、它们的时间范围
The indicator detects and displays Shark harmonic pattern (see the screenshot). The pattern is plotted by the extreme values of the ZigZag indicator (included in the resources, no need to install). After detecting the pattern, the indicator notifies of that by a pop-up window, a mobile notification and an email. The indicator highlights the process of the pattern formation and not just the complete pattern. In the former case, it is displayed in the contour triangles. After the pattern is comple
This is an arrow indicator without a future function,developed based on the most advanced profit trading algorithms.It has the most innovative and advanced dual trend analysis module, as well as the latest and highly effective market trend prediction algorithm.Trends are your friends, and following larger trends can earn the maximum profit in foreign exchange. This indicator helps traders identify current trends and track them. Someone once made a profit of 10 times in a week by relying on it.No
ATeam Divergence
Hoang Ngoc Thach
The CCI Divergence is a reasonably useful indicator in itself, but it is even more effective when used with divergence pattern trading. The CCI Divergence indicator signal is one of the most potent signals among the indicators that exist in the market. Here is new version for Divergence Indicator using CCI method, with more improvements. Divergences indicate a potential investment point because the directional moment does not confirm the price. A bullish divergence occurs when the underlying va
The   Fibonacci Confluence Toolkit   is a technical analysis tool designed to help traders identify potential price reversal zones by combining key market signals and patterns. It highlights areas of interest where significant price action or reactions are anticipated, automatically applies Fibonacci retracement levels to outline potential pullback zones, and detects engulfing candle patterns. Its unique strength lies in its reliance solely on price patterns, eliminating the need for user-define
Introduction to X3 Chart Pattern Scanner X3 Cherart Pattern Scanner is the non-repainting and non-lagging indicator detecting X3 chart patterns including Harmonic pattern, Elliott Wave pattern, X3 patterns, and Japanese Candlestick patterns. Historical patterns match with signal patterns. Hence, you can readily develop the solid trading strategy in your chart. More importantly, this superb pattern scanner can detect the optimal pattern of its kind. In addition, you can switch on and off individu
Auto Fibo Pro m
DMITRII GRIDASOV
“Auto FIBO Pro” Crypto_Forex 指标 - 是交易中的绝佳辅助工具! - 指标自动计算并放置在图表斐波那契水平和局部趋势线(红色)上。 - 斐波那契水平指示价格可能反转的关键区域。 - 最重要的水平是 23.6%、38.2%、50% 和 61.8%。 - 您可以将其用于反转剥头皮或区域网格交易。 - 还有很多机会可以使用 Auto FIBO Pro 指标来改进您当前的系统。 - 它具有信息价差掉期显示 - 它显示所连接的外汇对的当前价差和掉期。 - 显示屏还显示账户余额、净值和保证金。 - 可以将信息价差掉期显示定位在图表的任何角落 . 点击这里查看高质量的交易机器人和指标! 这是仅在此 MQL5 网站上提供的原创产品。 ...............................................
Elliott Wave MT4
Sathit Sukhirun
自动化艾略特波浪理论 (Automated Elliott Wave) 1. 自动数浪并减少主观偏见 (客观性) 通常,艾略特波浪的计数往往带有很强的“主观想象”或个人观点。该指标通过以下方式提供帮助: 寻找推动浪 (Impulse Wave 1-2-3-4-5): 使用严格的规则(例如:第3浪不能是最短的,第4浪不能与第1浪重叠),为您展示理论上正确的价格结构。 寻找调整浪 (Corrective Wave A-B-C): 帮助捕捉价格回调的时机,以便顺势再次入场。 2. 多层次分析 (Multi-Degree Analysis) 该指标不仅仅关注单一时间框架,而是同时分析3个深度的波浪级别,提供3D市场视图: 微浪 (Minor): 用于观察快速波动。 中浪 (Intermediate): 用于观察主要趋势。 主浪 (Primary): 用于观察市场大局。 优点: 您可以根据自己的交易风格开启或关闭每个级别的显示。 3. 寻找价格目标和入场点 (Targeting & Entry) 当系统发现完整的波浪时,它不仅会标记波浪,还会帮助制定交易计划: 斐波那契预测 (Fibonacc
PZ Penta O MT4
PZ TRADING SLU
2.33 (3)
The Penta-O is a 6-point retracement harmonacci pattern which usually precedes big market movements. Penta-O patterns can expand and repaint quite a bit. To make things easier this indicator implements a twist: it waits for a donchian breakout in the right direction before signaling the trade. The end result is an otherwise repainting indicator with a very reliable trading signal. The donchian breakout period is entered as an input. [ Installation Guide | Update Guide | Troubleshooting | FAQ | A
FREE
"Impulses and Corrections 4" is created to help traders navigate the market situation. The indicator shows multi-time frame upward and downward "Impulses" of price movements. These impulses are the basis for determining the "Base" , which is composed of zones of corrections of price movements, as well as "Potential" zones for possible scenarios of price movement. Up and down impulses are determined based on a modified formula of Bill Williams' "Fractals" indicator. The last impulse is always "U
Sweet Waffle
Christophe Godart
The arrows are calculated with: -     2 Parabolic  parameters -     2 ADX parameters -     4 Stochastic parameters We recommend to combine it with Parabolic, ZigZag or Elliot waves indicator. Always trade the trend! If you make sure to draw your trend lines and support/resistance zones you will just have to wait for the signal to appear. Take the trade. For Binary Options it is advisable to set the expiry time to 5-15 min in M1 chart. THIS INDICATOR IS ZERO REPAINT Best assets to trade: - EUR
The indicator detects and displays 3 Drives harmonic pattern (see the screenshot). The pattern is plotted by the extreme values of the ZigZag indicator (included in the resources, no need to install). After detecting the pattern, the indicator notifies of that by a pop-up window, a mobile notification and an email. The indicator highlights the process of the pattern formation and not just the complete pattern. In the former case, it is displayed in the contour triangles. After the pattern is com
The indicator displays Renko bars on the chart, uses them to plot the ZigZag - trend lines connecting the local Lows and Highs of the price movement, and highlights them based on the Gartley patterns, showing the potential price reversal points. Renko - specialized display of the price action, in which the graph is displayed not every bar of the time frame, but only under the condition that the price had passed more than the specified number of points. Renko bars are not bound to a time frame, s
Reversal Pattern Pro
Boonyapagorn Rodvattanajinda
Reversal Patterns Pro Reversal Patterns Pro is a Price Action (PA) analytical tool that scans the reversal patterns.  - Finds and marks the most dependable Japanese candlestick patterns in real-time. - Supports all time frames (Best for Scalping) - Doesn't repaint making it an exceptional indicator for Expert Advisors. Input parameters : - Support & Resistance Mode ( true or false ) for enabling advanced filtering - Donchian Period - RSI Period - RSI Oversold Level - RSI Overbought Level - Al
Octave Fractal Channel — Dynamic Gann-Based Support/Resistance Levels with Auto-Scaling. This indicator plots a dynamic channel based on the fractal structure of price movement. Channel levels adapt to the current symbol and timeframe, making it suitable for use across various financial instruments — from currency pairs to cryptocurrencies and indices. The indicator can be used in combination with other technical tools, such as the RSI oscillator, to provide additional signal filtering. How to
RTSPattern
Tomas Belak
The indicator provides a superior alternative to price action analysis. It enables the identification of normalized patterns, which are then transformed into a graphical representation to forecast future steps within a time series. In the top-left corner, you'll find information regarding the expected prediction accuracy, determined through a complex MSQE calculation. You have the flexibility to adjust the time window, making it easy to validate the indicator's performance. Additionally, you can
FreqoMeterForecast
Stanislav Korotky
The main idea of this indicator is rates analysis and prediction by Fourier transform. Indicator decomposes exchange rates into main harmonics and calculates their product in future. You may use the indicator as a standalone product, but for better prediction accuracy there is another related indicator - FreqoMaster - which uses FreqoMeterForecast as a backend engine and combines several instances of FreqoMeterForecast for different frequency bands. Parameters: iPeriod - number of bars in the ma
Price Magnets
Ivan Simonika
Price Magnet — Price Density and Attraction Levels Indicator Price Magnet is a professional analytical tool designed to identify key support and resistance levels based on statistical Price Density. The indicator analyzes a specified historical period and detects price levels where the market spent the most time. These zones act as “magnets,” attracting price action or forming a structural base for potential reversals. Unlike traditional Volume Profile tools, Price Magnet focuses on price-time d
Enigmera
Ivan Stefanov
5 (9)
ENIGMERA: 市场的核心 重要提示:MQL5.com 演示版本在策略测试器中运行,可能无法完全反映 Enigmera 的功能。请查看描述、截图和视频了解详细信息。如有任何问题,请随时联系我! 该指标的代码已完全重写。版本 3.0 增加了新功能并修复了自指标发布以来积累的错误。 简介 这个指标和交易系统是金融市场的一种独特方法。ENIGMERA 使用分形周期来精确计算支撑和阻力水平。它展示了真实的积累阶段,并提供了方向和目标。无论是在趋势中还是在修正中,这个系统都能工作。 它是如何工作的 指标的大部分功能通过图表左侧的按钮控制,使得能够快速响应不同的市场情况。 按钮 ON/OFF – 显示或隐藏整个指标。 Channel – 激活支撑通道,显示可接受的偏差范围。 Dev1 (第一偏差) – 指示价格在支撑偏差内的波动,信号表示市场正在整合或积累力量。 Dev2 (第二偏差) – 显示价格在偏差之间的波动,表示趋势形成和方向。 Dev3 (第三偏差) – 表示趋势的显著加速和高波动性。 45deg (45度) – 显示市场的节奏和相对于 45 度线的运动稳定性。 Tgt1/2
这是一个主要基于数据分析、统计算法、价格突破算法、以及基于一些主要指标的策略共同诊断当前方向。该信号会在主图表上显示历史一段时间的所有信号,如果你喜欢在图表上显示信号方向,该信号会是一个很好的选择。 优势: 适用于所有品种。 适用于所有周期。 仅有一个可调节参数,简单易用。 注意: 该信号仅提供最有可能的所有信号,用户可以结合自己的分析结果和信号方向来参考下单。 输入参数: threshold of fluctuation intensity,(0,100): 波动强度阈值,范围是(0, 100), 阈值越小得到的信号越激进,也就是得到的信号越早,但准确率也可能越低,默认值是85. 大家有任何问题都可以联系我,我会及时回复大家,谢谢。
The indicator detects and displays the AB=CD harmonic pattern on the chart according to the scheme provided in the screenshot. The pattern is plotted by the extreme values of the ZigZag indicator (included in the resources, does not require additional installation). After detecting the pattern, the indicator notifies of that by the pop-up window, a mobile notification and an email. The indicator highlights not only the complete figure, but also the time of its formation. During the formation the
EARLY REMINDER: The Starting price is 65 price will rise soon up to 365$ and then 750$ after first 10 copies of sales. Grab this offer now! Introduction Hello, traders! Welcome to the demonstration of the Forex Beast Indicator , a comprehensive tool designed to assist aspiring traders in navigating the complexities of the forex market. This indicator incorporates seven essential components to provide a well-rounded trading experience: Moving Averages Colored Zones Support and Resistance Levels
Stochastic Visual MTF for MT4
Naththapach Thanakulchayanan
This MT4 indicator, Stochastic Visual MTF, summarize the oscillator values in color graphic for both  Main and Signal in current market emotion stage which will show you in multi timeframes (9) and sum of the total Main and Signal oscillator values which is an important information for traders especially you can see all oscillator values in visualized graphic easily, You can add more by Shift, Hope it will be helpful tool for you for making a good decision in trading.
该产品的买家也购买
TrendMaestro
Stefano Frisetti
4 (4)
Attention: beware of SCAMS, TRENDMAESTRO is only ditributed throught MQL5.com market place. note: this indicator is for METATRADER4, if you want the version for METATRADER5 this is the link:  https://www.mql5.com/it/market/product/108106 TRENDMAESTRO ver 2.5 TRENDMAESTRO recognizes a new TREND from the start, he never makes mistakes. The certainty of identifying a new TREND is priceless. DESCRIPTION TRENDMAESTRO identifies a new TREND in the bud, this indicator examines the volatility, volumes a
Miraculous 指标 – 100% 不重绘的外汇和二元期权工具,基于江恩九方图 这个视频介绍的 Miraculous 指标 是一款专为外汇和二元期权交易者开发的高精度、强大交易工具。该指标的独特之处在于它建立在传奇的 江恩九方图 和 江恩振动法则 之上,使其成为现代交易中可用的最精确预测工具之一。 Miraculous 指标 完全不重绘 ,这意味着它的信号在 K 线收盘后不会改变或消失——你看到的就是你得到的。这为交易者提供了可靠且一致的基础,让他们能够自信地进出场交易。 主要特点: 基于江恩九方图和江恩理论构建 100% 不重绘的信号系统 适用于所有时间周期(M1、M5、H1、H4、日线、周线) 适用于外汇和二元期权交易 清晰的买卖信号,准确率高 可用于剥头皮、日内交易或波段交易 兼容大多数 MT4 平台 这款工具旨在帮助初学者和专业交易者做出更好、更明智的决策。无论您是交易货币、指数还是二元期权,Miraculous 指标都将为您在市场中提供所需的优势。
Dynamic Scalper System
Vitalyi Belyh
5 (1)
“ Dynamic Scalper System ”指标专为在趋势波内进行剥头皮交易而设计。 已在主要货币对和黄金上进行测试,并可与其他交易工具兼容。 提供顺势短线建仓信号,并提供额外的价格变动支持。 指标原理: 大箭头决定趋势方向。 在趋势波内,我们采用一种生成小箭头形式的剥头皮交易信号的算法。 红色箭头代表看涨方向,蓝色箭头代表看跌方向。 敏感的价格变动线会沿着趋势方向绘制,并与小箭头信号协同作用。 信号运作方式如下:当线在适当时刻出现时,将形成入场信号;在出现线时,持仓;线完成后,平仓。 建议的操作时间范围为M1 - H4。 箭头在当前K线上方形成,如果下一根K线已开仓,则不会重新绘制上一根K线上方的箭头。 输入参数 Trend Wave Period - 趋势方向(大箭头)的周期,改变趋势波的时间间隔。值 1 表示趋势方向的最长持续时间,参数值越大,持续时间越短。 Scalper Arrows Period - 信号箭头(小箭头)的计算周期,改变入场信号的生成频率。值 3 表示最频繁的生成频率,参数值越大,箭头频率越低,准确度越高。 这些参数可以根据不同的时间范
KuKl
IGOR KIRIANEN
The indicator is built on a non-standard Zig Zag, it draws accumulations after which if the price leaves this zone and a test of this zone occurs, then a sound signal is given and an arrow appears - after the test candle closes.The indicator does not redraw its signals, it is very easy to use, there are only three settings 1- this is the zig zag parameter 2- this is the minimum price exit from the zone 3- this is the maximum price exit from the zone. The lower the parameter for Zig Zag, the more
Breakout Arrows Mt4
Michael Oko Oboh
5 (1)
Trend Breakout Arrows Indicator The Trend Breakout Arrows Indicator is a momentum-based signal tool designed to identify potential bullish and bearish breakout opportunities. It displays clear arrow signals directly on the price chart, helping traders quickly recognize possible trend changes and continuation setups. Up Arrow (Buy Signal) A magenta up arrow appears below a candle when bullish momentum begins to strengthen. This signal indicates that buying pressure may be overtaking selling press
TRADING STRATEGY GUIDE DELIVERY The full Trading Strategy Guide will be sent directly to you after purchase. Just message me on MQL5 and ask for it — you'll receive it instantly, along with priority support and setup help. Powered Market Scanner for Smart Trading Decisions Keypad Support & Resistance is a next-generation MT4 trading system built for serious traders who demand precision, reliability, and clarity. It combines advanced smart filters with real-time price structure logic to genera
CountSig
Yin Zhou Luo
一款信号统计指标(MT4)——实现基于当前图表周期下的单线MA转向和双线MA金叉/死叉统计 . 转向定义:前一K向下或走平,当前K向上,视为转向向上;反之,转向向下。 金死叉定义:前一K快线在慢线下方,当前K快线在慢线上方,为金叉;反之,死叉。 参数及使用说明: 1、可指定统计K线数。 2、可指定4个不同的日内时间段,格式如"03:00-07:59",4个时间段可交叉任意输入。 3、可配置ABC三个浮盈区间段点值。如:分界区间统计小点值设为500,即当某转向信 号出现后到下一反向信号止浮盈<=此点值,计入A区间; 若大于此点值<大分界点值时,计入B区间;若大于“大分界点值”计入C区间。 4、最大/最小浮盈统计。显示所有统计区间内的最大浮盈点值和最小浮盈点值(亏损点值)。 5、输出完整信号,按信号出现顺序排列,如“ACCBCA”之类。 6、综合预测。使用概率、周期、趋势、马尔可夫链等综合概算输出预测该信号出现的归类概率值。 7、加载指定MA线。在当前图表自动载入相应设置的MA线。 8、自适应列宽。以完整显示统计信号数。 9、用法:点击相应统计按钮即输出相应的统计表格.
Fxland Price Reversal Zones (MT4) FXLAND Smart Reversal Indicator is a professional technical analysis tool designed to help traders identify potential price reversal zones and key market turning points with clarity and precision. The best reversal indicator and price return by choosing only one ceiling or floor in each time frame A masterpiece of combining mathematics and Gann, fractal matrix, Fibonacci, movement angle and time. Completely intelligent Key Features Detects potential pr
VTrende Pro mt4
Andrii Diachenko
3 (2)
VTrende Pro MT4 - MTF indicator for trend trading with a display panel for MT5 *** Videos can be translated into any language using subtitles (video language - Russian) Although the signals of the VTrende Pro indicator can be used as signals of a full-fledged trading system, it is recommended to use them in conjunction with the Bill Williams TS. VTrende Pro  MT4 is an extended version of the VTrende indicator. Difference between Pro version and VTrende: - Time zones - Signal V - signal 1-2 wave
WanaScalper MT4
Isaac Wanasolo
1 (1)
A scalping indicator based on mathematical patterns, which on average gives signals with relatively small SL, and also occasionally helps to catch big moves in the markets (more information in the video) This indicator has three main types of notifications: The first type warns of a possible/upcoming signal on the next bar The second type indicates the presence of a ready signal to enter the market/open a position The third type is for SL and TP levels - you will be notified every time price re
FFx Engulfing Setup Alerter gives trade suggestions with Entry, Target 1, Target 2 and StopLoss. Below are the different options available: Entry suggestion - pips to be added over the break for the entry 3 different options to calculate the SL - by pips, by ATR multiplier or at the pattern High/Low 3 different options to calculate the 2 TPs - by pips, by ATR multiplier or at Risk/Reward Offset the dashboard - any place on the chart Remove the suggestion once the price reached the SL line Lines
FFx InsideBar Setup Alerter gives trade suggestions with Entry, Target 1, Target 2 and StopLoss. Below are the different options available: Entry suggestion - pips to be added over the break for the entry Minimum candle size - to avoid too close buy/sell entry suggestions 3 different options to calculate the SL - by pips, by ATR multiplier or at the pattern High/Low 3 different options to calculate the 2 TPs - by pips, by ATR multiplier or at Risk/Reward Offset the dashboard - any place on the c
FFx OutsideBar Setup Alerter gives trade suggestions with Entry, Target 1, Target 2 and StopLoss. Below are the different options available: Entry suggestion - pips to be added over the break for the entry. 3 different options to calculate the SL - by pips, by ATR multiplier or at the pattern High/Low. 3 different options to calculate the 2 TPs - by pips, by ATR multiplier or at Risk/Reward. Offset the dashboard - any place on the chart. Remove the suggestion once the price reached the SL line.
FFx PinBar Setup Alerter gives trade suggestions with Entry, Target 1, Target 2 and StopLoss. Below are the different options available: Entry suggestion - pips to be added over the break for the entry Minimum candle size - to avoid too small candles 3 different options to calculate the SL - by pips, by ATR multiplier or at the pattern High/Low 3 different options to calculate the 2 TPs - by pips, by ATR multiplier or at Risk/Reward Offset the dashboard - any place on the chart Remove the sugges
Lineverse Trendlines
Arkady Segal
5 (1)
Automatic, live & interactive picture of all trendlines. Assign push, email and sound alerts to the lines of your choice and be informed about price rollback, breakout, rollback after breakout, number of rollbacks, line expiration by double breakout. Correct, drag or delete the lines and interactively tune the line system. https://youtu.be/EJUo9pYiHFA . Chart examples https: //www.mql5.com/en/users/efficientforex Price Interaction Events All events are effective immediately and only after one
FFx MACD Divergences
Eric Venturi-Bloxs
The purpose of this new version of the MT4 standard indicator provided in your platform is to display in a sub-window multiple timeframes of the same indicator with its divergences. See the example shown in the picture below. But the display isn't like a simple MTF indicator. This is the real display of the indicator on its timeframe. Here's the options available in the FFx divergences indicator: Select the timeframes to be displayed (M1 to Monthly) Define the width (number of bars) for each tim
FFx RSI Divergences
Eric Venturi-Bloxs
The purpose of this new version of the MT4 standard indicator provided in your platform is to display in a sub-window multiple timeframes of the same indicator with its divergences. See the example shown in the picture below. But the display isn't like a simple MTF indicator. This is the real display of the indicator on its timeframe. Here's the options available in the FFx divergences indicator: Select the timeframes to be displayed (M1 to Monthly) Define the width (number of bars) for each tim
FFx CCI Divergences
Eric Venturi-Bloxs
The purpose of this new version of the MT4 standard indicator provided in your platform is to display in a sub-window multiple timeframes of the same indicator with its divergences. See the example shown in the picture below. But the display isn't like a simple MTF indicator. This is the real display of the indicator on its timeframe. Here's the options available in the FFx divergences indicator: Select the timeframes to be displayed (M1 to Monthly). Define the width (number of bars) for each ti
The FFx Dashboard MTF alerter will show you on a single chart all the timeframes (M1 to Monthly) with their own status for the indicator. 2 Alert Options: Single timeframe: each selected timeframe alert separately when a signal occurs Multi timeframes: all selected timeframes must agree for an alert to be triggered Both options have an input to select the timeframes to be used for the alert(s). How to Understand the Status: Green/Red square: histogram above/below 0 line Green square + Red bord
The FFx Dashboard MTF alerter will show you on a single chart all the timeframes (M1 to Monthly) with their own status for the indicator. 2 Alert Options: Single timeframe: each selected timeframe alert separately when a signal occurs Multi timeframes: all selected timeframes must agree for an alert to be triggered Both options have an input to select the timeframes to be used for the alert(s). How to understand the status: Green/Red square: RSI above/below 50 line Green square + Red border: R
The FFx Dashboard MTF alerter will show you on a single chart all the timeframes (M1 to Monthly) with their own status for the indicator. 2 Alert Options: Single timeframe: each selected timeframe alert separately when a signal occurs Multi timeframes: all selected timeframes must agree for an alert to be triggered Both options have an input to select the timeframes to be used for the alert(s). How to understand the status: Green/Red square: Stoch above/below 50 line Green square + Red border:
The FFx Dashboard MTF alerter will show you on a single chart all the timeframes (M1 to Monthly) with their own status for the indicator. 2 Alert Options: Single timeframe: each selected timeframe alert separately when a signal occurs Multi timeframes: all selected timeframes must agree for an alert to be triggered Both options have an input to select the timeframes to be used for the alert(s). How to understand the status: Green/Red square: Price above/below Cloud (Kumo) Green square + Red bo
The FFx Dashboard MTF alerter will show you on a single chart all the timeframes (M1 to Monthly) with their own status for the indicator. 2 Alert Options: Single timeframe: each selected timeframe alert separately when a signal occurs Multi timeframes: all selected timeframes must agree for an alert to be triggered Both options have an input to select the timeframes to be used for the alert(s). How to understand the status: Green/Red square: MA pointing Up/Down Green square + Red border: MA po
The FFx Dashboard MTF alerter will show you on a single chart all the timeframes (M1 to Monthly) with their own status for the indicator. 2 Alert Options: Single timeframe: each selected timeframe alert separately when a signal occurs. Multi timeframes: all selected timeframes must agree for an alert to be triggered. Both options have an input to select the timeframes to be used for the alert(s). How to understand the status: Green square: Price above PSAR Red square: Price below PSAR Options
The FFx Dashboard MTF alerter will show you on a single chart all the timeframes (M1 to Monthly) with their own status for the indicator. 2 Alert Options: Single timeframe: each selected timeframe alert separately when a signal occurs Multi timeframes: all selected timeframes must agree for an alert to be triggered Both options have an input to select the timeframes to be used for the alert(s). How to understand the status: Green/Red square: CCI above/below levels (ie. 100/-100) Grey square: C
The FFx Dashboard MTF alerter will show you on a single chart all the timeframes (M1 to Monthly) with their own status for the indicator. 2 Alert Options: Single timeframe: each selected timeframe alert separately when a signal occurs Multi timeframes: all selected timeframes must agree for an alert to be triggered Both options have an input to select the timeframes to be used for the alert(s). How to understand the status: Green/Red square: ADX above level Grey square: ADX below level Red bor
The FFx Dashboard MTF alerter will show you on a single chart all the timeframes (M1 to Monthly) with their own status. 2 Alert Options: Single timeframe: each selected timeframe alert separately when a signal occurs Multi timeframes: all selected timeframes must agree for an alert to be triggered Both options have an input to select the timeframes to be used for the alert(s). How to understand the status: Green/Red square: bullish/bearish candle Options available in the FFx Dashboard Alerter
The indicator of a Professional Trader is an arrow indicator for predicting the direction of price movement. I have been working on this indicator since 2014. You can use this indicator as your main indicator, use its entry signals, and use it as your only indicator to find entry points. About the product: Recommended TF [H4-D1-W1]   . The indicator predicts the direction of the next candle. Fits a variety of tools; Flexibility in settings for different instruments and intervals through the MO
作者的更多信息
BollMTFzzz
Guo Sheng Zhao
Bollinger Bands MTF projects Bollinger Bands from multiple timeframes onto the current MT4 chart. It helps traders review volatility boundaries, trend direction, and nearby price confluence across several timeframes from a single workspace. Key features: - Supports M1, M5, M15, M30, H1, and D1 Bollinger Bands. - Independently displays middle, upper, and lower bands, with an option to show only timeframes above the current chart period. - Evaluates middle-band slope and highlights the active t
FREE
左右交易的其实都是情绪,把握情绪才是交易最终能够获得盈利的关键。 所以我这是一个「趋势氛围灯」指标,它能为您的交易图表做三件事: 1. 一眼识别市场状态 深蓝色背景   → 市场处于 强劲多头氛围 深红色背景   → 市场处于 强劲空头氛围 深灰色背景   → 市场处于 震荡平衡状态 2. 提供直观的视觉辅助 将复杂的多空力量对比 转化为最直观的背景色 让您 无需分析数据 就能感受市场情绪 在多个图表间切换时能 瞬间把握每个品种的当前强弱 3. 辅助交易决策 避免在强势多头时逆势做空 避免在强势空头时逆势做多 在震荡行情中提醒您保持观望或采用区间策略 本质上,它就像为您的交易图表安装了一个「情绪指示灯」,用颜色告诉您市场此刻的“性格”是强势上涨、强势下跌还是犹豫不决.
SAMBAisgood
Guo Sheng Zhao
本指标是一款仅保留大周期趋势信号的精简版分析工具,专为识别市场核心趋势顶底而设计,剔除了中小周期的干扰信号,适用于外汇、贵金属等品种的中长线交易分析。 指标加载后,图表会以黄色箭头标注大周期的顶底拐点,同步绘制趋势线、回撤线与目标线,清晰界定趋势方向、关键支撑阻力位及潜在目标区间。用户可通过参数设置调整大周期跨期、止损止赢幅度、箭头样式等,适配不同交易品种与周期的特性。 此外,指标内置报警功能,当价格触碰趋势线或出现顶底信号时,可触发声音提醒;注释显示功能则能回溯历史信号记录,辅助交易者复盘分析。整体而言,该指标以简洁直观的呈现方式,帮助使用者聚焦大周期趋势,过滤短期波动噪音,提升中长线交易决策效率。 适用于贵金属,加密货币等波动比较大的品种。
ADX Dashboard V11.03 是一款专业的 MT4 指标,旨在为交易者提供多周期趋势强度与市场情绪的直观可视化概览。该指标整合了平均趋向指数(ADX)与相对强弱指数(RSI),将关键数据呈现在简洁的面板中,帮助交易者无需复杂分析单个指标图表,即可快速做出明智的交易决策。 首先,安装流程简单便捷。将编译后的 .ex4 文件复制到 MT4 安装目录下的 “Indicators” 文件夹中,重启 MT4 软件后,通过顶部菜单栏的 “插入”→“指标”→“自定义”,找到 “ADX_Dashboard_Final_V11.03” 并添加至当前图表。添加完成后,图表上会出现一个可配置的面板,默认显示在左上角位置。 其次,参数配置可根据个人交易风格灵活调整。“位置参数”(X_Axis 与 Y_Axis)用于调节面板在图表上的摆放位置,避免遮挡关键价格走势。“周期设置” 支持通过下拉菜单选择三个不同的时间周期(从 1 分钟到月线),这一功能至关重要,能让你同时监控短期、中期和长期市场趋势。“指标参数”(ADX_Period 与 RSI_Period)可根据交易策略修改,默认的 14 周期设
Fibopro
Guo Sheng Zhao
FiboPro 2.11 指标使用说明 一、指标概述 FiboPro 2.11 是一款适配 MT4 平台的动态斐波那契支撑阻力指标,通过动态中枢线结合波动率计算多档斐波那契档位线,可直观展示市场趋势(多头 / 空头 / 震荡)、识别价格超涨超跌信号,适用于外汇、期货、股票等各类 K 线交易品种,时间周期建议选择 M15 及以上,避免短周期噪音干扰。 二、安装方法 将指标文件(fiboz.mq4)复制到 MT4 安装目录下的 “MQL4/Indicators” 文件夹; 重启 MT4 客户端,在 “导航栏 - 技术指标” 中找到 “FiboPro 2.11 Final Version”; 将指标拖拽至目标交易品种图表,自动加载并显示 13 条斐波那契档位线及动态背景色。 三、参数设置说明 Central Line Period(中枢周期) :默认 100,调整中枢线计算的 K 线数量,数值越大中枢线越平滑,适合趋势行情;数值越小对价格变化越敏感,适合震荡行情。 Central Line Method(均线类型) :0=SMA(简单均线)、1=EMA(指数均线)、2=SMMA(平滑均线)、
This MT4 Expert Advisor (EA) is a   multi - timeframe trend - based trading assistant   with visualized UI and automated trading logic. Its core functions are as follows: Trend Analysis & Visualization Analyzes market trends by integrating multiple technical indicators including EMA (21/55), ADX (14), MACD (12/26/9), RSI (14) and volume data across different timeframes. Generates Chinese - language trend comments (e.g., "Bullish momentum surges" or "Bearish dominance prevails") and displays the
UltimateSystem
Guo Sheng Zhao
Ultimate_Combined_System_V16.3(简称UCS V16.3)是一款专为MetaTrader 4(MT4)平台设计的专业综合趋势跟踪指标。它融合了MACD、ADX、EMA、动量(Momentum)和唐奇安通道(Donchian Channel)五大核心技术分析因子,能够精准识别趋势方向、判断市场状态,是趋势交易者的核心辅助工具。 该指标的核心是一套 四重因子投票计分体系 ,通过多维度标准评估市场的多头、空头或中性状态:ADX+DI/-DI对比(趋势方向)、ADX强度阈值(趋势有效性)、收盘价与EMA对比(中期价格重心)以及动量指标(价格波动动能)。仅当多空双方得分差超过1时,才会确认明确趋势,可有效过滤震荡行情中的无效信号。 核心功能包括:1)可视化趋势展示(青色线代表多头趋势、红色线代表空头趋势、灰色线代表中性/震荡市场);2)实时20期唐奇安通道,界定价格区间(上轨:20期最高价,下轨:20期最低价,中轨:高低价均值);3)右侧现价标记线(MACD大于0时为绿色,小于0时为品红色),直观反映短期多空强弱。 指标经优化修复(含数组越界、周期校验错误等问题),
GoldAuctionPA
Guo Sheng Zhao
黄金拍卖价格行为交易指标,专为UTC+0服务器时间平台设计,并采用纽约收盘制对日线进行校正,夏令时与冬令时会自动切换重置时间点。指标核心融合了拍卖理论中的成交量分布分析(POC成交密集区、VAH价值区上沿、VAL价值区下沿),用于判断价格当前处于价值区内部、上方还是下方,进而反映买卖双方主动性。同时内置扫损流动性识别逻辑,能够捕捉价格刺破关键高低点后又快速收回的"扫损做多/做空"信号,并结合裸K价格行为形态(针形线、吞没形态)进行确认,避免单纯依赖形态或单纯依赖位置产生虚假信号。指标还提供突破接受判断机制,要求价格在关键位外连续收盘若干根K线才认定为有效突破,减少假突破干扰。关键位来源覆盖前日/前周/前月高低点、当日高低点、亚洲盘区间、H1与H4摆动结构点,以及可选的整数关口。为进一步筛选信号质量,指标内置认知模型过滤器,综合拍卖位置、交易时段活跃度(伦敦盘、纽约盘、重叠时段)以及高周期趋势方向进行评分,仅让分数达标的信号显示或触发提醒。图表上会绘制关键位线条、价值区矩形框、四类信号箭头,并配有一个信息面板,实时展示点差、拍卖状态、当前时段、多空结构、上下方最近流动性位置,以及基于当前
QuietConfluence
Guo Sheng Zhao
Quiet Confluence 是一款用于 MT4 图表的多因素技术分析指标,将布林带趋势、突破评分、MACD 背离、波动状态以及支撑阻力信息整合在同一界面中。它适合希望减少图表切换并从多个角度观察市场环境的交易者。 主要功能: - 显示布林带上轨、下轨及随趋势方向变化的中轨。 - 结合价格穿越、成交量和 MACD 条件计算突破评分。 - 标记看涨与看跌 MACD 背离,可选择传统增强模式或枢轴确认模式。 - 使用布林带宽度识别收缩、扩张及常规波动状态。 - 显示近期支撑阻力及价格标签。 - 支持收盘 K 线信号、弹窗、声音和推送通知等可选设置。 指标参数可用于调整周期、阈值、历史计算范围、颜色和显示组件。Quiet Confluence 是分析辅助工具,不执行交易,也不构成投资建议。历史信号不代表未来结果,使用者应结合自身交易计划和风险管理进行判断。
Bollinger Insight 是一款基于 Tick Volume 的价格分布分析工具,用于在 MT4 主图中显示成交量轮廓、控制点、价值区域和低成交量区域。它可帮助观察指定区间内市场活动在不同价格层级的分布情况。 主要功能: - 按价格区间绘制 Tick Volume Profile。 - 显示控制点 POC,并支持发展中控制点模式。 - 计算并显示 VAH 与 VAL,价值区域比例可调。 - 识别低成交量节点,并将其转换为可视化供需区域。 - 支持固定回看区间、轮廓行数、宽度和水平偏移设置。 - 可优先采用 M1 数据构建轮廓,并在数据不足时回退到当前周期。 - 支持当前 K 线更新、未完成 K 线包含方式及多实例标识。 Tick Volume 表示报价变动次数,并不等同于交易所真实成交量。不同经纪商的数据源可能产生不同结果。本指标仅用于分析,不执行交易,也不构成投资建议。
Squeeze Momentum 将布林带与 Keltner Channel 的相对位置用于识别波动收缩和释放,并通过彩色动量柱显示方向与强弱变化。它适合观察低波动阶段以及随后可能出现的波动扩张。 主要功能: - 识别无挤压、挤压进行中和挤压释放状态。 - 使用四色柱体区分看涨动量增强、看涨动量减弱、看跌动量增强和看跌动量减弱。 - 布林带周期、倍数、Keltner Channel 周期和倍数均可调整。 - Keltner Channel 可选择使用 True Range。 - 支持挤压释放、动量零轴穿越、挤压开始和动量颜色变化提醒。 - 提供弹窗、声音、推送及邮件通知选项。 - 可限制最大计算 K 线数量以减少终端负载。 挤压状态表示波动条件,并不直接代表价格方向或入场信号。动量和波动均可能迅速变化。本指标仅用于技术分析,使用者应独立评估市场风险。
筛选:
无评论
回复评论