YouTube'dan Mağaza ile ilgili eğitici videoları izleyin
Bir alım-satım robotu veya gösterge nasıl satın alınır?
Uzman Danışmanınızı
sanal sunucuda çalıştırın
sanal sunucuda çalıştırın
Satın almadan önce göstergeyi/alım-satım robotunu test edin
Mağazada kazanç sağlamak ister misiniz?
Satış için bir ürün nasıl sunulur?
MetaTrader 4 için teknik göstergeler - 7
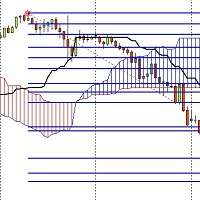
I have developed an indicator based on both the fibo musang strategy and the price breaking of the ichimoku cloud and it has amazing results
the features are:
1- Once activated it give you the trend where you are from the chart
2- After a trend change it gives you an alert on PC or notification on your phone if you are away.
3- It sends you the exact prices to take an order and 3 take profit levels and your stoploss.
4- It works on every timeframes from 1m to MN.
5- It works on pairs and C

The indicator show Higher timeframe candles for ICT technical analisys Higher time frames reduce the 'noise' inherent in lower time frames, providing a clearer, more accurate picture of the market's movements.
By examining higher time frames, you can better identify trends, reversals, and key areas of support and resistance.
The Higher Time Frame Candles indicator overlays higher time frame data directly onto your current chart.
You can easily specify the higher time frame candles you'd li
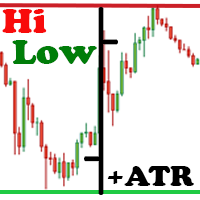
The Hi Low Last Day ( Hi Lo Last Day ) indicator shows the high and low of the last trading day and the second trading day, as well as the minimum and maximum of last week . There are many trading strategies on the daily levels. This indicator is indispensable when using such trading strategies. In fact, everything is simple in trading, you just need to understand and accept it for yourself. There is only price!!! What is price? This is the level on the chart. The level is the price that the

Currently switched to the 4 hour chart - but use other time frames for confirmation. :-) I change my main time frame based on the market movement at the time. The Hurricane Forex Indicator is a multi time frame indicator that includes such things as Trade Notifications, Trade Calculator, Momentum Indicator, risk reward and much more. We have a free Trade room for our users as well. Please check out the video for full details of how this indicator works as it has over 15 years worth of developme

The Elephant Candle is an indicator for MT4. It draws arrows when strong bullish or bearish candles appear. Strong candles frequently initiate a new trend. The arrows can be used in expert advisors. This indicator can improve already existing trading strategies. The indicator is very fast and doesn't repaint.
Inputs Period Candle Multiplier Candle Niceness [%] Arrow Size Enable Alert Enable Push Notification Enable Email

This indicator is another variant of the famous powerful indicator Fibonacci-SS https://www.mql5.com/en/market/product/10136 but has different behaviour in placing Pending Order and TP Line. Automatically places Fibonacci retracement lines from the last highest and lowest visible bars on the chart with: An auto Pending Order (Buy/Sell). Taking Profit 1, Taking Profit 2 is pivot point and Taking Profit 3 for extended reward opportunity. The best risk and reward ratio.
Simple and powerful indicat

Contact me after payment to send you the user manual PDF file. Introduction The moving average indicator is the most well-known and one of the most popular indicators among traders. It is very simple to work with, but a basic question has always become a big challenge among traders: What is the most optimal setting of the moving average for each chart-time frame? The answer to this question is very difficult, you have to try different settings of the moving average indicator for different chart
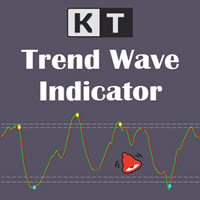
KT Trend Wave is an oscillator based on the combination of Price, Exponential, and Simple moving averages. It usually works great to catch the short term price reversals during the ongoing trending market. The bullish and bearish crossovers of the main and signal lines can be used as buy/sell signals (blue and yellow dot). It can also be used to find the overbought and oversold market. The buy and sell signals that appear within the overbought and oversold region are usually stronger.
Features
Engulfing Candle Signal Alert: Elevate Your Trading Strategy Unlock the full potential of your trading with the Engulfing Candle Signal Alert, the ultimate tool for identifying market reversals and enhancing your trading precision. Designed specifically for traders who value accuracy and timely alerts, this powerful indicator detects engulfing candle patterns, a key signal in technical analysis that often indicates a potential shift in market direction. What is an Engulfing Candle? An engu
FREE

Target Geometry is a next-generation indicator that uses the geometric nature of the markets to give high statistical probability levels ( Fibonacci ). This indicator creates a very important map that optimizes the entry points and it optimally defines your own money management. The indicator can be used both in static mode or in dynamic mode, you can use it on any financial instrument. The use in multi timeframe mode is a very good ally to have. The target levels are high statistical probabilit

Temel arz talep göstergesi , piyasa analizinizi geliştirmek ve herhangi bir grafikteki önemli fırsat alanlarını belirlemenize yardımcı olmak için tasarlanmış güçlü bir araçtır. Sezgisel ve kullanımı kolay bir arayüzle, bu ücretsiz Metatrader göstergesi size arz ve talep bölgelerinin net bir görünümünü sunarak daha bilinçli ve doğru ticaret kararları vermenizi sağlar / Ücretsiz MT5 sürümü Bu gösterge için Gösterge Tablosu Tarayıcısı: ( Basic Supply Demand Dashboard )
Özellikler
Gösterge, arz ve
FREE

"Wouldn't we all love to reliably know when a stock is starting to trend, and when it is in flat territory? An indicator that would somehow tell you to ignore the head fakes and shakeouts, and focus only on the move that counts?" The Choppiness Index is a non-directional indicator designed to determine if the market is choppy (trading sideways) or not choppy (trading within a trend in either direction). It is an oscillating indicator between -50 (very trendy) and +50 (very choppy). There are man
Bu, ihtiyaçlarınız için kullanabileceğiniz Ücretsiz bir üründür!
Ayrıca olumlu geri bildirimlerinizi de çok takdir ediyorum! Çok teşekkürler!
Yüksek kaliteli Trading Robotları ve Göstergelerini görmek için buraya tıklayın!
Crypto_Forex Göstergesi: MT4 için Heiken Ashi Mumları. Yeniden Boyama Yok. - Heiken_Ashi_Candles, resimde olduğu gibi Trend Çizgisi MA göstergesiyle harika bir kombinasyona sahiptir. - Gösterge Heiken_Ashi_Candles, trendi daha görünür hale getirmek için çok kullanışlı bir
FREE

Free Market structure zig zag to assist in price action trading the screenshots describe how to use and how to spot patterns new version comes with alerts, email alert and push notification alert can be used on all pairs can be used on all timeframes you can add additional confirmation indicators the indicator shows you your higher high and low highs as well as your lower lows and lower highs the indication makes price action analysis easier to spot.
FREE
Achieve Trading Precision with Perfect Entry Signal ! Stop guessing and start trading with confidence! The Perfect Entry Signal indicator cuts through the market noise, giving you clear, high-probability entry points. Built on a powerful, non-lagging moving average and filtered by the gold-standard EMA 200, this tool is designed to catch trends early and confirm your trading direction. It's not just a line on your chart—it's your personalized trading edge, delivering immediate, actionable signa
FREE
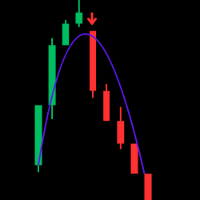
Trend WTS — Advanced Modular Trend & Signal Indicator for XAUUSD (M5 Optimized) Unlock precise trading insights with Trend WTS , a powerful and modular trend and signal indicator designed specifically for XAUUSD on the M5 timeframe. Built for traders seeking accuracy and clarity, Trend WTS combines fast moving average crossovers with a long-term EMA filter to deliver reliable buy and sell signals tailored for the gold market. Key Features: Dual Moving Average Trend Detection: Detect strong trend
FREE
# 33% off - limited time only #
ChartSync Pro MT4 is an indicator, designed for the MetaTrader 5 trading terminals. It enables the trader to perform better multi-timeframe technical analysis, by synchronizing symbols and objects into virtually unlimited charts. Built by traders for traders! Telegram Premium Support - Dd you purchase the Chart Sync indicator and need a bit of help? Send us a screenshot with your purchase and your Telegram ID so we can add you to our premium support Telegram
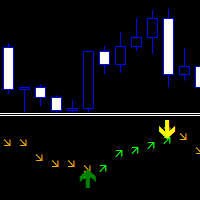
Direction Change Detector - Boğa ve ayı hareketleri arasındaki dengeyi ayıran bir trend göstergesi. Yönlerini doğrulayan işaretler içeren iki sıra ok bulunmaktadır.
Tek başına bir trend bulma göstergesi olarak veya işlem açmak ve sinyal yönlerini takip etmek için ek bir araç olarak kullanılabilir.
Her Pazar ve Zaman Dilimine Uyarlanabilir. Tarihteki tanıklığını yeniden resmetmez. Bildirimlerin birkaç türü vardır. Yukarıyı gösteren yeşil oklar yükseliş fiyat yönünü göstermektedir. Aşağıyı göstere
FREE
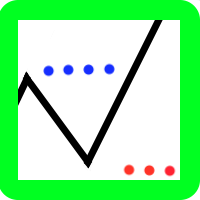
The indicator is a polyline (ZigZag segment) that tracks and connects the extreme points of the chart price that are at least a specified size apart from each other in points on the price scale.
The one and only setting is the minimum size (in points) of a ZigZag segment. The indicator displays levels to determine a possible trend reversal:
level "LevelForUp" - the breaking of this level determines the possible reversal of the trend up (to buy);
level " LevelForDown " - the breaking o

Huge 70% Halloween Sale for 24 hours only!
This indicator is unstoppable when combined with our other indicator called Support & Resistance . After purchase, send us a message and you will get it for FREE as a BONUS! Introducing Trend Punch , the revolutionary forex trend indicator that will transform the way you trade! Trend Punch is uniquely designed to provide precise buy and sell arrows during strong market trends, making your trading decisions clearer and more confident. Whether you
Bu gösterge, grafikte arz ve talep bölgeleri çizer. Kendi kurallarınız ve tekniklerinizle birleştiğinde, bu gösterge kendi güçlü sisteminizi yaratmanıza (veya geliştirmenize) olanak tanır. Lütfen çok daha fazlasını sunan ücretli sürümü de inceleyin. Tavsiyem, ilk bölge testinin en az 25 bardan sonra gerçekleştiği işlem fırsatlarını aramanızdır. Özellikler Bölgeler 3 renge sahiptir (girişle ayarlanabilir). Test edilmemiş bölge için koyu renk, test edilmiş bölge için orta renk ve bozuk bölge
FREE

Sizlere ON Trade Waves Patterns Harmonic Elliot Wolfe'u tanıtmaktan mutluluk duyarız. Bu, manuel ve otomatik yöntemleri kullanarak piyasada çeşitli desenleri tespit etmek için tasarlanmış gelişmiş bir göstergedir. İşte nasıl çalıştığı: Harmonik Desenler: Bu gösterge, grafiğinizde görünen harmonik desenleri tanımlayabilir. Bu desenler, Scott Carney'in "Harmonic Trading vol 1 & 2" adlı kitabında açıklandığı gibi harmonik ticaret teorisini uygulayan tüccarlar için önemlidir. Onları manuel olarak ç

Otomatik Bağlı VWAP'lar ile Ticaretteki İçgörüleri Keşfedin: Otomatik Bağlı VWAP'lar , ticaret dünyasında rehberiniz olarak hizmet eder. Bu göstergeler, kritik piyasa dönüm noktalarını belirler ve VWAP çizgilerini kullanarak grafiğinizde gösterir. Bu, bağlı VWAP stratejilerini kullanan tüccarlar için bir oyun değiştiricidir. Nasıl Çalışır? Yüksek Noktaları Tanımlama: Eğer mevcut mumun en yüksek fiyatı önceki mumun en yüksek fiyatından düşükse, Ve önceki yüksek, ondan öncekinden daha yüksekse, Bi

Notice : The description is temporarily unavailable while we perform troubleshooting on this section.
Change in State Delivery (CiSD). The Change in State delivery (CiSD) is a microstructure indicator that identifies critical pivotal points where the market (Price delivery Algorithm) shifts its directional focus from seeking liquidity on one side of the market to the other. Specifically, it signals a transition from buyside-driven liquidity to sellside-driven liquidity. CiSD marks the precis
FREE

Trend Line Map indicator is an addons for Trend Screener Indicator . It's working as a scanner for all signals generated by Trend screener ( Trend Line Signals ) . It's a Trend Line Scanner based on Trend Screener Indicator. If you don't have Trend Screener Pro Indicator, the Trend Line Map Pro will not work.
LIMITED TIME OFFER : Trend Line Map Indicator is available for only 50 $ and lifetime. ( Original price 125$ )
By accessing to our MQL5 Blog, you can find all our premium indicators wit

Gold Buster M1 System , XAUUSD çifti üzerindeki M1 çizelgeleri için profesyonel bir ticaret sistemidir. Ancak, sistem başlangıçta yalnızca altın ticareti için geliştirilmiş olmasına rağmen, sistem diğer bazı döviz çiftleriyle de kullanılabilir. Satın alma işleminden sonra size XAUUSD'ye ek olarak sistemle kullanılabilecek işlem çiftlerinin bir listesini vereceğim, bu da bu sistemi kullanma olanaklarınızı genişletecektir. SİSTEMDEKİ TÜM GÖSTERGELER TEKRARLAMA YAPMAYIN! Bu sistem üç göstergeden ol

We have combined all of our beloved indicators the likes of: Key level order block , Key level supply and demand , Key level liquidity grab and Key level wedge into one single indicator and dashboard.
Whats new Dashboard : There is an easy access dashboard for all your needs. Multi-timeframe button : There is now a multi-timeframe option for Order Blocks and Supply and demand zones, making it easy to see higher timeframe zones easily on the current timeframe by just clicking the desired timefra

The indicator finds candlestick patterns based on Gregory L.' Morris "Candlestick Charting Explained: Timeless Techniques for Trading Stocks and Futures". If a pattern is detected, the indicator displays a message at a bar closure. If you trade using the MetaTrader 5 terminal, then you can download the full analogue of the " Candle Pattern Finder for MT5 " indicator It recognizes the following patterns: Bullish/Bearish (possible settings in brackets) : Hammer / Shooting Star (with or without con
Volume Profile Order Blocks - A smarter way to visualize liquidity, volume, and key levels. Volume Profile Order Blocks is a cutting-edge indicator that enhances traditional order block strategies by embedding a detailed volume profile directly within each zone. This provides traders with a clear, data-driven view of where institutional interest may lie — not just in price, but in volume distribution. MT5 Version - https://www.mql5.com/en/market/product/146215/ Join To Learn Market Depth

Gold Pro Scalper
Precise entry points for currencies, crypto, metals, stocks, indices! Indicator 100% does not repaint!!!
If a signal appeared, it does not disappear! Unlike indicators with redrawing, which lead to loss of deposit, because they can show a signal, and then remove it.
Trading with this indicator is very easy.
Wait for a signal from the indicator and enter the deal, according to the arrow
(Blue arrow - Buy, Red - Sell).
I recommend using it with the Trend Filter (download

SuperTrend Alert MT4 ile piyasa trendlerini ustalıkla yönetin; forex, hisse senedi, kripto para ve emtia ticareti için hassas trend takibi sinyalleri sağlamak üzere tasarlanmış güçlü bir göstergedir. Forex Factory ve Reddit’in r/Forex gibi işlem topluluklarında övülmekte ve Investopedia ile TradingView’deki tartışmalarda sağlam trend tespitiyle takdir edilmekte olup, güvenilir giriş ve çıkış noktaları arayan traderlar için vazgeçilmez bir araçtır. Kullanıcılar, SuperTrend sinyallerini fiyat hare
FREE

Pivot Point Fibo RSJ, Fibonacci oranlarını kullanarak günün destek ve direnç çizgilerini izleyen bir göstergedir.
Bu muhteşem gösterge, Fibonacci oranlarını kullanarak Pivot Point üzerinden 7 seviyeye kadar destek ve direnç oluşturur. Fiyatların, bir operasyonun olası giriş/çıkış noktalarını algılamanın mümkün olduğu bu destek ve direncin her bir düzeyine uyması harika.
Özellikleri 7 seviyeye kadar destek ve 7 seviye direnç Seviyelerin renklerini ayrı ayrı ayarlayın
Girişler Pivot Tipi Pivo
FREE
KT Trend Trading Suite, trend takibi stratejisini birden fazla kırılma noktasıyla birleştiren çok özellikli bir göstergedir. Bu kırılma noktaları giriş sinyali olarak kullanılır.
Yeni bir trend oluştuğunda, bu gösterge o trendi yakalayabilmek için birçok giriş fırsatı sunar. Daha az önemli giriş noktalarını filtrelemek için bir geri çekilme eşiği kullanılır.
MT5 sürümüne buradan ulaşabilirsiniz https://www.mql5.com/en/market/product/46270
Özellikler
Piyasa dinamiklerini tek bir denklem içi

ACB Breakout Arrows göstergesi, özel bir kırılma modelini tespit ederek piyasada kritik bir giriş sinyali sağlar. Gösterge, belirli bir yönde güçlenen momentumu sürekli tarar ve büyük bir hareket başlamadan hemen önce doğru giriş sinyalini verir.
Çoklu sembol ve çoklu zaman dilimi tarayıcıyı buradan edinin - ACB Breakout Arrows MT4 için Tarayıcı
Temel Özellikler Gösterge, Stop Loss ve Take Profit seviyelerini otomatik olarak sağlar. Tüm zaman dilimlerinde kırılma sinyallerini takip eden MTF Ta
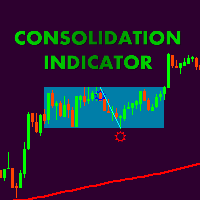
Сonsolidation box indicator with possibility of flexible settings according to the traiders requipments. Also, it is possible to embed indicatior in EA. Thank Alexey Mavrin for realization of technical task. According to the classic technical analysis the price is in motion without a clear direction for almost 70% of the market time and methods of getting profit from flat should be in the arsenal of any trader. Price consolidation- are periods of market equilibrium when supply and demand are app

Title: Price Action Pro - Advanced Multi-Timeframe Reversal Scanner "Experience the full power of 'Price Action Pro' completely on EURUSD!" Product Overview: Price Action Pro is not just another candlestick pattern indicator. It is a complete trading system designed to detect high-probability reversal setups. Unlike standard indicators that spam signals on every pattern, Price Action Pro uses a Smart Swing Filter to ensure patterns are only detected at valid swing highs or lows. Combined with Mu
FREE

The ZhiBiJuJi indicator analysis system uses a powerful internal loop to call its own external indicators, and then calls the analysis before and after the cycle. The data calculation of this indicator analysis system is very complicated (calling before and after the cycle), so the hysteresis of the signal is reduced, and the accuracy of the advance prediction is achieved. This indicator can be used in all cycles on MT4, and is most suitable for 15 minutes, 30 minutes, 1 hour, 4 hours. Buy:
Visit our all-new Stein Investments Welcome Page to get the latest information, updates and trading strategies. Do you want to become a constantly profitable 5-star forex trader? Then get our Stein Investments trading tools and send us a screenshot to get your personal invitation to our exclusive trading chat with 500+ members.
FX Trend displays the trend direction, duration, intensity and the resulting trend rating for all time frames in real time.
You'll see at a glance at which dire

The most crucial price level in any "Volume Profile" is the "Point of Control" . Is the price level with the highest traded volume. And mainly, is the level where the big guys start there their positions, so it's an accumulation/distribution level for smart money.
The idea of the indicator arose after the "MR Volume Profile Rectangles" indicator was made. When creating the "MR Volume Profile Rectangles" indicator, we spent a lot of time comparing the volumes with those from the volume profile

Fiyat Dalga Modeli MT4 --(ABCD Modeli)-- hoş geldiniz ABCD modeli, teknik analiz dünyasında güçlü ve yaygın olarak kullanılan bir ticaret modelidir.
Tüccarların piyasadaki potansiyel alım ve satım fırsatlarını belirlemek için kullandıkları uyumlu bir fiyat modelidir.
ABCD modeliyle, tüccarlar potansiyel fiyat hareketlerini tahmin edebilir ve alım satımlara ne zaman girip çıkacakları konusunda bilinçli kararlar verebilir. EA Sürümü : Price Wave EA MT4
MT5 sürümü: Price Wave Patter
FREE

Simetrik bir üçgen grafik paterni, fiyat yükselmeye veya kırılmaya zorlanmadan önceki bir daralma ve konsolidasyon dönemini temsil eder. Alt trend çizgisinden bir kırılma, yeni bir düşüş eğiliminin başlangıcını işaret ederken, üst trend çizgisinden bir kırılma, yeni bir yükseliş trendinin başlangıcını gösterir. Simetrik üçgen kalıpları için takas ettiğiniz tüm enstrümanları ve zaman dilimlerini bir kerede izlemek için kontrol panelini edinin! https://www.mql5.com/en/market/product/69169/
MT5 S

I prepared an indicator Showing BUY and SELL probability by checking Higher Time Frames... It’s quick, easy to read, and free. Enjoy, and let me know how it boosts your trading! By tweaking the timeframe weightings , smoothing , and support/resistance influence , you can adapt the indicator’s Buy/Sell probabilities to your personal trading style. Keep an eye on both the on-chart labels and subwindow histogram to quickly see when the bias shifts, then combine this with your own trading rules for
FREE

Free automatic Fibonacci is an indicator that automatically plots a Fibonacci retracement based on the number of bars you select on the BarsToScan setting in the indicator. The Fibonacci is automatically updated in real time as new highest and lowest values appears amongst the selected bars. You can select which level values to be displayed in the indicator settings. You can also select the color of the levels thus enabling the trader to be able to attach the indicator several times with differe
FREE
Special offer : ALL TOOLS , just $35 each! New tools will be $30 for the first week or the first 3 purchases ! Trading Tools Channel on MQL5 : Join my MQL5 channel to update the latest news from me Genel Bakış
OA SnR Power, destek ve direnç seviyelerinin gücünü belirlemek ve değerlendirmek için tasarlanmış güçlü bir araçtır. Ticaret hacmi, geri dönüş sıklığı ve yeniden test sayısı gibi önemli faktörleri bir araya getirerek bu gösterge, piyasadaki kritik fiyat bölgelerine ilişkin k
FREE
TMA Stochastic is an indicator based on stochastic oscillator and tma bands indicator , this indicator is based on a reversal strategy . Recommended time frame : 15 and above Recommended settings : lower values for scalping , higher values for swing trading Try the free version : https://www.mql5.com/en/market/product/108379 ======================================================================= Parameters : tma history : how many bars back to show tma bands on stochastic K period (Stochasti
FREE

A simple indicator that automatically highlights all FVGs (Fair Value Gaps) formed on the chart, as well as FVGs on history. It is possible to select colors for FVGs of different directions (long or short), select the time interval, select the color of middle point and you can also choose whether to delete filled FVGs or leave them on the chart (the option is beneficial for backtesting). The indicator can be very useful for those, who trade according to the concept of smart money, ICT, or simply
FREE
How To Determine If The Market is Strong Or Weak?
Strength Meter uses an Adaptive Algorithm That Detect Price Action Strength In 4 Important Levels! This powerful filter gives you the ability to determine setups with the best probability.
Features Universal compatibility to different trading systems Advance analysis categorized in 4 levels Level 1 (Weak) - Indicates us to WAIT. This will help avoid false moves Weak Bullish - Early signs bullish pressure Weak Bearish - Early signs bearish press

Shadow System Candles - AI Trend Visualization
Concept "Stop trading in the dark. Equip your chart with Night Vision."
Shadow System Candles is the visual core of the "Shadow Operation" project. It eliminates market noise and visualizes the true direction of the trend using AI-based logic (ADX + MA integration).
Note: This tool does not generate buy/sell arrows. It is designed to train your eyes to recognize "Active Trends" and "Dangerous Ranges.
Key Features ・AI Logic Coloring[/b]: Automat
FREE

Индикатор строит блоки заказов (БЗ) по торговой системе (ТС) Романа. Поиск блоков осуществляется одновременно на двух таймфремах: текущем и старшем (определяемым в настройках). Для оптимизации и игнорирования устаревших блоков в настройках задается ограничение количества дней в пределах которых осуществляется поиск блоков. Блоки строятся по правилам ТС состоящем из трех шагов: какую свечу вынесли (что?); какой свечой вынесли (чем?); правило отрисовки (как?).
FREE
MT4 Sürümü: https://www.mql5.com/en/market/product/157679 MT5 Sürümü: https://www.mql5.com/en/market/product/157680
Destek Direnç — Akıllı Piyasa Yapısı Seviyeleri
Profesyonel yatırımcılar ve otomatik sistemler için tasarlanmış, temiz, akıllı ve son derece güvenilir bir Destek ve Direnç göstergesi.
Destek Direnç, Fraktallar, ATR tabanlı fiyat segmentasyonu ve çoklu zaman dilimi analizini birleştiren gelişmiş bir kümeleme algoritması kullanarak gerçek piyasa seviyelerini tespit etmek üzere ta
FREE

Kârlı ticaret fırsatlarını kolaylıkla belirlemenize yardımcı olabilecek güçlü bir forex ticaret göstergesi mi arıyorsunuz? Beast Super Signal'den başka bir yere bakmayın. Bu kullanımı kolay trend tabanlı gösterge, sürekli olarak piyasa koşullarını izleyerek yeni gelişen trendleri araştırır veya mevcut trendlere atlar. Canavar Süper Sinyali, tüm dahili stratejiler birbiriyle uyumlu ve %100 örtüştüğünde bir al ya da sat sinyali vererek ek onay ihtiyacını ortadan kaldırır. Sinyal oku uyarısını aldı
Scalping Edge Pro Indicator Unleash the Power of Precision Trading: Introducing Scalping Edge Pro Tired of market noise and conflicting signals that cloud your judgment? Are you searching for a tool that delivers the clarity and confidence needed to seize rapid opportunities in volatile markets? Scalping Edge Pro is the engineered solution designed for traders who demand precision and professionalism in every trade. It is meticulously calibrated for peak performance on the 15-minute (M15) timef
FREE
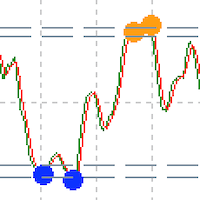
About RSI CyberZingFx RSI, a powerful MT4 indicator designed to provide traders with accurate signals and insights into the strength or weakness of a stock or market. Whether you are a seasoned trader or just starting out, CyberZingFx RSI can help you make informed trading decisions. Indicator Features
One of the standout features of CyberZingFx RSI is its unique technique for finding the best entry points to trade. By analyzing historical data and identifying oversold or overbought levels, thi
FREE
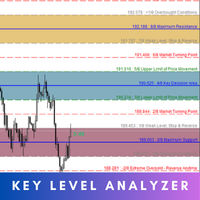
Key Level Analyzer – Know Better, Trade Smarter Key Level Analyzer is a powerful trading tool designed to provide precise market insights by identifying high-probability price zones , market turning points , and key decision areas . Unlike traditional indicators, it uses a smart algorithm to dynamically calculate support, resistance, and balance zones, helping traders make informed, data-driven decisions . MT5 Version - https://www.mql5.com/en/market/product/132810/ With real-time updates, mul
SURE REVERSAL, bir histogram aşırı satın alınma/aşırı satım tipi göstergedir ve bir öküz veya ayı piyasası hareketini gösteren önemli tersine dönüş noktalarını verir Bu gösterge, hareketli ortalama ile RSI göstergesi arasında bir füzyondur, bu gösterge yeniden boyanmazdır ve gecikmezdir. Parametreler : Ma dönemi Ma Yöntemi Ma Fiyatı Emin Dönemi (Rsi) Emin Fiyat (Rsi) ==============
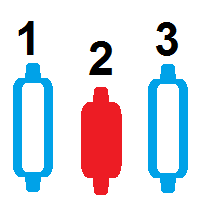
şamdan sayaç göstergesi bu gösterge, herhangi bir zaman diliminde yer alan mumları sayar mt4'te indirebileceğiniz ücretsiz bir bar sayacı şamdan sayacı, daha büyük bir grafiğin içinde kaç mum olduğunu sayar Bu mum sayacıyla otomatik mum sayımı yapabilirsiniz Çubukları otomatik olarak indirip saymanız için ücretsiz şamdan sayım göstergesi bar counter to count the bars count candle counter indicator mt4 count candle MT5 için mum sayacı Bu göstergeyle ilgileniyorsanız, onu geliştirmeye devam edebil
FREE

BUY INDICATOR AND GET EA FOR FREE AS A BONUS + SOME OTHER GIFTS! ITALO LEVELS INDICATOR is the best levels indicator ever created, and why is that? Using high volume zones on the market and Fibonacci the Indicator works on all time-frames and assets, indicator built after 7 years of experience on forex and many other markets. You know many levels indicators around the internet are not complete, does not help, and it's difficult to trade, but the Italo Levels Indicator is different , the Ital

Unleash Your Trading Potential with the Ultimate Trend Sniper Are you tired of missing out on major market moves? Want to spot trends with laser-like precision? The Ultimate Trend Sniper is a powerful, yet easy-to-use indicator designed to help you do just that. It's not just another moving average—it's a smart tool that gives you a clear edge in the market. Main Features & Benefits: Precision Entry & Exit Signals: The indicator uses two advanced T3 moving averages to generate highly accurate bu
FREE

First time on MetaTrader, introducing IQ Star Lines - an original Vedic Astrology based indicator. "Millionaires don't use astrology, billionaires do" . - J.P. Morgan, Legendary American financier and banker.
IQ Star Lines, an unique astrological indicator purely based on Vedic astrology calculations, published for the first time on Metatrader. This unique tool plots dynamic planetary grid lines based on real-time stars, constellations, and celestial movements, which allows you to plot t
The indicator allows you to instantly determine the current trend by color and FIBO levels. Higher Timeframe the panel shows the current trend of higher periods, helping to determine the strength of the trend Trade according to the trend when changing the color of candles or trade against the trend when the price hit the extreme levels of the FIBO Trend PRO indicator Advantages of the FIBO Trend PRO
Indicator never repaint and does not change their values Very easy to use and intuitive
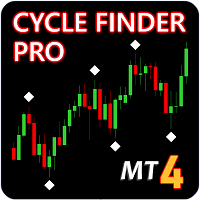
Update - Version 4.0 now includes trend change signal. Indicator will tell you the current trend on all charts. Update - Version 5.0 now includes alerts for mt4, push and email notifications.
Cycle Finder Pro is a chart reading indicator and is designed for trend and pattern traders . Chart reading is time consuming and complex and requires knowledge of price action , cyclicity, and time frame correlation . Cycle Finder Pro reads all this in one simple indicator so you can spot trend and char

Huge 70% Halloween Sale for 24 hours only!
After purchase, please contact me to get your trading tips + more information for a great bonus!
Lux Trend is a professional strategy based on using Higher Highs and Lower Highs to identify and draw Trendline Breakouts! Lux Trend utilizes two Moving Averages to confirm the overall trend direction before scanning the market for high-quality breakout opportunities, ensuring more accurate and reliable trade signals. This is a proven trading system u
Özel teklif : ALL TOOLS , her biri sadece $35 ! Yeni araçlar $30 olacaktır ve ilk hafta veya ilk 3 satın alma için geçerlidir! Trading Tools Channel on MQL5 : En son haberleri almak için MQL5 kanalımı takip edin Specter Trend Cloud , piyasa yönünü ve kritik yeniden test fırsatlarını vurgulamak üzere tasarlanmış, hareketli ortalamalara dayalı bir trend görselleştirme aracıdır. Uyarlanabilir ortalamaları oynaklık ayarıyla birleştirerek, trend değişimlerinde tersine dönen renkli bir “bu

TopBottom Checker , fiyatın diplerini ve tepelerini belirleyen bir göstergedir. Gösterge herhangi bir döviz çifti ile kullanılabilir. Gösterge, M1'den D1'e kadar herhangi bir zaman diliminde çalışır. Gösterge, bağımsız bir ticaret sistemi olarak veya kullandığınız herhangi bir ticaret sisteminin parçası olarak kullanılabilir, çünkü bu gösterge, piyasanın kesinlikle herhangi bir strateji için çok önemli olan yönleriyle çalışır. Gösterge sinyalleri hem trendle birlikte giriş yapmak için, hem tersi
Read detailed blogpost with screenshots here: https://www.mql5.com/en/blogs/post/764306 Note: This is the MT4 only version. Get the MT5 version here: https://www.mql5.com/en/market/product/150789
Features Kalman smoothing to reduce market noise. Supertrend bands for trend direction. Color-coded dots and arrows for quick reading. Arrow signals for trend continuation. Custom Timeframe for drawing bands Alerts for trend changes. Adjustable inputs for different styles.
How to Use
Green dots = bul

Currency Strength Gauge incicator
The currency strength gauge is an indicator to measure of the strength or weakness of currencies in the Forex market. Comparing the strength of currencies in a graphic representation will lead to a good overview of the market and its future trends. You will see in a graphic chart both the strength of the currencies and their correlation, and this will help you in your decisions to get better trades. -To easy detection of over Overbought and Oversold points,
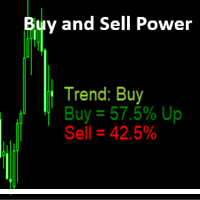
Simple Indicator that shows the Buy and Sell volume in percent.
Settings : Font size for percentage labels Horizontal offset from right edge (pixels) Vertical offset for Signal label from bottom (pixels) Vertical offset for Buy label from bottom (pixels) Vertical offset for Sell label from bottom (pixels) Color for Buy label Color for Sell label Color for Strong Buy signal Color for Buy signal Color for Strong Sell signal Color for Sell signal Color for Neutral signal Default to every tick
FREE

Ya da E Oving bir verage S upport R esistance Gruplar.
MASR Bantları göstergesi, destek ve direnç seviyeleri olarak birlikte çalışan iki bantla çevrili hareketli bir ortalamadır. İstatistiksel olarak, MASR Bantları zamanın %93'ünde fiyat mumları içerir. Adımlarda şu şekilde hesaplanır: 1. İlk adım, bir X dönemi için en yüksek yüksek (HHV) ve en düşük düşük (LLV) hesaplamaktır.
2. İkinci adım, aralarındaki mesafenin yüzde olarak ne kadar geniş olduğunu bulmak için HHV'yi LLV'ye bölmektir. Bu
Gravity Timing Indicator -GTI-
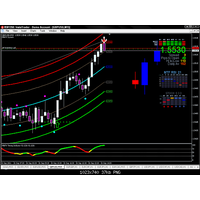
GTI göstergesi şimdiye kadarki en kolay ve en doğru göstergedir. destek ve direnci yerçekimi şeklinde kullanır. Üzerinde çalışmak çok kolaydır, en güçlüleri en düşük ve en yüksek çizgiler olan 7 çizgiden oluşur. gösterge geri döner, girmek için en iyi zamandır.
istisnasız tüm çiftlerde çalışır
Zaman çerçevesi olarak, ölçekleme için 5 dakika ve 15 dakika gibi küçük zaman dilimlerini tercih ederim.
FREE

Scalper Arrow x is a buy sell arrow type indicator, the strategy behind its signals is based on the MFI indicator with trend filter using Halftrend formula, this indicator can be used alone or mixed with other tools. NOTE : THIS INDICATOR DOESN'T REPAINT OR BACK PAINT, AND ITS ARROW SIGNALS ARE NOT DELAYED. ---------------------------------------------------------------
FREE
MetaTrader platformunun uygulama mağazası olan MetaTrader mağazasından bir alım-satım robotunun nasıl satın alınacağını öğrenin.
MQL5.community ödeme sistemi, PayPal, banka kartları ve popüler ödeme sistemleri aracılığıyla yapılan işlemleri destekler. Daha iyi bir müşteri deneyimi için satın almadan önce alım-satım robotunu test etmenizi şiddetle tavsiye ederiz.
Alım-satım fırsatlarını kaçırıyorsunuz:
- Ücretsiz alım-satım uygulamaları
- İşlem kopyalama için 8.000'den fazla sinyal
- Finansal piyasaları keşfetmek için ekonomik haberler
Kayıt
Giriş yap
Gizlilik ve Veri Koruma Politikasını ve MQL5.com Kullanım Şartlarını kabul edersiniz
Hesabınız yoksa, lütfen kaydolun
MQL5.com web sitesine giriş yapmak için çerezlerin kullanımına izin vermelisiniz.
Lütfen tarayıcınızda gerekli ayarı etkinleştirin, aksi takdirde giriş yapamazsınız.