YouTube'dan Mağaza ile ilgili eğitici videoları izleyin
Bir alım-satım robotu veya gösterge nasıl satın alınır?
Uzman Danışmanınızı
sanal sunucuda çalıştırın
sanal sunucuda çalıştırın
Satın almadan önce göstergeyi/alım-satım robotunu test edin
Mağazada kazanç sağlamak ister misiniz?
Satış için bir ürün nasıl sunulur?
MetaTrader 4 için teknik göstergeler - 6

RSI divergence indicator finds divergences between price chart and RSI indicator and informs you with alerts (popup, mobile notification or email). Its main use is to find trend reversals in the chart. Always use the divergence indicators with other technical assets like support resistance zones, candlestick patterns and price action to have a higher possibility to find trend reversals. Three confirmation type for RSI divergences: RSI line cross 50 level (doesn't repaint) Price returns to
FREE

"Dragon's Tail" is an integrated trading system, not just an indicator. This system analyzes each candle on a minute-by-minute basis, which is particularly effective in high market volatility conditions. The "Dragon's Tail" system identifies key market moments referred to as "bull and bear battles". Based on these "battles", the system gives trade direction recommendations. In the case of an arrow appearing on the chart, this signals the possibility of opening two trades in the indicated directi

The indicator displays volume clusters or volume profiles to choose from.
Input variables
StepPoint - cluster step in points, if the value is zero, the step is assigned automatically. AssociatedTimeframe - binding the indicator to the specified timeframe of the chart, if the value is equal to Current, the indicator works on all timeframes. ClustersVolume - volume in clusters: All - all volume. Active - active volume (which produced the price movement). ClustersAsDelta - difference betwee

Supply Demand Analyzer is an advanced trading indicator meticulously designed for the precise identification, analysis, and management of supply and demand zones. By integrating real-time data and advanced algorithms, this tool enables traders to recognize market phases, price movements, and structural patterns with unparalleled accuracy. It simplifies complex market dynamics into actionable insights, empowering traders to anticipate market behavior, identify trading opportunities, and make info
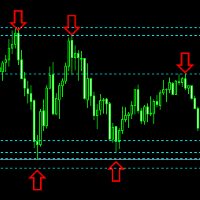
.....................................hi....................... ................for showing high s and low s and support and resistanses .....................we have a lot of ways............................... it can be helpful for finding trends , higher highs , higher lows , lower highs , lower lows
.......................today i write on of thems.......................... ........................you can enter the number of last support and resistanses .........................and it will dra
FREE

Algoritma, göstergeye UPD1 Trend Direction dayalı düşük oynaklık bölgelerini bulur ve göstergeye UPD1 Volume Box dayalı maksimum yatay hacim oluşturur. Kural olarak, birikimden çıkarken güçlü bir eğilim hareketi meydana gelir. Fiyat birikimden ayrıldıysa, maksimum yatay hacmini (POC) test edebilir. Akıllı uyarılar ayarlarda mevcuttur.
Giriş parametreleri.
Temel ayarlar. Bars Count – Göstergenin çalışacağı tarih çubuklarının sayısı. Timeframe Flat - Flat'in arandığı ve kümenin oluşturulduğu za
FREE

1.Satışta kullanılan temel stratejilerden biridir. Bu, eski hediye ve talep yasalarına, özgür akışan bir pazarda fiyat trenleri de odaklanıyor. Bu stratejinin temeli, ulaşılabilir aletlerin miktarı ve alıcıların araçlarının talebi fiyatı belirlemesi. Çizelgede, talep edilen bölgeleri (talep bölgeleri), fiyatlarını arttırmak veya temsil talep (temin bölgeleri), fiyatlarını düşürmek üzere alanları işaretlendiriyor. Çoğu temin ve talep eden ticaretin, büyük satış ve satış faaliyetlerinin uzun ya da
FREE
Special offer : ALL TOOLS , just $35 each! New tools will be $30 for the first week or the first 3 purchases ! Trading Tools Channel on MQL5 : Join my MQL5 channel to update the latest news from me Genel Bakış
OA SnR Power, destek ve direnç seviyelerinin gücünü belirlemek ve değerlendirmek için tasarlanmış güçlü bir araçtır. Ticaret hacmi, geri dönüş sıklığı ve yeniden test sayısı gibi önemli faktörleri bir araya getirerek bu gösterge, piyasadaki kritik fiyat bölgelerine ilişkin k
FREE

ADR Uyarı Gösterge Tablosu, normal ortalama günlük aralığa göre fiyatın şu anda nerede işlem gördüğünü bir bakışta size gösterir. Fiyat, ortalama aralığı ve seçtiğiniz seviyenin üzerindeki seviyeleri aştığında, açılır pencere, e-posta veya push yoluyla anında uyarılar alacaksınız, böylece hızlı bir şekilde geri çekilmelere ve geri dönüşlere atlayabilirsiniz. Çizgi, boş bir çizelgeye yerleştirilmek üzere tasarlanmıştır ve sadece arka planda oturun ve seviyelere ulaşıldığında sizi uyarır, böylece

EZT Trend göstergesi size trendi, geri çekilmeyi ve giriş fırsatlarını gösterecektir. İsteğe bağlı filtreleme ve her türlü uyarı mevcuttur. E-posta ve anlık bildirim uyarıları eklendi. Ayrıca bu göstergeyi temel alan ve yakında kullanıma sunulacak bir EA da geliştiriyoruz.
İki renkli histogram ve bir çizgiden oluşan çok işlevli bir göstergedir. Bu, bir trendin yönünün ve gücünün görsel bir temsilidir; ayrıca çizgide veya histogramda birçok kez sapma bulacaksınız.
Gösterge, otomatik parametre

The indicator automatically builds Support/Resistance levels (Zones) from different timeframes on one chart.
Support-resistance levels are horizontal lines. As a rule, the market does not respond to a specific price level, but to a price range around the level, because demand and supply of market participants are not formed clearly on the line, but are “spread out” at a certain distance from the level.
This indicator determines and draws precisely such a price range within which strong positi
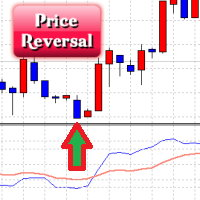
The Price Reversal oscillator identifies the potential price reversal points, while being in the overbought/oversold zones. It also displays the entry signals against the trend (sometimes these points coincide with the beginning of a new trend) (blue and red zones) and the entry points by the trend (gray areas). It consists of two lines. The blue line is the fast line, the red line is the slow one. The market entry is recommended if the value of the fast line is greater than 60 or less than -60,
SR PrevPeriods MT4 Genel Bakış
SR PrevPeriods, MetaTrader 4 grafiğinde önceki günün, önceki haftanın ve önceki ayın en yüksek ve en düşük seviyelerini gerçek zamanlı olarak çizer. Hafif bir indikatör olup, fiyat tepkisi bölgeleri, kırılma seviyeleri ve yeniden denge alanlarıyla sıkça örtüşen tarihi destek ve direnç bölgelerini vurgulamak için tasarlanmıştır. Ne Yapar
Önemli geçmiş seviyelere yatay çizgiler çizer ve istenirse tam fiyat bilgisini gösteren metin etiketleri ekler. Çizgiler her yen
FREE
Hi Trader, ================================================================================ If you like my indicator, please do not hesitate to give a review and/or comment. Thank you! ================================================================================
This indicator draws trade entry zone and target levels based on the levels of the previous day.
A blue zone (BUY) or red zone (SELL) is drawn and two targets. The optimal trade entry value is also indicated.
A second gray zone is
FREE
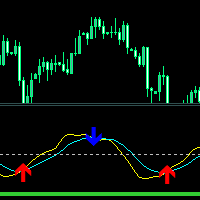
Crossing Line Indicator - Trend yönündeki dürtü hareketlerinin erken tespiti için tasarlanmış bir indikatördür.
RVI göstergesi üzerine kurulu yumuşatma ve davranış değişikliği özelliğine sahip bir osilatör içerir. İki ince çizgi kesiştiğinde, fiyatta bir değişim anı meydana gelir ve bunun sonucunda bir dürtü veya yoğun bir hareket meydana gelebilir.
Trend yönünü belirlemeye yarayan gösterge ağırlıklı MA göstergeleridir. Kalın açık yeşil çizgi, merkez seviyesinin altında ise trend aşağı yönlü, ü
FREE

The Supply and Demand Zone Indicator is a powerful and easy-to-use tool designed to help traders identify critical supply and demand zones on the chart. These zones can provide valuable insight into potential market reversals, breakouts, and important price levels where buyers or sellers are likely to take control. The best FREE Trade Manager . If you want to create your own Hedging or Grid strategies without any coding make sure to check out the ManHedger Key Features: Automatic Zone Detect
FREE
Trend Line PRO göstergesi bağımsız bir işlem stratejisidir. Trend değişimini, işleme giriş noktasını gösterir ve ayrıca üç seviyede Kar Al ve Zarar Durdur korumasını otomatik olarak hesaplar. Trend Line PRO , tüm Meta Trader sembolleri için mükemmeldir: para birimleri, metaller, kripto para birimleri, hisse senetleri ve endeksler.
Gösterge, gerçek hesaplarda işlem yaparken kullanılır ve bu da stratejinin güvenilirliğini doğrular.
Trend Line PRO ve gerçek Sinyal kullanan robotlar burada bu
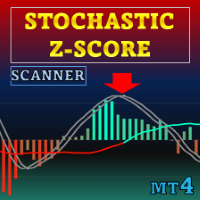
Özel teklif : TÜM ARAÇLAR , her biri sadece $35 ! Yeni araçlar ilk hafta veya ilk 3 satın alma için $30 olacaktır! MQL5’te Trading Tools Kanalı : Benden gelen en son haberler için MQL5 kanalıma katılın Stochastic Z-Score, fiyatı Z-Score ile normaleştirip stokastik mantıkla sınırlandıran ve HMA ile yumuşatan bir moment osilatörüdür; uzun vadeli bağlam için ALMA kullanır. İsteğe bağlı öğeler arasında histogram, dinamik bantlar ve dönüş etiketleri bulunur.
MT5 sürümü için bkz.: Stochast

Speed Trend Matrix Ultimate (Sürüm 5.10) Speed Trend Matrix (STM) , tek bir gösterge içinde kapsüllenmiş kapsamlı bir ticaret sistemidir. Yalnızca aşırı alım veya aşırı satım koşullarını gösteren standart osilatörlerin aksine, STM piyasa volatilitesine (ATR) göre fiyat hareketinin "hızını" analiz eder. Yalnızca trend yönünü değil, aynı zamanda hareketin arkasındaki gücü de belirler ve trader'ların sıklıkla yanlış sinyallere yakalandığı düşük momentumlu "Düz (Flat)" dönemleri filtreler. Bu araç,

Free Market structure zig zag to assist in price action trading the screenshots describe how to use and how to spot patterns new version comes with alerts, email alert and push notification alert can be used on all pairs can be used on all timeframes you can add additional confirmation indicators the indicator shows you your higher high and low highs as well as your lower lows and lower highs the indication makes price action analysis easier to spot.
FREE

Bu gösterge, düz ve trend yerlerini göstermek için kullanılır. Tasarım osilatöre dayanmaktadır. Hem normal grafiklerde hem de ikili opsiyonlarda işlem yapmak için ek bir filtre olarak kullanılır. Düz noktalar, Smart Money kavramına uygun olarak ticaret yapmak için göstergede UPD1 Volume Cluster kullanılır. Yerleşik bir uyarı, en yüksek aşırı alım / aşırı satım yerlerini işaret eder.
Giriş parametreleri.
Temel ayarlar. Bars Count - Göstergenin görüntüleneceği çubuk sayısını belirtin. Period -
FREE

Bu gösterge, alış veya satış baskısı için her çubuğu tarar ve en yüksek hacme sahip 4 tip mum modelini tanımlar. Bu mumlar daha sonra Alış veya Satış sinyallerini göstermek için birkaç doğrusal filtre kullanılarak filtrelenir. Sinyaller, daha yüksek zaman çerçevesi yönüyle bağlantılı olarak ve yüksek hacimli saatlerde alım satım yapıldığında en iyi sonucu verir. Tüm filtreler özelleştirilebilir ve bağımsız çalışır. Bir düğmeyi tıklayarak tek bir yönün sinyallerini görüntüleyebilir. Bu gösterge

WPR Candle Sniper – Precision Reversal Arrows on the Current Candle! Discover the ultimate edge in momentum trading with WPR Candle Sniper, a powerful MT4 indicator based on the classic Williams Percent Range (WPR) oscillator. This tool delivers crystal-clear buy and sell arrow signals directly on the current (live) candle, allowing you to act instantly without waiting for bar closure.
Key Features: Non-Repainting & No Redraw – Once an arrow appears, it stays fixed forever. No frustrating sign
The Magic Histogram indicator is a universal tool, suitable for scalping and medium-term trading. This indicator uses an innovative formula and allows you to determine the direction and strength of the trend. Magic Histogram is not redrawn, so you can evaluate its efficiency using history data. It is most suitable for M5, M15, M30, H1 and H4. Version for the MetaTrader 5 terminal : https://www.mql5.com/en/market/product/58448
Indicator Benefits Excellent indicator signals! Suitable for beginne

This indicator watch the Fibonacci retracement for levels and timeframes selected by the trader. In the workload of day trading, having your eyes on all the timeframes to validate some information, for Fibonacci traders, is really time consuming and requires constant focus. With this in mind, this tool allows you to have your attention on other trading details while this one monitors the retracements of each timeframe in real time. In the charts, this indicator data (retracement %, age of the r

VR Donchian göstergesi, Donchian kanalının geliştirilmiş bir versiyonudur. İyileştirmeler kanalın neredeyse tüm işlevlerini etkiledi ancak ana işletim algoritması ve kanal yapısı korundu. Mevcut trende bağlı olarak top göstergesine seviyelerin renginde bir değişiklik eklendi - bu, yatırımcıya trendde veya yatayda bir değişiklik olduğunu açıkça gösterir. Yatırımcıyı akıllı telefon, e-posta veya MetaTrader terminalinde iki kanal seviyesinden birinin kırılması hakkında bilgilendirme yeteneği eklend
FREE
Açıklama
SMA Reentry, ana trend içerisinde yeniden giriş noktalarını belirlemek için tasarlanmış bir MetaTrader 4 göstergesidir. Kısa vadeli hareketleri yakalamak için hızlı bir Basit Hareketli Ortalama (SMA) ve genel piyasa yönünü filtrelemek için yavaş bir SMA kullanır. Hızlı SMA yavaş SMA’nın üzerinde olduğunda ve fiyat, önceki mumda altına düştükten sonra tekrar üzerine çıktığında alım sinyali oluşur. Hızlı SMA yavaş SMA’nın altında olduğunda ve fiyat, önceki mumda üzerine çıktıktan sonra t
FREE

Trading doesn’t have to be complicated. With the right visual guidance, market decisions become clearer, calmer, and more confident.
Nebula Arrow is designed to help traders focus on what truly matters: high-quality entries based on refined market behavior. Just load it on your chart and let the arrows guide your trading decisions. Trade With Confidence We believe that simplicity is power. Nebula Arrow was created after extensive market observation and practical research, transforming complex
FREE

This is an advanced multi-timeframe version of the popular Hull Moving Average (HMA). Features Graphical panel with HMA indicator data from all timeframes at the same time . If the HMA has switched its direction on any timeframe, a question mark or exclamation mark is displayed on the panel, accompanied by a text and audio message. The messages can be configured separately for each timeframe using the corresponding checkboxes.
The indicator is located in a separate window, so as not to overload
Bu gösterge, grafikte arz ve talep bölgeleri çizer. Kendi kurallarınız ve tekniklerinizle birleştiğinde, bu gösterge kendi güçlü sisteminizi yaratmanıza (veya geliştirmenize) olanak tanır. Lütfen çok daha fazlasını sunan ücretli sürümü de inceleyin. Tavsiyem, ilk bölge testinin en az 25 bardan sonra gerçekleştiği işlem fırsatlarını aramanızdır. Özellikler Bölgeler 3 renge sahiptir (girişle ayarlanabilir). Test edilmemiş bölge için koyu renk, test edilmiş bölge için orta renk ve bozuk bölge
FREE
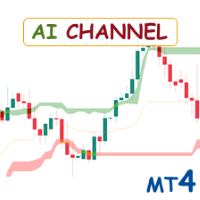
Special offer : ALL TOOLS , just $35 each! New tools will be $30 for the first week or the first 3 purchases ! Trading Tools Channel on MQL5 : Join my MQL5 channel to update the latest news from me AI Channels göstergesi, kümeleme analizinde güçlü bir makine öğrenimi tekniği olan kayan K-means kümeleme kullanarak temel fiyat eğilimleri hakkında gerçek zamanlı bilgiler sağlar. Bu gösterge, kümelenmiş fiyat verilerine dayalı uyarlanabilir kanallar oluşturur ve yatırımcıların eğilim y
FREE

Fiyat Dalga Modeli MT4 --(ABCD Modeli)-- hoş geldiniz ABCD modeli, teknik analiz dünyasında güçlü ve yaygın olarak kullanılan bir ticaret modelidir.
Tüccarların piyasadaki potansiyel alım ve satım fırsatlarını belirlemek için kullandıkları uyumlu bir fiyat modelidir.
ABCD modeliyle, tüccarlar potansiyel fiyat hareketlerini tahmin edebilir ve alım satımlara ne zaman girip çıkacakları konusunda bilinçli kararlar verebilir. EA Sürümü : Price Wave EA MT4
MT5 sürümü: Price Wave Patter
FREE

The indicator determines the state of the market (trend or flat) using the upgraded Bollinger Bands of higher timeframes and colors the bars in trend/flat colors. The indicator also gives signals (arrow on the chart + Sound and notification to Mail, Push):
signal at the beginning of every new trend; signal inside the trend (entry at the end of the correction) Signals are never redrawn!
How to use the indicator? The indicator works very well intraday. When using the indicator for intraday (TF M
MT4 için Piyasa Yapısı Kayması ve Adil Değer Boşluğu (FVG) Göstergesi Bu MT4 göstergesi, piyasa yapısındaki kaymaları ve adil değer boşluklarını (FVG'ler) belirleyerek yatırımcılara potansiyel alım satım fırsatları sunar. Kullanıcıları bu olaylar hakkında mobil bildirimler yoluyla uyararak, değişen piyasa koşullarına hızlı bir şekilde tepki vermelerini sağlar. Temel Özellikler: Piyasa Yapısı Kayması Tespiti: Salınım yüksek/düşük kırılımlarına ve ortalamaya göre önemli ölçüde büyük bir mum gövde
FREE

Temel arz talep göstergesi , piyasa analizinizi geliştirmek ve herhangi bir grafikteki önemli fırsat alanlarını belirlemenize yardımcı olmak için tasarlanmış güçlü bir araçtır. Sezgisel ve kullanımı kolay bir arayüzle, bu ücretsiz Metatrader göstergesi size arz ve talep bölgelerinin net bir görünümünü sunarak daha bilinçli ve doğru ticaret kararları vermenizi sağlar / Ücretsiz MT5 sürümü Bu gösterge için Gösterge Tablosu Tarayıcısı: ( Basic Supply Demand Dashboard )
Özellikler
Gösterge, arz ve
FREE

Gösterge mevcut sembol üzerinde kârı (zararı) gösterir. Mevcut kar veya zararı görüntülemek için çizgiyi serbestçe sürükleyip bırakabilirsiniz.
You can find my products here
Parametreler Calculation in money or in points — kar/zararı puan veya para cinsinden hesaplayın. Add pending orders to calculate — hesaplamalarda bekleyen siparişleri dikkate alın. Magic Number (0 - all orders on symbol) — belirli sıraları değerlendirmek gerekiyorsa sihirli sayı. Offset for first drawing (points from t
FREE
Açıklama
Market Phase Analyzer, piyasanın üç ana aşamasını belirlemek için tasarlanmış gelişmiş bir göstergedir: Birikim (Accumulation) , Manipülasyon (Manipulation) ve Dağıtım (Distribution) .
Otomatik seans analizi sayesinde gösterge Asya Kutusunu (Asia Box) çizer, kritik seviyelerin üzerinde veya altında oluşan sweep hareketlerini tespit eder ve ters dönüşleri doğrulamak için ATR filtresini kullanarak yanlış sinyalleri azaltır. Başlıca Özellikler Özelleştirilebilir Asya seansı kutusunu vurgu
FREE

The "Easy Ichimoku Wave Meter" indicator is a basic tool to automatically determine Waves according to Ichimoku!
The indicator gives the possibility to simultaneously apply the Wave Theory, Time Theory and Target Price Theory according to the "Little Ichimoku" strategy developed by Sense Hosoda on the MT4 platform. The use of this tool allows not only novice traders to instantly (fully automatic) determine the waves and their rapid interpretation, it also allows to automatically measure the pr

The market is unfair if only because 10% of participants manage 90% of funds. An ordinary trader has slim changes to stand against these "vultures". This problem can be solved. You just need to be among these 10%, learn to predict their intentions and move with them. Volume is the only preemptive factor that faultlessly works on any timeframe and symbol. First, the volume appears and is accumulated, and only then the price moves. The price moves from one volume to another. Areas of volume accumu
Engulfing Candle Signal Alert: Elevate Your Trading Strategy Unlock the full potential of your trading with the Engulfing Candle Signal Alert, the ultimate tool for identifying market reversals and enhancing your trading precision. Designed specifically for traders who value accuracy and timely alerts, this powerful indicator detects engulfing candle patterns, a key signal in technical analysis that often indicates a potential shift in market direction. What is an Engulfing Candle? An engu
FREE
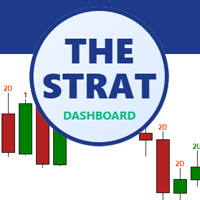
The Strat Dashboard - Rob Smith’in “The Strat” Stratejisi için Çoklu Sembol Tarayıcı Gerçek Zamanlı Çoklu Sembol Analiziyle İşlemlerinizi Dönüştürün The Strat Dashboard, Rob Smith’in ünlü “The Strat” fiyat hareketi stratejisini kullanan trader’lar için özel olarak tasarlanmış profesyonel bir göstergedir.
Birden fazla sembolü aynı anda farklı zaman dilimlerinde izleyin, yüksek olasılıklı formasyonları anında bulun ve hiçbir fırsatı kaçırmayın. MT5 Version :- https://www.mql5.com/en/market/pro

MT4 Multi-timeframe Order Blocks detection indicator. Features - Fully customizable on chart control panel, provides complete interaction. - Hide and show control panel wherever you want. - Detect OBs on multiple timeframes. - Select OBs quantity to display. - Different OBs user interface. - Different filters on OBs. - OB proximity alert. - ADR High and Low lines. - Notification service (Screen alerts | Push notifications). Summary Order block is a market behavior that indicates order collection

BUY INDICATOR AND GET NEW EXCLUSIVE EA FOR FREE AS A BONUS! ITALO ARROWS INDICATOR is the best reversal indicator ever created, and why is that? Using extreme reversal zones on the market to show the arrows and Fibonacci numbers for the Take Profit, also with a panel showing all the information about the signals on the chart, the Indicator works on all time-frames and assets, indicator built after 8 years of experience on forex and many other markets. You know many reversal indicators around t
Buy Sell Signal Low TF gives buy/sell signals and alerts with up and down arrow at potential reversal of a pullback or a trend continuation pattern in low timeframe. This is an indicator which gives signals based on trend => It works best in trend market with the principle is to ride on the trend not trade against the trend.
The components of Buy Sell Signal Low TF: - The trend is determined by SMMA 13 , SMMA 21 and SMMA 35 ( can be changed manually to suit your preference). - The signal is b
FREE

EnergyX Indicator EnergyX is a unique tool that visualizes the "energy" of the market in a separate window. It helps you quickly see when energy is rising or falling, making it easier to spot potential trading opportunities. Yellow bars show when energy is increasing. Red bars show when energy is decreasing. How to Use: When price is approaching a resistance level: If energy is high and increasing (yellow), there is a higher chance the price will break the resistance. You may consider a buy

It identifies the pivot, support, and resistance price levels of the selected timeframe and then draws lines onto the chart. FEATURES: Option to specify the Timeframe Period in the PivotSR calculation. Option to display the PivotSR of the last candle, of every candle, or of the current candle. Options for displaying labels, line thickness, and line color. PivotSR can be interpreted as reversal levels or past price reactions that can be used as the basis for current price analysis. Some traders b
FREE

Scalper Arrow x is a buy sell arrow type indicator, the strategy behind its signals is based on the MFI indicator with trend filter using Halftrend formula, this indicator can be used alone or mixed with other tools. NOTE : THIS INDICATOR DOESN'T REPAINT OR BACK PAINT, AND ITS ARROW SIGNALS ARE NOT DELAYED. ---------------------------------------------------------------
FREE

About: Someone recently shared a pinescript with me. And asked me to convert it to MT4. I found the FVG blocks very effective as SR areas. So here it is. Enjoy!!
What are Fair Value Gaps (FVG)? Fair Value Gaps occur when price moves so quickly that it creates an imbalance between buyers and sellers. These gaps represent areas where price "skipped" levels, creating potential zones for price to return and "fill the gap". Think of it as unfinished business in the market that often gets revisited.
FREE

Currency Strength Meter is the easiest way to identify strong and weak currencies. This indicator shows the relative strength of 8 major currencies + Gold: AUD, CAD, CHF, EUR, GBP, JPY, NZD, USD, XAU. Gold symbol can be changed to other symbols like XAG, XAU etc.
By default the strength value is normalised to the range from 0 to 100 for RSI algorithm: The value above 60 means strong currency; The value below 40 means weak currency;
This indicator needs the data of all 28 major currency pairs a
Quants hareketli ortalama eğim, yön göstergesi ve momentum vermek için çok güçlü bir göstergedir. Gösterge yeniden boyanmıyor. Ma açısını verimli bir şekilde hesaplayabilir ve trendi bulabilirsiniz.
Sinyal mumu kapandığında kâr sayımı başlar. Yani canlı olacak kesin sonuçlardır.
Önerilen TimeFrame bunu H1'de kullanıyor. Göstergenin tüm seçenekleri düzenlenebilir.
İpuçları : Salınım ve trend koparma yönleriyle ticaret yapın. fraktallar, renko çubukları ve bolinger bantları doğruluğu ve karlılı
FREE

Altın Trend - bu iyi bir hisse senedi teknik göstergesidir. Gösterge algoritması, bir varlığın fiyat hareketini analiz eder ve oynaklığı ve potansiyel giriş bölgelerini yansıtır.
En iyi gösterge sinyalleri:
- SATIŞ için = kırmızı histogram + kırmızı KISA işaretçi + aynı yönde sarı sinyal oku + kırmızı trend yön oku. - AL için = mavi histogram + mavi UZUN işaretçi + aynı yönde aqua sinyal oku + mavi trend yön oku.
Göstergenin faydaları:
1. Gösterge yüksek doğrulukta sinyaller üretir. 2.

Tanıtım Quantum Breakout PRO , Breakout Bölgeleri ile ticaret yapma şeklinizi değiştiren çığır açan MQL5 Göstergesi! 13 yılı aşkın ticaret deneyimine sahip deneyimli tüccarlardan oluşan bir ekip tarafından geliştirilen Quantum Breakout PRO , yenilikçi ve dinamik koparma bölgesi stratejisiyle ticaret yolculuğunuzu yeni zirvelere taşımak için tasarlanmıştır.
Kuantum Breakout Göstergesi, size 5 kar hedefi bölgesi ile kırılma bölgelerinde sinyal okları ve kırılma kutusuna dayalı olara
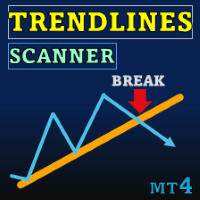
Special offer : ALL TOOLS , just $35 each! New tools will be $30 for the first week or the first 3 purchases ! Trading Tools Channel on MQL5 : Join my MQL5 channel to update the latest news from me Trendlines with Breaks Scanner , traderların kritik trendleri tanımlamasına ve gerçek zamanlı olarak kırılmaları tespit etmesine yardımcı olmak için tasarlanmış son teknoloji bir ticaret aracıdır. Pivot noktalarına dayalı olarak otomatik üretilen trend çizgileri sayesinde, bu gösterge tr
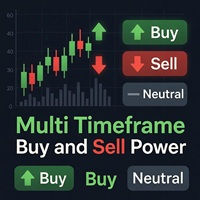
Multi Timeframe Buy and Sell Power MT4
The Multi Timeframe Buy and Sell Power indicator for MetaTrader 4 is a versatile tool designed to provide traders with a clear visual representation of market pressure across nine standard timeframes, from M1 to MN1. By aggregating buy and sell strength percentages derived from recent price action and tick volume, it helps identify potential trends, reversals, and neutral conditions in real-time. The indicator displays this information in a compact dashbo
FREE
Fiyat eylemi ticaretinizi Higher Highs and Lows MT4 göstergesiyle geliştirin, anahtar salınım noktalarını belirlemek için fraktal analizi kullanan sağlam bir araç, Higher Highs (HH), Lower Highs (LH), Lower Lows (LL) ve Higher Lows (HL) gibi trend tanımlayan pattern'leri tanımlayarak pazar yönüne net içgörüler sağlar. 1900'lerin başındaki Dow Teorisi'nde kök salmış temel fiyat eylemi ilkelerine dayanan ve modern ticarette Al Brooks gibi uzmanlar tarafından "Trading Price Action" serisinde popüle
FREE
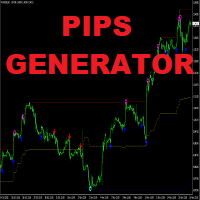
Apollo Pips Generator , trend yönünde sinyaller veren göstergedir. Gösterge, birden fazla giriş noktası sağlar, böylece her zaman kâr etmek için bir ticaret fırsatı bulabilirsiniz. Ekran görüntülerine dikkat edin. Ekran görüntüleri, Pips Generator aracını, kanal tarafından üstleri ve altları gösteren yıldız sinyalleriyle temsil edilen diğer aracımla birlikte gösterir. Bu kombinasyon, sistemi nasıl uygulayabileceğiniz konusunda size birçok yol sunar. Satın aldıktan sonra İKİNCİ GÖSTERGEMİ ÜCRETSİ

Bu bilgi göstergesi her zaman hesaptaki güncel durumdan haberdar olmak isteyenler için faydalı olacaktır. Gösterge, puan cinsinden kâr, yüzde ve para birimi gibi verilerin yanı sıra mevcut çiftin spreadini ve mevcut zaman diliminde çubuğun kapanmasına kadar geçen süreyi görüntüler. VERSİYON MT5 - Daha kullanışlı göstergeler
Bilgi satırını grafiğe yerleştirmek için birkaç seçenek vardır: Fiyatın sağında (fiyatın arkasında); Yorum olarak (grafiğin sol üst köşesinde); Ekranın seçilen köşesinde.
FREE
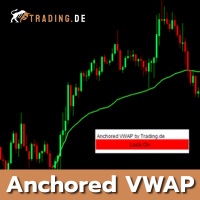
With the Anchored VWAP for MT4 from Trading.de, you can easily calculate and display the volume-based average price starting from a specific point in the chart (anchor). The indicator is ideal for our Trading.de 1-minute chart strategy, but can also be used in all other timeframes. The AVWAP for MetaTrader 4 is calculated using volume or an average period. In the settings, you can specify whether or not to use real trading volume. The indicator also has a "Lock" button in the upper right corner
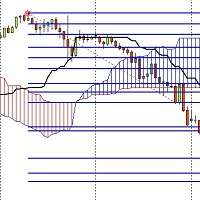
I have developed an indicator based on both the fibo musang strategy and the price breaking of the ichimoku cloud and it has amazing results
the features are:
1- Once activated it give you the trend where you are from the chart
2- After a trend change it gives you an alert on PC or notification on your phone if you are away.
3- It sends you the exact prices to take an order and 3 take profit levels and your stoploss.
4- It works on every timeframes from 1m to MN.
5- It works on pairs and C

The indicator plots higher timeframe Kijun-sen (of Ichimoku ) on lower timeframes.
To change timeframes, in the timeframe field enter the number:
M1 PERIOD_M1 1 1 minute. M5 PERIOD_M5 5 5 minutes. M15 PERIOD_M15 15 15 minutes. M30 PERIOD_M30 30 30 minutes. H1 PERIOD_H1 60 1 hour. H4 PERIOD_H4 240 4 hour. D1 PERIOD_D1 1440 Daily. W1 PERIOD_W1 10080 Weekly. MN1 PERIOD_MN1 43200 Monthly.
By default, the Kijun is shifted 3 periods forward but if you wish to have it exactly as

The GGP Squeeze Momentum MT4 Indicator is a volatility and momentum tool designed to help traders optimize their trading performance and providing traders with actionable insights to make well-informed trading decisions. This indicator is MT4 conversion of the Squeeze Momentum Indicator by “LazyBear “ in Trading View website and some alert methods are added to provide real-time alerts when a trading signal is generated, in order to allow traders to act quickly and efficiently. For MT5 version p

Currently switched to the 4 hour chart - but use other time frames for confirmation. :-) I change my main time frame based on the market movement at the time. The Hurricane Forex Indicator is a multi time frame indicator that includes such things as Trade Notifications, Trade Calculator, Momentum Indicator, risk reward and much more. We have a free Trade room for our users as well. Please check out the video for full details of how this indicator works as it has over 15 years worth of developme

This indicator is another variant of the famous powerful indicator Fibonacci-SS https://www.mql5.com/en/market/product/10136 but has different behaviour in placing Pending Order and TP Line. Automatically places Fibonacci retracement lines from the last highest and lowest visible bars on the chart with: An auto Pending Order (Buy/Sell). Taking Profit 1, Taking Profit 2 is pivot point and Taking Profit 3 for extended reward opportunity. The best risk and reward ratio.
Simple and powerful indicat

Contact me after payment to send you the user manual PDF file. Introduction The moving average indicator is the most well-known and one of the most popular indicators among traders. It is very simple to work with, but a basic question has always become a big challenge among traders: What is the most optimal setting of the moving average for each chart-time frame? The answer to this question is very difficult, you have to try different settings of the moving average indicator for different chart
50% off. Original price: $60 (Ends on February 15) Triangle Finder is a multi symbol multi timeframe dashboard that monitors and finds symmetrical triangle pattern in 28 symbols and 9 timeframes with a deep scan feature to scan all market watch symbols (up to 1000 instruments!).
Download Demo here (Scans only M1 and M5) Settings description here MT5 version here
Triangle Finder features: Realtime monitoring of 28 customizable instruments and 9 timeframes at the same time. Deep scan mode

Introducing the "Extreme Exhaustion Levels": A powerful tool for traders looking to identify market exhaustion and potential trend reversals. The Exhaustion Indicator is an advanced technical analysis tool that helps traders identify when markets are overbought or oversold, potentially indicating an imminent reversal in the trend. With a unique combination of price action, moving averages, and Bollinger Bands, the Exhaustion Indicator provides traders with a comprehensive view of market condit
Cheap Rate limited COPIES HURRY UP! 5 LEFT COPIES Very precise patterns to detect High Accurate Order Blocks: It Draw zone after market Structure Breakout with a high Accuracy, institutional orders with the potential to change the price’s direction and keep moving towards it, have been placed. Features Auto Order Blocks Draw MTF Order Blocks Double Signal One Alert Signal Second Long Wick Rejection Signal Market Structure BOS LINE This Indicator is limited features if you want full Feature
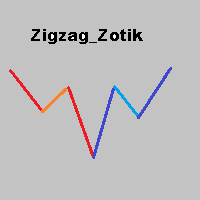
The Zigzag Zotik indicator displays the price movement in the form of a zigzag based on the AO_Zotik indicator values. The Zigzag Zotik indicator displays the trend movements and their corrections. The AO_Zotik indicator consists of three lines moving relative to "0": "main" line; "support and resistance" line; "balance" line. The "main" line crossing the "support and resistance" line indicates the end of one wave and the beginning of the other. The Zigzag Zotik indicator displays this on the ch

This indicator was created as an MT4 version inspired by a TMA RSI Divergence indicator found on TradingView.
This indicator detects both Regular and Hidden divergences using RSI pivot points, similar to TradingView's pivot-based divergence logic.
-------------------------------------------------- Features -------------------------------------------------- • Regular Bullish / Bearish divergence • Hidden Bullish / Bearish divergence • Pivot-based detection (Left / Right bars) • Optional RSI SM
FREE

YOU CAN NOW DOWNLOAD FREE VERSIONS OF OUR PAID INDICATORS . IT'S OUR WAY OF GIVING BACK TO THE COMMUNITY ! >>> GO HERE TO DOWNLOAD
The Volatility Ratio was developed by Jack D. Schwager to identify trading range and signal potential breakouts. The volatility ratio is defined as the current day's true range divided by the true range over a certain number of days N (i.e. N periods). The following formula is used to calculate the volatility ratio: Volatility Ratio (VR) = Today's True Range/Tru
FREE
MetaTrader mağazası - yatırımcılar için alım-satım robotları ve teknik göstergeler doğrudan işlem terminalinde mevcuttur.
MQL5.community ödeme sistemi, MetaTrader hizmetlerindeki işlemler için MQL5.com sitesinin tüm kayıtlı kullanıcıları tarafından kullanılabilir. WebMoney, PayPal veya banka kartı kullanarak para yatırabilir ve çekebilirsiniz.
Alım-satım fırsatlarını kaçırıyorsunuz:
- Ücretsiz alım-satım uygulamaları
- İşlem kopyalama için 8.000'den fazla sinyal
- Finansal piyasaları keşfetmek için ekonomik haberler
Kayıt
Giriş yap
Gizlilik ve Veri Koruma Politikasını ve MQL5.com Kullanım Şartlarını kabul edersiniz
Hesabınız yoksa, lütfen kaydolun
MQL5.com web sitesine giriş yapmak için çerezlerin kullanımına izin vermelisiniz.
Lütfen tarayıcınızda gerekli ayarı etkinleştirin, aksi takdirde giriş yapamazsınız.