
MQL5 Tarif Defteri MQL5'te Çok Sembollü Volatilite Göstergesi Geliştirme

Giriş
Bu makalede, çok sembollü bir volatilite göstergesinin geliştirilmesini ele alacağız. Çok sembollü göstergelerin geliştirilmesi, acemi MQL5 geliştiricileri için bazı zorluklar ortaya çıkabilir, bu makale de bunun açıklığa kavuşturulmasına yardımcı olur. Çok sembollü bir göstergenin geliştirilmesi sırasında ortaya çıkan önemli sorunlar, diğer sembollerin verilerinin mevcut sembole göre senkronize edilmesi, bazı gösterge verilerinin olmaması ve belirli bir zaman aralığının "true" çubuklarının başlangıcının tanımlanması ile ilgilidir. Bu konuların tamamı makalede yakından ele alınacaktır.
İşleyiciye göre her sembol için önceden hesaplanmış Ortalama Gerçek Aralık (ATR) göstergesinin değerlerini elde edeceğiz. Örnekleme amacıyla, adları göstergenin harici parametrelerinde ayarlanabilen altı sembol olacak. Girilen adların doğruluğu kontrol edilecek. Parametrelerde belirtilen belirli bir sembol genel listede mevcut değilse, bunun için hesaplama yapılmayacaktır. Tüm mevcut semboller, burada halihazırda mevcut değilse Piyasa İzleme penceresine eklenecektir.
"MQL5 Tarif Defteri: Gösterge Alt Pencere Kontrolleri - Kaydırma Çubuğu" makalesinde, metni yazdırabileceğiniz ve hatta çizim yapabileceğiniz tuval hakkında konuşmuştuk. Bu sefer, tuval üzerine çizim yapmayacağız, bunun yerine bunu, kullanıcının belirli bir zamanda neler olduğunu bilmesini sağlayan mevcut program süreçleri hakkında mesajlar görüntülemek için kullanacağız.
Gösterge Geliştirme
Hadi programın geliştirmeye başlayalım. MQL5 Sihirbazını kullanarak, özel bir gösterge şablonu oluşturun. Birkaç değişiklikten sonra, aşağıda gösterilen kaynak kodunu elde etmeniz gerekir:
//+------------------------------------------------------------------+
//|                                               MultiSymbolATR.mq5 |
//|                        Copyright 2010, MetaQuotes Software Corp. |
//|                                              http://www.mql5.com |
//+------------------------------------------------------------------+
//--- Indicator properties
#property copyright "Copyright 2010, MetaQuotes Software Corp."
#property link      "http://www.mql5.com"
#property version   "1.00"
#property indicator_separate_window // Indicator is in a separate subwindow
#property indicator_minimum 0       // Minimum value of the indicator
#property indicator_buffers 6       // Number of buffers for indicator calculation
#property indicator_plots   6       // Number of plotting series
//+------------------------------------------------------------------+
//| Custom indicator initialization function                         |
//+------------------------------------------------------------------+
int OnInit()
  {
//--- Initialization completed successfully
   return(INIT_SUCCEEDED);
  }
//+------------------------------------------------------------------+
//| Deinitialization                                                 |
//+------------------------------------------------------------------+
void OnDeinit(const int reason)
  {
  }
//+------------------------------------------------------------------+
//| Custom indicator iteration function                              |
//+------------------------------------------------------------------+
int OnCalculate(const int      rates_total,     // Size of input time series
                const int      prev_calculated, // Bars processed at the previous call
                const datetime &time[],         // Opening time
                const double   &open[],         // Open prices
                const double   &high[],         // High prices
                const double   &low[],          // Low prices
                const double   &close[],        // Close prices
                const long     &tick_volume[],  // Tick volumes
                const long     &volume[],       // Real volumes
                const int      &spread[])       // Spread
  {
//--- Return the size of the data array of the current symbol
   return(rates_total);
  }
//+------------------------------------------------------------------+
//| Timer function                                                   |
//+------------------------------------------------------------------+
void OnTimer()
  {
  }
//+------------------------------------------------------------------+
Fikrimizi uygulamak için, bu şablonu gereken şeyler ile daha fazla dolduracağız. Zamanlayıcı ihtiyacı makalenin devamında açıklanacaktır. Sabitleri başta, belirli gösterge özelliklerinden hemen sonra ekleyelim:
//--- Constants
#define RESET           0 // Returning the indicator recalculation command to the terminal
#define LEVELS_COUNT    6 // Number of levels
#define SYMBOLS_COUNT   6 // Number of symbols
LEVELS_COUNT sabiti, "Yatay Çizgi" türünde (OBJ_HLINE) grafik nesneleri ile temsil edilen seviye sayısının değerini içerir. Bu seviyelerin değerleri göstergenin harici parametrelerinde belirtilebilir.
Projeye özel grafikleri ile çalışma sınıfına sahip bir dosya ekleyelim:
//--- Include the class for working with the canvas
#include <Canvas\Canvas.mqh>
Harici parametrelerde, iATR ortalama dönemi, volatilitesi görüntülenmesi gereken sembollerin adları ve yatay seviye değerlerini belirteceğiz. Semboller, ilk sembol göstergenin eklendiği grafiğe sahip sembol olarak değerlendirildiğinden, 2'den başlayarak numaralandırılmıştır.
//--- External parameters
input  int              IndicatorPeriod=14;       // Averaging period
sinput string dlm01=""; //- - - - - - - - - - - - - - - - - - - - - - - - - - -
input  string           Symbol02       ="GBPUSD"; // Symbol 2
input  string           Symbol03       ="AUDUSD"; // Symbol 3
input  string           Symbol04       ="NZDUSD"; // Symbol 4
input  string           Symbol05       ="USDCAD"; // Symbol 5
input  string           Symbol06       ="USDCHF"; // Symbol 6
sinput string dlm02=""; //- - - - - - - - - - - - - - - - - - - - - - - - - - -
input  int              Level01        =10;       // Level 1
input  int              Level02        =50;       // Level 2
input  int              Level03        =100;      // Level 3
input  int              Level04        =200;      // Level 4
input  int              Level05        =400;      // Level 5
input  int              Level06        =600;      // Level 6
Kodun devamında, daha sonra çalışmak için tüm global değişkenleri ve dizileri oluşturmalıyız. Bunların tamamı ayrıntılı yorumlar ile aşağıdaki kodda sağlanmaktadır:
//--- Global variables and arrays
CCanvas           canvas;                 // Loading the class
//--- Variables/arrays for copying data from OnCalculate()
int               OC_rates_total     =0;  // Size of input time series
int               OC_prev_calculated =0;  // Bars processed at the previous call
datetime          OC_time[];              // Opening time
double            OC_open[];              // Open prices
double            OC_high[];              // High prices
double            OC_low[];               // Low prices
double            OC_close[];             // Close prices
long              OC_tick_volume[];       // Tick volumes
long              OC_volume[];            // Real volumes
int               OC_spread[];            // Spread
//--- Structure of buffers for drawing indicator values
struct buffers {double data[];};
buffers           atr_buffers[SYMBOLS_COUNT];
//--- Structure of time arrays for data preparation
struct temp_time {datetime time[];};
temp_time         tmp_symbol_time[SYMBOLS_COUNT];
//--- Structure of arrays of the ATR indicator values for data preparation
struct temp_atr {double value[];};
temp_atr          tmp_atr_values[SYMBOLS_COUNT];
//--- For the purpose of storing and checking the time of the first bar in the terminal
datetime          series_first_date[SYMBOLS_COUNT];
datetime          series_first_date_last[SYMBOLS_COUNT];
//--- Time of the bar from which we will start drawing
datetime          limit_time[SYMBOLS_COUNT];
//--- Indicator levels
int               indicator_levels[LEVELS_COUNT];
//--- Symbol names
string            symbol_names[SYMBOLS_COUNT];
//--- Symbol handles
int               symbol_handles[SYMBOLS_COUNT];
//--- Colors of indicator lines
color             line_colors[SYMBOLS_COUNT]={clrRed,clrDodgerBlue,clrLimeGreen,clrGold,clrAqua,clrMagenta};
//--- String representing the lack of the symbol
string            empty_symbol="EMPTY";
//--- Indicator subwindow properties
int               subwindow_number        =WRONG_VALUE;              // Subwindow number
int               chart_width             =0;                        // Chart width
int               subwindow_height        =0;                        // Subwindow height
int               last_chart_width        =0;                        // Last saved chart width
int               last_subwindow_height   =0;                        // Last saved subwindow height
int               subwindow_center_x      =0;                        // Horizontal center of the subwindow
int               subwindow_center_y      =0;                        // Vertical center of the subwindow
string            subwindow_shortname     ="MS_ATR";                 // Short name of the indicator
string            prefix                  =subwindow_shortname+"_";  // Prefix for objects
//--- Canvas properties
string            canvas_name             =prefix+"canvas";          // Canvas name
color             canvas_background       =clrBlack;                 // Canvas background color
uchar             canvas_opacity          =190;                      // Opacity
int               font_size               =16;                       // Font size
string            font_name               ="Calibri";                // Font
ENUM_COLOR_FORMAT clr_format              =COLOR_FORMAT_ARGB_RAW;    // Color components should be correctly set by the user
//--- Canvas messages
string            msg_invalid_handle      ="Invalid indicator handle! Please wait...";
string            msg_prepare_data        ="Preparing data! Please wait...";
string            msg_not_synchronized    ="Unsynchronized data! Please wait...";
string            msg_load_data           ="";
string            msg_sync_update         ="";
string            msg_last                ="";
//--- Maximum number of bars specified in the terminal settings
int               terminal_max_bars=0;
Göstergeyi grafiğe yüklerken, OnInit() fonksiyonu aşağıdaki eylemleri gerçekleştirecektir:
- gösterge özelliklerinin ayarlanması;
- çizim serileri çizme dizilerinin belirlenmesi;
- dizilerin başlatılması;
- harici parametrelerde belirtilen sembollerin Piyasa İzleme penceresine eklenmesi;
- parametrelerin doğruluğunun kontrol edilmesi ve gösterge işleyicilerini elde etmek için ilk denemenin yapılması.
Tüm bu eylemler, ayrı fonksiyonlarda düzenlenirse daha uygun bir şekilde ele alınacaktır. Bunun sonucunda, OnInit() fonksiyonu kaynak kodunun anlaşılması aşağıda gösterildiği şekilde çok kolay hale gelecektir:
//+------------------------------------------------------------------+
//| Custom indicator initialization function                         |
//+------------------------------------------------------------------+
int OnInit()
  {
//--- Check input parameters for correctness
   if(!CheckInputParameters())
      return(INIT_PARAMETERS_INCORRECT);
//--- Set the timer at 1-second intervals
   EventSetTimer(1);
//--- Set the font to be displayed on the canvas
   canvas.FontSet(font_name,font_size,FW_NORMAL);
//--- Initialization of arrays
   InitArrays();
//--- Initialize the array of symbols
   InitSymbolNames();
//--- Initialize the array of levels
   InitLevels();
//--- Get indicator handles
   GetIndicatorHandles();
//--- Set indicator properties
   SetIndicatorProperties();
//--- Get the number of bars specified in the terminal settings
   terminal_max_bars=TerminalInfoInteger(TERMINAL_MAXBARS);
//--- Clear the comment
   Comment("");
//--- Refresh the chart
   ChartRedraw();
//--- Initialization completed successfully
   return(INIT_SUCCEEDED);
  }
Yukarıdaki kodda kullanılan özel fonksiyonlara daha yakından bakalım. CheckInputParameters() fonksiyonunda, harici parametrelerin doğruluğunu kontrol ederiz. Bizim durumumuzda, sadece bir parametreyi kontrol ederiz: ATR gösterge dönemi. Kısıtlama değerini 500olarak ayarladım. Yani, dönem değerini belirtilen değerden daha yüksek ayarlarsanız, gösterge çalışmayı durduracaktır ve programın sonlandırılma nedenine dair mesajı günlüğe ve grafik yorumuna yazdıracaktır. CheckInputParameters() fonksiyon kodu aşağıda verilmiştir.
//+------------------------------------------------------------------+
//| Checking input parameters for correctness                        |
//+------------------------------------------------------------------+
bool CheckInputParameters()
  {
   if(IndicatorPeriod>500)
     {
      Comment("Decrease the indicator period! Indicator Period: ",IndicatorPeriod,"; Limit: 500;");
      printf("Decrease the indicator period! Indicator Period: %d; Limit: %d;",IndicatorPeriod,500);
      return(false);
     }
//---
   return(true);
  }
Daha sonra üç dizi başlatma fonksiyonuna geçiyoruz: InitArrays(), InitSymbolNames() ve InitLevels(). İlgili kaynak kodları aşağıda verilmektedir:
//+------------------------------------------------------------------+
//| First initialization of arrays                                   |
//+------------------------------------------------------------------+
void InitArrays()
  {
   ArrayInitialize(limit_time,NULL);
   ArrayInitialize(series_first_date,NULL);
   ArrayInitialize(series_first_date_last,NULL);
   ArrayInitialize(symbol_handles,INVALID_HANDLE);
//---
   for(int s=0; s<SYMBOLS_COUNT; s++)
      ArrayInitialize(atr_buffers[s].data,EMPTY_VALUE);
  }
//+------------------------------------------------------------------+
//| Initializing array of symbols                                    |
//+------------------------------------------------------------------+
void InitSymbolNames()
  {
   symbol_names[0]=AddSymbolToMarketWatch(_Symbol);
   symbol_names[1]=AddSymbolToMarketWatch(Symbol02);
   symbol_names[2]=AddSymbolToMarketWatch(Symbol03);
   symbol_names[3]=AddSymbolToMarketWatch(Symbol04);
   symbol_names[4]=AddSymbolToMarketWatch(Symbol05);
   symbol_names[5]=AddSymbolToMarketWatch(Symbol06);
  }
//+------------------------------------------------------------------+
//| Initializing array of levels                                     |
//+------------------------------------------------------------------+
void InitLevels()
  {
   indicator_levels[0]=Level01;
   indicator_levels[1]=Level02;
   indicator_levels[2]=Level03;
   indicator_levels[3]=Level04;
   indicator_levels[4]=Level05;
   indicator_levels[5]=Level06;
  }
InitSymbolNames() fonksiyonunda, başka bir özel fonksiyonu -AddSymbolToMarketWatch()- kullanıyoruz. Bu, sembol adını alır ve bu sembol genel listede mevcutsa, Piyasa İzleme penceresine eklenir ve fonksiyon sembol adına sahip dizeyi döndürür. Bu sembol mevcut değilse, fonksiyon "BOŞ" dizesini döndürür ve diğer fonksiyonlarda kontroller çalıştırılırken semboller dizisinde bu öğe için başka hiçbir eylem gerçekleştirilmez.
//+------------------------------------------------------------------+
//| Adding the specified symbol to the Market Watch window           |
//+------------------------------------------------------------------+
string AddSymbolToMarketWatch(string symbol)
  {
   int      total=0; // Number of symbols
   string   name=""; // Symbol name
//--- If an empty string is passed, return the empty string
   if(symbol=="")
      return(empty_symbol);
//--- Total symbols on the server
   total=SymbolsTotal(false);
//--- Iterate over the entire list of symbols
   for(int i=0;i<total;i++)
     {
      //--- Symbol name on the server
      name=SymbolName(i,false);
      //--- If this symbol is available,
      if(name==symbol)
        {
         //--- add it to the Market Watch window and
         SymbolSelect(name,true);
         //--- return its name
         return(name);
        }
     }
//--- If this symbol is not available, return the string representing the lack of the symbol
   return(empty_symbol);
  }
GetIndicatorHandles() gösterge başlatmada çağrılan başka bir fonksiyondur. Belirtilen her sembol için ATR gösterge işleyicilerini elde etmeye çalışır. İşleyici bir sembol için elde edilmemişse, fonksiyon false değerini döndürür, ancak işleyici kullanılabilirliği programın diğer kısımlarında kontrol edileceğinden bu, OnInit() içinde hiçbir şekilde işlenmeyecektir.
//+------------------------------------------------------------------+
//| Getting indicator handles                                        |
//+------------------------------------------------------------------+
bool GetIndicatorHandles()
  {
//--- An indication of all handles being valid
   bool valid_handles=true;
//--- Iterate over all symbols in a loop and ...
   for(int s=0; s<SYMBOLS_COUNT; s++)
     {
      //--- If the symbol is available
      if(symbol_names[s]!=empty_symbol)
        {
         // And if the handle of the current symbol is invalid
         if(symbol_handles[s]==INVALID_HANDLE)
           {
            //--- Get it
            symbol_handles[s]=iATR(symbol_names[s],Period(),IndicatorPeriod);
            //--- If the handle could not be obtained, try again next time
            if(symbol_handles[s]==INVALID_HANDLE)
               valid_handles=false;
           }
        }
     }
//--- Print the relevant message if the handle for one of the symbols could not be obtained
   if(!valid_handles)
     {
      msg_last=msg_invalid_handle;
      ShowCanvasMessage(msg_invalid_handle);
     }
//---
   return(valid_handles);
  }
ShowCanvasMessage() fonksiyonu, tuval ile çalışmaya yönelik diğer fonksiyonlar ile birlikte biraz daha sonra incelenecektir.
Gösterge özellikleri SetIndicatorProperties() fonksiyonunda ayarlanır. Her çizim serisinin özellikleri benzer olduğundan, bunları döngüler kullanarak ayarlamak daha uygundur:
//+------------------------------------------------------------------+
//| Setting indicator properties                                     |
//+------------------------------------------------------------------+
void SetIndicatorProperties()
  {
//--- Set the short name
   IndicatorSetString(INDICATOR_SHORTNAME,subwindow_shortname);
//--- Set the number of decimal places
   IndicatorSetInteger(INDICATOR_DIGITS,_Digits);
//--- Define buffers for drawing
   for(int s=0; s<SYMBOLS_COUNT; s++)
      SetIndexBuffer(s,atr_buffers[s].data,INDICATOR_DATA);
//--- Set labels for the current symbol
   for(int s=0; s<SYMBOLS_COUNT; s++)
      PlotIndexSetString(s,PLOT_LABEL,"ATR ("+IntegerToString(s)+", "+symbol_names[s]+")");
//--- Set the plotting type: lines
   for(int s=0; s<SYMBOLS_COUNT; s++)
      PlotIndexSetInteger(s,PLOT_DRAW_TYPE,DRAW_LINE);
//--- Set the line width
   for(int s=0; s<SYMBOLS_COUNT; s++)
      PlotIndexSetInteger(s,PLOT_LINE_WIDTH,1);
//--- Set the line color
   for(int s=0; s<SYMBOLS_COUNT; s++)
      PlotIndexSetInteger(s,PLOT_LINE_COLOR,line_colors[s]);
//--- Empty value for plotting where nothing will be drawn
   for(int s=0; s<SYMBOLS_COUNT; s++)
      PlotIndexSetDouble(s,PLOT_EMPTY_VALUE,EMPTY_VALUE);
  }
Programın başarıyla başlatılmasının ardından, OnCalculate() fonksiyonunun ilk çağrısını yapmamız gerekir. prev_calculated değişkeninin değeri ilk fonksiyon çağrısında sıfırdır. Bu aynı zamanda, daha derin bir geçmiş yüklenirken veya tarihteki boşluklar doldurulurken terminal tarafından sıfırlanır. Bu tür durumlarda, gösterge tamponları bütünüyle yeniden hesaplanır. Bu parametre değeri sıfır dışındaysa, yani giriş zaman gerisinin boyutu olan aynı fonksiyon tarafından daha önce döndürülen sonuç, tamponların yalnızca son değerlerini güncelleştirmek yeterlidir.
İlk denemede tüm hesaplamaları doğru şekilde yapmayı başaramayabilirsiniz. Bu durumda, geri dönmek için, sıfır değerini içeren RESET sabitini kullanacağız. OnCalculate() fonksiyonunun sonraki çağrısında (örneğin sonraki tikte), prev_calculated parametresi sıfır değerini içerecektir; bu, grafikte göstergenin çizim serilerini görüntülemeden önce gerekli hesaplamaların tamamını bir kez daha yapmaya çalışacağımız anlamına gelir.
Ancak piyasa kapalı olduğunda ve yeni tikler olmadığında veya başarısız hesaplamaların ardından grafik boş kalacaktır. Bu durumda, grafik zaman aralığını manuel olarak değiştirerek başka bir deneme yapma komutu vermenin basit bir yolunu deneyebilirsiniz. Ancak biz farklı bir yaklaşım kullanacağız. Bunun için, en başta, program şablonumuza zamanlayıcıyı -OnTimer() fonksiyonu - ekledik ve OnInit() fonksiyonunda 1 saniyelik zaman aralığı ayarladık.
Her saniye, zamanlayıcı OnCalculate() fonksiyonunun sıfır değeri döndürüp döndürmediğini kontrol edecektir. Bunun için, OnCalculate() fonksiyonundan tüm parametreleri OC_ ön eki ile ilgili adlara ve dizilere sahip global değişkenlere kopyalayacak CopyDataOnCalculate() fonksiyonunu yazacağız.
//+------------------------------------------------------------------+
//| Copying data from OnCalculate                                    |
//+------------------------------------------------------------------+
void CopyDataOnCalculate(const int      rates_total,
                         const int      prev_calculated,
                         const datetime &time[],
                         const double   &open[],
                         const double   &high[],
                         const double   &low[],
                         const double   &close[],
                         const long     &tick_volume[],
                         const long     &volume[],
                         const int      &spread[])
  {
   OC_rates_total=rates_total;
   OC_prev_calculated=prev_calculated;
   ArrayCopy(OC_time,time);
   ArrayCopy(OC_open,open);
   ArrayCopy(OC_high,high);
   ArrayCopy(OC_low,low);
   ArrayCopy(OC_close,close);
   ArrayCopy(OC_tick_volume,tick_volume);
   ArrayCopy(OC_volume,volume);
   ArrayCopy(OC_spread,spread);
  }
Bu fonksiyon, OnCalculate() fonksiyonu gövdesinin en başında çağrılmalıdır. Ayrıca, en başta, bunları gösterge tamponlarına yerleştirmeden önce boyutu veri hazırlama dizilerine ayarlayacak başka bir özel fonksiyon olan ResizeCalculatedArrays() fonksiyonunu eklemeliyiz. Bu dizilerin boyutu giriş zaman serisinin boyutuna eşit olmalıdır.
//+------------------------------------------------------------------+
//| Resizing the size of arrays to the size of the main array        |
//+------------------------------------------------------------------+
void ResizeCalculatedArrays()
  {
   for(int s=0; s<SYMBOLS_COUNT; s++)
     {
      ArrayResize(tmp_symbol_time[s].time,OC_rates_total);
      ArrayResize(tmp_atr_values[s].value,OC_rates_total);
     }
  }
Ayrıca, veri hazırlama dizilerini, bunları grafiğe çıkarmadan önce sıfıra başlatan bir ZeroCalculatedArrays() fonksiyonu oluşturacağız.
//+------------------------------------------------------------------+
//| Zeroing out arrays for data preparation                          |
//+------------------------------------------------------------------+
void ZeroCalculatedArrays()
  {
   for(int s=0; s<SYMBOLS_COUNT; s++)
     {
      ArrayInitialize(tmp_symbol_time[s].time,NULL);
      ArrayInitialize(tmp_atr_values[s].value,EMPTY_VALUE);
     }
  }
Aynı fonksiyon, gösterge tamponlarını ön sıfırlamak için de gerekli olacaktır. Buna ZeroIndicatorBuffers()diyelim.
//+------------------------------------------------------------------+
//| Zeroing out indicator buffers                                    |
//+------------------------------------------------------------------+
void ZeroIndicatorBuffers()
  {
   for(int s=0; s<SYMBOLS_COUNT; s++)
      ArrayInitialize(atr_buffers[s].data,EMPTY_VALUE);
  }
OnCalculate() fonksiyonunun mevcut kodu aşağıda gösterildiği gibi olacaktır. Daha sonra doldurulacak ana işlemler için yorumlar da sağladım (yorumlar ve altındaki noktalar).
//+------------------------------------------------------------------+
//| Custom indicator iteration function                              |
//+------------------------------------------------------------------+
int OnCalculate(const int      rates_total,     // Size of input time series
                const int      prev_calculated, // Bars processed at the previous call
                const datetime &time[],         // Opening time
                const double   &open[],         // Open prices
                const double   &high[],         // High prices
                const double   &low[],          // Low prices
                const double   &close[],        // Close prices
                const long     &tick_volume[],  // Tick volumes
                const long     &volume[],       // Real volumes
                const int      &spread[])       // Spread
  {
//--- For the purpose of determining the bar from which the calculation shall be made
   int limit=0;
//--- Make a copy of the OnCalculate() parameters
   CopyDataOnCalculate(rates_total,prev_calculated,
                       time,open,high,low,close,
                       tick_volume,volume,spread);
//--- Set the size to arrays for data preparation
   ResizeCalculatedArrays();
//--- If this is the first calculation or if a deeper history has been loaded or gaps in the history have been filled
   if(prev_calculated==0)
     {
      //--- Zero out arrays for data preparation
      ZeroCalculatedArrays();
      //--- Zero out indicator buffers
      ZeroIndicatorBuffers();
      //--- Other checks
      // ...
      //--- If you reached this point, it means that OnCalculate() will return non-zero value and this needs to be saved
      OC_prev_calculated=rates_total;
     }
//--- If only the last values need to be recalculated
   else
      limit=prev_calculated-1;

//--- Prepare data for drawing
// ...
//--- Fill arrays with data for drawing
// ...

//--- Return the size of the data array of the current symbol
   return(rates_total);
  }
Şu anda OnTimer() fonksiyon kodu aşağıdaki gibidir:
//+------------------------------------------------------------------+
//| Timer function                                                   |
//+------------------------------------------------------------------+
void OnTimer()
  {
//--- If for some reason calculations have not been completed or
//    a deeper history has been loaded or
//    gaps in the history have been filled,
//    then make another attempt without waiting for the new tick
   if(OC_prev_calculated==0)
     {
      OnCalculate(OC_rates_total,OC_prev_calculated,
                  OC_time,OC_open,OC_high,OC_low,OC_close,
                  OC_tick_volume,OC_volume,OC_spread);
     }
  }
Şimdi, prev_calculated değişkeni sıfıra eşit olduğunda kullanılacak diğer fonksiyonları değerlendirelim. Bu fonksiyonlar şunları yapacaktır:
- gerekli miktarda veri (çubuk) yüklemek ve oluşturmak;
- tüm işleyicilerin kullanılabilirliğini kontrol etmek;
- gerekli miktarda verinin hazır olup olmadığını kontrol etmek;
- verileri sunucu ile eşitlemek;
- çizim serisinin çizileceği çubukları belirlemek.
Ek olarak, her sembol için ilk "true" çubuğunu tanımlayacağız. Bu kısa terim, bunu daha sonra bağlama daha uygun hale getirmek için türetilmiştir. Anlamı şudur. MetaTrader 5'teki tüm zaman aralıkları dakika verilerinden oluşturulur. Ancak, örneğin sunucudaki günlük veriler 1993'ten itibaren kullanılabilirken, dakika verileri yalnızca 2000'den itibaren kullanılabilirse, bu durumda örneğin saatlik grafik zaman aralığını seçersek, çubuklar dakika verilerinin kullanılabilir olduğu tarihten başlayarak, yani 2000 yılından itibaren, oluşturulacaktır. 2000 öncesindeki her şey, günlük veriler veya mevcut zaman aralığına en yakın veriler ile temsil edilecektir. Dolayısıyla, kafanız karışmasın diye, gösterge verilerini mevcut zaman aralığı ile ilgili olmayan veriler için görüntülememelisiniz. İşte bu yüzden, mevcut zaman aralığının ilk "true" çubuğunu tanımlayacağız ve bunu, sembolün gösterge tamponuyla aynı renkte dikey bir çizgiyle işaretleyeceğiz.
Parametreler belirli bir zaman aralığı için optimize edilirse, diğer zaman dilimlerindeki verilerin bu durumda uygunsuz olacağından, "true" çubuklarının tanımlanması Uzman Danışmanlar geliştirilirken de önemlidir.
Yukarıdaki kontrolleri yapmadan önce, tuvali gösterge alt penceresine ekleyeceğiz. Bu yüzden, ilk olarak tuvali yönetmek için ihtiyacımız olacak tüm fonksiyonları yazmalıyız. Tuvali alt pencereye eklemeden önce, tuvalde hangi metin mesajlarının görüntüleneceğine dayalı olarak bunun boyutunu ve koordinatlarını belirlememiz gerekir. Bunun için getsubwindowGeometry() fonksiyonunu yazalım:
//+------------------------------------------------------------------+
//| Getting geometry of the indicator subwindow                      |
//+------------------------------------------------------------------+
void GetSubwindowGeometry()
  {
//--- Get the indicator subwindow number
   subwindow_number=ChartWindowFind(0,subwindow_shortname);
//--- Get the subwindow width and height
   chart_width=(int)ChartGetInteger(0,CHART_WIDTH_IN_PIXELS);
   subwindow_height=(int)ChartGetInteger(0,CHART_HEIGHT_IN_PIXELS,subwindow_number);
//--- Calculate the center of the subwindow
   subwindow_center_x=chart_width/2;
   subwindow_center_y=subwindow_height/2;
  }
Alt pencere özellikleri elde edildiğinde, tuvali ekleyebilirsiniz. Bunun arka planı %100 şeffaf (opaklık 0'a eşit) olacaktır ve kullanıcıya o anda ne olduğunu göstermek için yalnızca veri yüklenirken veya oluşturulurken görünür olacaktır. Görünür olduğunda arka plan opaklığı 190'a eşit olacaktır. Opaklık değerini 0 ve 255 arasında herhangi bir değere ayarlayabilirsiniz. Daha fazla bilgi için lütfen Yardım kısmından erişilebilir ColorToARGB() fonksiyonu açıklamasına bakın.
Tuvali ayarlamak için bir SetCanvas() fonksiyonu yazalım:
//+------------------------------------------------------------------+
//| Setting canvas                                                   |
//+------------------------------------------------------------------+
void SetCanvas()
  {
//--- If there is no canvas, set it
   if(ObjectFind(0,canvas_name)<0)
     {
      //--- Create the canvas
      canvas.CreateBitmapLabel(0,subwindow_number,canvas_name,0,0,chart_width,subwindow_height,clr_format);
      //--- Make the canvas completely transparent
      canvas.Erase(ColorToARGB(canvas_background,0));
      //--- Redraw the canvas
      canvas.Update();
     }
  }
Ayrıca, gösterge alt penceresinin yeniden boyutlandırılıp boyutlandırılmadığını kontrol eden bir fonksiyona ihtiyacımız olacaktır. Boyutlandırılmışsa, tuval boyutu otomatik olarak yeni alt pencere boyutuna ayarlanacaktır. Bu fonksiyona OnSubwindowChange() diyelim:
//+------------------------------------------------------------------+
//| Checking the subwindow size                                      |
//+------------------------------------------------------------------+
void OnSubwindowChange()
  {
//--- Get subwindow properties
   GetSubwindowGeometry();
//--- If the subwindow size has not changed, exit
   if(!SubwindowSizeChanged())
      return;
//--- If the subwindow height is less than one pixel or if the center has been calculated incorrectly, exit
   if(subwindow_height<1 || subwindow_center_y<1)
      return;
//--- Set the new canvas size
   ResizeCanvas();
//--- Show the last message
   ShowCanvasMessage(msg_last);
  }
Yukarıdaki kodda vurgulanan fonksiyonlar aşağıda incelenebilir. Lütfen alt pencereyi yeniden boyutlandırmadan önce çalıştırılan kontrol türlerine dikkat edin. Herhangi bir özellik yanlış çıkarsa, fonksiyon çalışmayı durdurur.
SubwindowSizeChanged() fonksiyon kodu aşağıdaki gibidir:
//+------------------------------------------------------------------+
//| Checking if the subwindow has been resized                       |
//+------------------------------------------------------------------+
bool SubwindowSizeChanged()
  {
//--- If the subwindow size has not changed, exit
   if(last_chart_width==chart_width && last_subwindow_height==subwindow_height)
      return(false);
//--- If the size has changed, save it
   else
     {
      last_chart_width=chart_width;
      last_subwindow_height=subwindow_height;
     }
//---
   return(true);
  }
ResizeCanvas() fonksiyon kodu aşağıdaki gibidir:
//+------------------------------------------------------------------+
//| Resizing canvas                                                  |
//+------------------------------------------------------------------+
void ResizeCanvas()
  {
//--- If the canvas has already been added to the indicator subwindow, set the new size
   if(ObjectFind(0,canvas_name)==subwindow_number)
      canvas.Resize(chart_width,subwindow_height);
  }
Ve son olarak, aşağıda gösterge işleyicilerini elde ederken daha önce kullanılan ShowCanvasMessage() fonksiyon kodu yer almaktadır:
//+------------------------------------------------------------------+
//| Displaying message on the canvas                                 |
//+------------------------------------------------------------------+
void ShowCanvasMessage(string message_text)
  {
   GetSubwindowGeometry();
//--- If the canvas has already been added to the indicator subwindow
   if(ObjectFind(0,canvas_name)==subwindow_number)
     {
      //--- If the string passed is not empty and correct coordinates have been obtained, display the message
      if(message_text!="" && subwindow_center_x>0 && subwindow_center_y>0)
        {
         canvas.Erase(ColorToARGB(canvas_background,canvas_opacity));
         canvas.TextOut(subwindow_center_x,subwindow_center_y,message_text,ColorToARGB(clrRed),TA_CENTER|TA_VCENTER);
         canvas.Update();
        }
     }
  }
Tuval, kaybolma efekti ile silinecektir. Bunu uygulamak için, tuvali silmeden önce, tuvali her yinelemede yenilerken, opaklığı bir döngüde kademeli olarak geçerli değerden sıfıra değiştirmemiz gerekir.
DeleteCanvas() fonksiyon kodu aşağıdaki gibidir:
//+------------------------------------------------------------------+
//| Deleting canvas                                                  |
//+------------------------------------------------------------------+
void DeleteCanvas()
  {
//--- Delete the canvas if it exists
   if(ObjectFind(0,canvas_name)>0)
     {
      //--- Before deleting, implement the disappearing effect
      for(int i=canvas_opacity; i>0; i-=5)
        {
         canvas.Erase(ColorToARGB(canvas_background,(uchar)i));
         canvas.Update();
        }
      //--- Delete the graphical resource
      canvas.Destroy();
     }
  }
Daha sonra, bunları gösterge tamponlarına yerleştirmeden ve grafikte görüntülemeden önce verilerin hazır olup olmadığını kontrol etmek için gereken fonksiyonlara göz atalım. LoadAndFormData() fonksiyonu ile başlayalım. Bunu, mevcut sembol dizisinin boyutunu diğer semboller için kullanılabilir veriler ile karşılaştırmak için kullanırız. Veriler, gerekirse, sunucudan yüklenir. Fonksiyon kodu, değerlendirmeniz için ayrıntılı yorumlarla birlikte sağlanır.
//+------------------------------------------------------------------+
//| Loading and generating the necessary/available amount of data    |
//+------------------------------------------------------------------+
void LoadAndFormData()
  {
   int bars_count=100; // Number of loaded bars
//---
   for(int s=0; s<SYMBOLS_COUNT; s++)
     {
      int      attempts          =0;    // Counter of data copying attempts
      int      array_size        =0;    // Array size
      datetime firstdate_server  =NULL; // Time of the first bar on the server
      datetime firstdate_terminal=NULL; // Time of the first bar in the terminal base
      //--- Get the first date by the symbol/time frame in the terminal base
      SeriesInfoInteger(symbol_names[s],Period(),SERIES_FIRSTDATE,firstdate_terminal);
      //--- Get the first date of the symbol/time frame on the server
      SeriesInfoInteger(symbol_names[s],Period(),SERIES_SERVER_FIRSTDATE,firstdate_server);
      //--- Print the message
      msg_last=msg_load_data="Loading and generating data: "+
               symbol_names[s]+"("+(string)(s+1)+"/"+(string)SYMBOLS_COUNT+") ... ";
      ShowCanvasMessage(msg_load_data);
      //--- Load/generate data.
      //    If the array size is smaller than the maximum number of bars in the terminal, and if
      //    the number of bars between the first date of the series in the terminal and the first date of the series on the server is more than specified
      while(array_size<OC_rates_total &&
            firstdate_terminal-firstdate_server>PeriodSeconds()*bars_count)
        {
         datetime copied_time[];
         //--- Get the first date by the symbol/time frame in the terminal base
         SeriesInfoInteger(symbol_names[s],Period(),SERIES_FIRSTDATE,firstdate_terminal);
         //--- Load/copy the specified number of bars
         if(CopyTime(symbol_names[s],Period(),0,array_size+bars_count,copied_time)!=-1)
           {
            //--- If the time of the first bar in the array, excluding the number of the bars being loaded, is earlier
            //    than the time of the first bar in the chart, terminate the loop
            if(copied_time[0]-PeriodSeconds()*bars_count<OC_time[0])
               break;
            //--- If the array size hasn't increased, increase the counter
            if(ArraySize(copied_time)==array_size)
               attempts++;
            //--- Otherwise get the current size of the array
            else
               array_size=ArraySize(copied_time);
            //--- If the array size hasn't increased over 100 attempts, terminate the loop
            if(attempts==100)
              {
               attempts=0;
               break;
              }
           }
         //--- Check the subwindow size once every 2000 bars
         //    and if the size has changed, adjust the canvas size to it
         if(!(array_size%2000))
            OnSubwindowChange();
        }
     }
  }
Gerekli miktarda veriyi yükleme girişiminden sonra, bir kez daha gösterge işleyicilerini kontrol ediyoruz. Bunun için, yukarıda değerlendirilen GetIndicatorHandles() fonksiyonunu kullanıyoruz.
İşleyiciler kontrol edildikten sonra, program CheckAvailableData() fonksiyonunu kullanarak belirtilen sembollerin verileri ve her bir sembol için gösterge değerlerinin kullanılabilirliğini kontrol eder. Aşağıda bunun nasıl yapıldığını daha yakından görebilirsiniz:
//+------------------------------------------------------------------+
//| Checking the amount of available data for all symbols            |
//+------------------------------------------------------------------+
bool CheckAvailableData()
  {
   for(int s=0; s<SYMBOLS_COUNT; s++)
     {
      //--- If this symbol is available
      if(symbol_names[s]!=empty_symbol)
        {
         double   data[]; // Array for checking the amount of indicator data
         datetime time[]; // Array for checking the number of bars
         int      calculated_values =0;    // Amount of indicator data
         int      available_bars    =0;    // Number of bars of the current period
         datetime firstdate_terminal=NULL; // First date of the current time frame data available in the terminal
         //--- Get the number of calculated values of the indicator
         calculated_values=BarsCalculated(symbol_handles[s]);
         //--- Get the first date of the current time frame data in the terminal
         firstdate_terminal=(datetime)SeriesInfoInteger(symbol_names[s],Period(),SERIES_TERMINAL_FIRSTDATE);
         //--- Get the number of available bars from the date specified
         available_bars=Bars(symbol_names[s],Period(),firstdate_terminal,TimeCurrent());
         //--- Check the readiness of bar data: 5 attempts to get values
         for(int i=0; i<5; i++)
           {
            //--- Copy the specified amount of data
            if(CopyTime(symbol_names[s],Period(),0,available_bars,time)!=-1)
              {
               //--- If the required amount has been copied, terminate the loop
               if(ArraySize(time)>=available_bars)
                  break;
              }
           }
         //--- Check the readiness of indicator data: 5 attempts to get values
         for(int i=0; i<5; i++)
           {
            //--- Copy the specified amount of data
            if(CopyBuffer(symbol_handles[s],0,0,calculated_values,data)!=-1)
              {
               //--- If the required amount has been copied, terminate the loop
               if(ArraySize(data)>=calculated_values)
                  break;
              }
           }
         //--- If the amount of data copied is not sufficient, one more attempt is required
         if(ArraySize(time)<available_bars || ArraySize(data)<calculated_values)
           {
            msg_last=msg_prepare_data;
            ShowCanvasMessage(msg_prepare_data);
            OC_prev_calculated=0;
            return(false);
           }
        }
     }
//---
   return(true);
  }
CheckAvailableData() fonksiyonu, tüm semboller için veriler hazır oluncaya kadar daha fazla hesaplama yapılmasına izin vermeyecektir. Tüm kontrol fonksiyonlarının çalışması da benzer bir model izler.
Sonraki fonksiyon, kotasyonların daha derin bir geçmişini yükleme olayını görüntülemek için gereklidir. Buna CheckEventLoadHistory() diyelim. Daha büyük miktarda veri yüklenirse, gösterge tümüyle yeniden hesaplanmalıdır. Bu fonksiyonun kaynak kodu aşağıda verilmektedir:
//+------------------------------------------------------------------+
//| Checking the event of loading a deeper history                   |
//+------------------------------------------------------------------+
bool CheckLoadedHistory()
  {
   bool loaded=false;
//---
   for(int s=0; s<SYMBOLS_COUNT; s++)
     {
      //--- If this symbol is available
      if(symbol_names[s]!=empty_symbol)
        {
         //--- If the series need to be updated
         if(OC_prev_calculated==0)
           {
            //--- Get the first date by the symbol/time frame
            series_first_date[s]=(datetime)SeriesInfoInteger(symbol_names[s],Period(),SERIES_FIRSTDATE);
            //--- If this is the first time (no value is available), then
            if(series_first_date_last[s]==NULL)
               //--- Store the first date by the symbol/time frame for further comparison
               //    in order to determine if a deeper history has been loaded
               series_first_date_last[s]=series_first_date[s];
           }
         else
           {
            //--- Get the first date by the symbol/time frame
            series_first_date[s]=(datetime)SeriesInfoInteger(symbol_names[s],Period(),SERIES_FIRSTDATE);
            //--- If the dates are different, i.e. the date in the memory is later than the one we have just obtained,
            //     this means that a deeper history has been loaded
            if(series_first_date_last[s]>series_first_date[s])
              {
               //--- Print the relevant message to the log
               Print("(",symbol_names[s],",",TimeframeToString(Period()),
                     ") > A deeper history has been loaded/generated: ",
                     series_first_date_last[s]," > ",series_first_date[s]);
               //--- Store the date
               series_first_date_last[s]=series_first_date[s];
               loaded=true;
              }
           }
        }
     }
//--- If a deeper history has been loaded/generated, then
//    send the command to refresh the plotting series of the indicator
   if(loaded)
      return(false);
//---
   return(true);
  }
Terminaldeki ve sunucudaki veriler arasındaki senkronizasyonu kontrol etmek için başka bir fonksiyon yazalım. Bu kontrol, sadece sunucu bağlantısı kurulursa çalıştırılır. CheckSymbolIsSynchronized() fonksiyon kodu aşağıda verilmektedir:
//+------------------------------------------------------------------+
//| Checking synchronization by symbol/time frame                    |
//+------------------------------------------------------------------+
bool CheckSymbolIsSynchronized()
  {
//--- If the connection to the server is established, check the data synchronization
   if(TerminalInfoInteger(TERMINAL_CONNECTED))
     {
      for(int s=0; s<SYMBOLS_COUNT; s++)
        {
         //--- If the symbol is available
         if(symbol_names[s]!=empty_symbol)
           {
            //--- If the data are not synchronized, print the relevant message and try again
            if(!SeriesInfoInteger(symbol_names[s],Period(),SERIES_SYNCHRONIZED))
              {
               msg_last=msg_not_synchronized;
               ShowCanvasMessage(msg_not_synchronized);
               return(false);
              }
           }
        }
     }
//---
   return(true);
  }
Zaman aralığını bir dizeye dönüştürme fonksiyonu "MQL5 Tarif Defteri" serisinin önceki makalelerinden alınacaktır:
//+------------------------------------------------------------------+
//| Converting time frame to a string                                |
//+------------------------------------------------------------------+
string TimeframeToString(ENUM_TIMEFRAMES timeframe)
  {
   string str="";
//--- If the value passed is incorrect, take the current chart time frame
   if(timeframe==WRONG_VALUE || timeframe== NULL)
      timeframe= Period();
   switch(timeframe)
     {
      case PERIOD_M1  : str="M1";  break;
      case PERIOD_M2  : str="M2";  break;
      case PERIOD_M3  : str="M3";  break;
      case PERIOD_M4  : str="M4";  break;
      case PERIOD_M5  : str="M5";  break;
      case PERIOD_M6  : str="M6";  break;
      case PERIOD_M10 : str="M10"; break;
      case PERIOD_M12 : str="M12"; break;
      case PERIOD_M15 : str="M15"; break;
      case PERIOD_M20 : str="M20"; break;
      case PERIOD_M30 : str="M30"; break;
      case PERIOD_H1  : str="H1";  break;
      case PERIOD_H2  : str="H2";  break;
      case PERIOD_H3  : str="H3";  break;
      case PERIOD_H4  : str="H4";  break;
      case PERIOD_H6  : str="H6";  break;
      case PERIOD_H8  : str="H8";  break;
      case PERIOD_H12 : str="H12"; break;
      case PERIOD_D1  : str="D1";  break;
      case PERIOD_W1  : str="W1";  break;
      case PERIOD_MN1 : str="MN1"; break;
     }
//---
   return(str);
  }
Ve son olarak, her sembol için ilk true çubuğu, bunu grafikte dikey bir çizgi ile işaretleyerek tanımlamamız ve kaydetmemiz gerekir. Bunu yapmak için, bir DetermineFirstTrueBar() fonksiyonu ve ilk true çubuğun zamanını döndüren bir yardımcı GetFirstTrueBarTime() fonksiyonunu yazalım.
//+-----------------------------------------------------------------------+
//| Determining the time of the first true bar for the purpose of drawing |
//+-----------------------------------------------------------------------+
bool DetermineFirstTrueBar()
  {
   for(int s=0; s<SYMBOLS_COUNT; s++)
     {
      datetime time[];           // Bar time array
      int      available_bars=0; // Number of bars
      //--- If this symbol is not available, move to the next one
      if(symbol_names[s]==empty_symbol)
         continue;
      //--- Get the total number of bars for the symbol
      available_bars=Bars(symbol_names[s],Period());
      //--- Copy the bar time array. If this action failed, try again.
      if(CopyTime(symbol_names[s],Period(),0,available_bars,time)<available_bars)
         return(false);
      //--- Get the time of the first true bar corresponding to the current time frame
      limit_time[s]=GetFirstTrueBarTime(time);
      //--- Place a vertical line on the true bar
      CreateVerticalLine(0,0,limit_time[s],prefix+symbol_names[s]+": begin time series",
                          2,STYLE_SOLID,line_colors[s],false,TimeToString(limit_time[s]),"\n");
     }
//---
   return(true);
  }
//+-----------------------------------------------------------------------+
//| Returning the time of the first true bar of the current time frame    |
//+-----------------------------------------------------------------------+
datetime GetFirstTrueBarTime(datetime &time[])
  {
   datetime true_period =NULL; // Time of the first true bar
   int      array_size  =0;    // Array size
//--- Get the array size
   array_size=ArraySize(time);
   ArraySetAsSeries(time,false);
//--- Check each bar one by one
   for(int i=1; i<array_size; i++)
     {
      //--- If the bar corresponds to the current time frame
      if(time[i]-time[i-1]==PeriodSeconds())
        {
         //--- Save it and terminate the loop
         true_period=time[i];
         break;
        }
     }
//--- Return the time of the first true bar
   return(true_period);
  }
İlk true çubuğun zamanı, CreateVerticalLine() fonksiyonu kullanılarak grafikte bir dikey çizgi ile işaretlenir:
//+------------------------------------------------------------------+
//| Creating a vertical line at the specified time point             |
//+------------------------------------------------------------------+
void CreateVerticalLine(long            chart_id,           // chart id
                        int             window_number,      // window number
                        datetime        time,               // time
                        string          object_name,        // object name
                        int             line_width,         // line width
                        ENUM_LINE_STYLE line_style,         // line style
                        color           line_color,         // line color
                        bool            selectable,         // cannot select the object if FALSE
                        string          description_text,   // text of the description
                        string          tooltip)            // no tooltip if "\n"
  {
//--- If the object has been created successfully
   if(ObjectCreate(chart_id,object_name,OBJ_VLINE,window_number,time,0))
     {
      //--- set its properties
      ObjectSetInteger(chart_id,object_name,OBJPROP_TIME,time);
      ObjectSetInteger(chart_id,object_name,OBJPROP_SELECTABLE,selectable);
      ObjectSetInteger(chart_id,object_name,OBJPROP_STYLE,line_style);
      ObjectSetInteger(chart_id,object_name,OBJPROP_WIDTH,line_width);
      ObjectSetInteger(chart_id,object_name,OBJPROP_COLOR,line_color);
      ObjectSetString(chart_id,object_name,OBJPROP_TEXT,description_text);
      ObjectSetString(chart_id,object_name,OBJPROP_TOOLTIP,tooltip);
     }
  }
Kontrol fonksiyonları hazırdır. Bunun sonucunda, OnCalculate() fonksiyon kodunun, prev_calculated değişkeni sıfıra eşit olduğundaki kısmı artık aşağıda gösterildiği gibi görünecektir:
//--- If this is the first calculation or if a deeper history has been loaded or gaps in the history have been filled
   if(prev_calculated==0)
     {
      //--- Zero out arrays for data preparation
      ZeroCalculatedArrays();
      //--- Zero out indicator buffers
      ZeroIndicatorBuffers();
      //--- Get subwindow properties
      GetSubwindowGeometry();
      //--- Add the canvas
      SetCanvas();
      //--- Load and generate the necessary/available amount of data
      LoadAndFormData();
      //--- If there is an invalid handle, try to get it again
      if(!GetIndicatorHandles())
         return(RESET);
      //--- Check the amount of data available for all symbols
      if(!CheckAvailableData())
         return(RESET);
      //--- Check if a deeper history has been loaded
      if(!CheckLoadedHistory())
         return(RESET);
      //--- Check synchronization by symbol/time frame at the current moment
      if(!CheckSymbolIsSynchronized())
         return(RESET);
      //--- For each symbol, determine the bar from which we should start drawing
      if(!DetermineFirstTrueBar())
         return(RESET);
      //--- If you reached this point, it means that OnCalculate() will return non-zero value and this needs to be saved
      OC_prev_calculated=rates_total;
     }
Şimdi, belirli bir kontrol her başarısız olduğunda, program bir sonraki tik veya zamanlayıcı olayında başka bir girişimde bulunmak için geri adım geri gidecektir. Zamanlayıcıda, OnCalculate() fonksiyonunun dışında daha derin bir geçmiş yüklemek için de kontrol yapmamız gerekiyor:
//+------------------------------------------------------------------+
//| Timer function                                                   |
//+------------------------------------------------------------------+
void OnTimer()
  {
//--- If a deeper history has been loaded
   if(!CheckLoadedHistory())
      OC_prev_calculated=0;
//--- If for some reason calculations have not been completed or
//    a deeper history has been loaded or
//    gaps in the history have been filled,
//    then make another attempt without waiting for the new tick
   if(OC_prev_calculated==0)
     {
      OnCalculate(OC_rates_total,OC_prev_calculated,
                  OC_time,OC_open,OC_high,OC_low,OC_close,
                  OC_tick_volume,OC_volume,OC_spread);
     }
  }
Şimdi, OnCalculate() fonksiyonuna yerleştirilecek iki ana döngüyü yazmamız gerekiyor:
- İlk döngü, gösterge serilerindeki boşlukları önlemek için verileri, "değeri tüm araçlarla elde etme" ilkesine dayalı olarak hazırlayacaktır. Bunun arkasındaki fikir basittir: değerin elde edilememesi durumunda belirli sayıda girişimde bulunulacaktır. Bu döngüde, sembollerin zaman değerleri ve volatilite gösterge (ATR) değerleri ayrı dizilere kaydedilecektir.
- İkinci ana döngüde, gösterge tamponları doldurulurken, diğer sembollerin zaman dizileri, mevcut sembol zamanı ile karşılaştırma ve tüm çizim serilerinin senkronizasyonu için gerekli olacaktır.
İlk döngünün kodu aşağıda verilmektedir:
//--- Prepare data for drawing
   for(int s=0; s<SYMBOLS_COUNT; s++)
     {
      //--- If the symbol is available
      if(symbol_names[s]!=empty_symbol)
        {
         double percent=0.0; // For the purpose of calculating the progress percentage
         msg_last=msg_sync_update="Preparing data ("+IntegerToString(rates_total)+" bars) : "+
                      symbol_names[s]+"("+(string)(s+1)+"/"+(string)(SYMBOLS_COUNT)+") - 00% ... ";
         //--- Print the message
         ShowCanvasMessage(msg_sync_update);
         //--- Control every value of the array
         for(int i=limit; i<rates_total; i++)
           {
            PrepareData(i,s,time);
            //--- Refresh the message once every 1000 bars
            if(i%1000==0)
              {
               //--- Progress percentage
               ProgressPercentage(i,s,percent);
               //--- Print the message
               ShowCanvasMessage(msg_sync_update);
              }
            //--- Check the subwindow size once every 2000 bars
            //    and if the size has changed, adjust the canvas size to it
            if(i%2000==0)
               OnSubwindowChange();
           }
        }
     }
Değerleri kopyalama ve kaydetme ana fonksiyonu PrepareData() yukarıdaki kodda vurgulanmıştır. Bir de henüz değerlendirilmeyen yeni bir fonksiyon vardır: ProgressPercentage(). Bu, kullanıcıya işlemin ne kadar süreceğini bildirmek için mevcut işlemin ilerleme yüzdesini hesaplar.
PrepareData() fonksiyon kodu aşağıdaki gibidir:
//+------------------------------------------------------------------+
//| Preparing data before drawing                                    |
//+------------------------------------------------------------------+
void PrepareData(int bar_index,int symbol_number,datetime const &time[])
  {
   int attempts=100; // Number of copying attempts
//--- Time of the bar of the specified symbol and time frame
   datetime symbol_time[];
//--- Array for copying indicator values
   double atr_values[];
//--- If within the area of the current time frame bars
   if(time[bar_index]>=limit_time[symbol_number])
     {
      //--- Copy the time
      for(int i=0; i<attempts; i++)
        {
         if(CopyTime(symbol_names[symbol_number],0,time[bar_index],1,symbol_time)==1)
           {
            tmp_symbol_time[symbol_number].time[bar_index]=symbol_time[0];
            break;
           }
        }
      //--- Copy the indicator value
      for(int i=0; i<attempts; i++)
        {
         if(CopyBuffer(symbol_handles[symbol_number],0,time[bar_index],1,atr_values)==1)
           {
            tmp_atr_values[symbol_number].value[bar_index]=atr_values[0];
            break;
           }
        }
     }
//--- If outside the area of the current time frame bars, set an empty value
   else
      tmp_atr_values[symbol_number].value[bar_index]=EMPTY_VALUE;
  }
ProgressPercentage() fonksiyon kodu aşağıdaki gibidir:
//+------------------------------------------------------------------+
//| Calculating progress percentage                                  |
//+------------------------------------------------------------------+
void ProgressPercentage(int bar_index,int symbol_number,double &percent)
  {
   string message_text="";
   percent=(double(bar_index)/OC_rates_total)*100;
//---
   if(percent<=9.99)
      message_text="0"+DoubleToString(percent,0);
   else if(percent<99)
      message_text=DoubleToString(percent,0);
   else
      message_text="100";
//---
   msg_last=msg_sync_update="Preparing data ("+(string)OC_rates_total+" bars) : "+
            symbol_names[symbol_number]+
            "("+(string)(symbol_number+1)+"/"+(string)SYMBOLS_COUNT+") - "+message_text+"% ... ";
  }
Gösterge tamponları, OnCalculate() fonksiyonunun ikinci ana döngüsünde doldurulur:
//--- Fill indicator buffers
   for(int s=0; s<SYMBOLS_COUNT; s++)
     {
      //--- If the specified symbol does not exist, zero out the buffer
      if(symbol_names[s]==empty_symbol)
         ArrayInitialize(atr_buffers[s].data,EMPTY_VALUE);
      else
        {
         //--- Generate a message
         msg_last=msg_sync_update="Updating indicator data: "+
                      symbol_names[s]+"("+(string)(s+1)+"/"+(string)SYMBOLS_COUNT+") ... ";
         //--- Print the message
         ShowCanvasMessage(msg_sync_update);
         //--- Fill indicator buffers with values
         for(int i=limit; i<rates_total; i++)
           {
            FillIndicatorBuffers(i,s,time);
            //--- Check the subwindow size once every 2000 bars
            //    and if the size has changed, adjust the canvas size to it
            if(i%2000==0)
               OnSubwindowChange();
           }
        }
     }
Yukarıdaki kodda vurgulanan dize FillIndicatorBuffers() fonksiyonunu içerir. Burası, göstergenin çizim serisini grafikte görüntülemeden önce son işlemlerin gerçekleştirildiği yerdir:
//+------------------------------------------------------------------+
//| Filling indicator buffers                                        |
//+------------------------------------------------------------------+
void FillIndicatorBuffers(int bar_index,int symbol_number,datetime const &time[])
  {
//--- For the purpose of checking the obtained indicator value
   bool check_value=false;
//--- Counter of the current time frame bars
   static int bars_count=0;
//--- Zero out the counter of the current time frame bars at the beginning of the symbol's time series
   if(bar_index==0)
      bars_count=0;
//--- If within the area of current time frame bars and the counter is smaller
//    than the specified indicator period, increase the counter
   if(bars_count<IndicatorPeriod && time[bar_index]>=limit_time[symbol_number])
      bars_count++;
//--- If within the indicator area and the time of the current symbol coincides with the time of the specified symbol
   if(bars_count>=IndicatorPeriod &&
      time[bar_index]==tmp_symbol_time[symbol_number].time[bar_index])
     {
      //--- If the value obtained is not empty
      if(tmp_atr_values[symbol_number].value[bar_index]!=EMPTY_VALUE)
        {
         check_value=true;
         atr_buffers[symbol_number].data[bar_index]=tmp_atr_values[symbol_number].value[bar_index];
        }
     }
//--- Set an empty value in case of failure to set a higher value
   if(!check_value)
      atr_buffers[symbol_number].data[bar_index]=EMPTY_VALUE;
  }
OnCalculate() fonksiyonunun sonunda, tuvali silmemiz, mesajların değişkenlerini sıfırlamamız ve çizelgeyi yenilememiz gerekir. Son olarak rates_total dizi boyutu döndürülecektir ve bunun ardından OnCalculate() fonksiyonunda sonraki her bir tik veya zamanlayıcı olayınca son değer yeniden hesaplanacaktır.
Bunlar, ikinci ana döngü ile fonksiyon tarafından döndürülen değer arasına yerleştirilecek kod dizeleridir:
//--- Delete the canvas
   DeleteCanvas();
//--- Set indicator levels
   SetIndicatorLevels();
//--- Zero out variables
   msg_last="";
   msg_sync_update="";
//--- Refresh the chart
   ChartRedraw();
SetIndicatorLevels() yatay seviyeleri ayarlama fonksiyon kodu aşağıdaki gibidir:
//+------------------------------------------------------------------------+
//| Setting indicator levels                                               |
//+------------------------------------------------------------------------+
void SetIndicatorLevels()
  {
//--- Get the indicator subwindow number
   subwindow_number=ChartWindowFind(0,subwindow_shortname);
//--- Set levels
   for(int i=0; i<LEVELS_COUNT; i++)
      CreateHorizontalLine(0,subwindow_number,
                            prefix+"level_0"+(string)(i+1)+"",
                            CorrectValueBySymbolDigits(indicator_levels[i]*_Point),
                            1,STYLE_DOT,clrLightSteelBlue,false,false,false,"\n");
  }
//+------------------------------------------------------------------------+
//| Adjusting the value based on the number of digits in the price (double)|
//+------------------------------------------------------------------------+
double CorrectValueBySymbolDigits(double value)
  {
   return(_Digits==3 || _Digits==5) ? value*=10 : value;
  }
CreateHorizontalLine() belirtilen özelliklere sahip bir yatay seviye ayarlama fonksiyon kodu aşağıdaki gibidir:
//+------------------------------------------------------------------+
//| Creating a horizontal line at the price level specified          |
//+------------------------------------------------------------------+
void CreateHorizontalLine(long            chart_id,      // chart id
                          int             window_number, // window number
                          string          object_name,   // object name
                          double          price,         // price level
                          int             line_width,    // line width
                          ENUM_LINE_STYLE line_style,    // line style
                          color           line_color,    // line color
                          bool            selectable,    // cannot select the object if FALSE
                          bool            selected,      // line is selected
                          bool            back,          // background position
                          string          tooltip)       // no tooltip if "\n"
  {
//--- If the object has been created successfully
   if(ObjectCreate(chart_id,object_name,OBJ_HLINE,window_number,0,price))
     {
      //--- set its properties
      ObjectSetInteger(chart_id,object_name,OBJPROP_SELECTABLE,selectable);
      ObjectSetInteger(chart_id,object_name,OBJPROP_SELECTED,selected);
      ObjectSetInteger(chart_id,object_name,OBJPROP_BACK,back);
      ObjectSetInteger(chart_id,object_name,OBJPROP_STYLE,line_style);
      ObjectSetInteger(chart_id,object_name,OBJPROP_WIDTH,line_width);
      ObjectSetInteger(chart_id,object_name,OBJPROP_COLOR,line_color);
      ObjectSetString(chart_id,object_name,OBJPROP_TOOLTIP,tooltip);
     }
  }
Grafik nesnelerini silme fonksiyonları:
//+------------------------------------------------------------------+
//| Deleting levels                                                  |
//+------------------------------------------------------------------+
void DeleteLevels()
  {
   for(int i=0; i<LEVELS_COUNT; i++)
      DeleteObjectByName(prefix+"level_0"+(string)(i+1)+"");
  }
//+------------------------------------------------------------------+
//| Deleting vertical lines of the beginning of the series           |
//+------------------------------------------------------------------+
void DeleteVerticalLines()
  {
   for(int s=0; s<SYMBOLS_COUNT; s++)
      DeleteObjectByName(prefix+symbol_names[s]+": begin time series");
  }
//+------------------------------------------------------------------+
//| Deleting the object by name                                      |
//+------------------------------------------------------------------+
void DeleteObjectByName(string object_name)
  {
//--- If such object exists
   if(ObjectFind(0,object_name)>=0)
     {
      //--- If an error occurred when deleting, print the relevant message
      if(!ObjectDelete(0,object_name))
         Print("Error ("+IntegerToString(GetLastError())+") when deleting the object!");
     }
  }
Aşağıdaki kod OnDeinit() fonksiyonuna eklenmelidir:
Artık her şey hazırdır ve tam bir test yapılabilir. Penceredeki çubukların maksimum sayısı, terminal ayarlarının Grafikler sekmesinden ayarlanabilir. Göstergenin ne kadar hızlı çalışmaya hazır olacağı penceredeki çubuk sayısına bağlıdır.

Şekil 1. Terminal ayarlarında maksimum çubuk sayısını ayarlama
Göstergeyi grafiğe yüklerken, tüm sembollerin veri hazırlığı ilerlemesini görebilirsiniz:

Şekil 2. Veri hazırlığı sırasında tuval üzerindeki mesaj
Aşağıda, göstergeyi 20 dakikalık bir zaman aralığında görüntüleyen ekran görüntüsünü görebilirsiniz:

Şekil 3. 20 dakikalık zaman aralığında çok sembollü ATR göstergesi
"True" çubuklarının başlangıcı grafikte dikey çizgiler ile işaretlenir. Aşağıdaki ekran görüntüsü, NZDUSD (sarı çizgi) için true çubukların 2000'den (MetaQuotes-Demo sunucusu) itibaren başladığını, ancak diğer tüm döviz çiftleri true çubuklarının 1999'un başlarında göründüğünü, bu nedenle yalnızca bir çizginin görüntülendiğini göstermektedir (bunların tamamı aynı tarihtedir). Dönem ayırıcılarının 1999 öncesinde daha küçük bir aralığa sahip olduğunu da fark edebiliriz ve çubukların zamanını analiz ettiğinizde, bunların günlük çubuklar olduğunu görebilirsiniz.
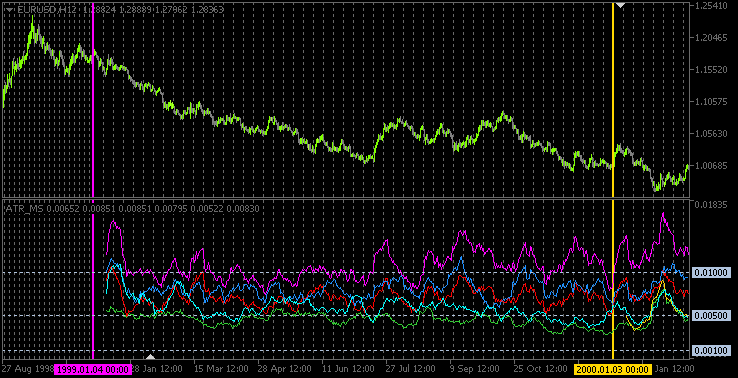
Şekil 4. Dikey çizgiler her sembol için true çubukların başlangıcını işaretler
Sonuç
Makale burada bitirilebilir. Açıklanan kaynak kodu makaleye eklenmiştir ve buradan indirilebilir. Sonraki makalelerden birinde, volatiliteyi analiz edecek bir alım satım sistemi uygulamaya çalışacağız ve ortaya ne çıkacağına bakacağız.
MetaQuotes Ltd tarafından Rusçadan çevrilmiştir.
Orijinal makale: https://www.mql5.com/ru/articles/752
Uyarı: Bu materyallerin tüm hakları MetaQuotes Ltd'ye aittir. Bu materyallerin tamamen veya kısmen kopyalanması veya yeniden yazdırılması yasaktır.
Bu makale sitenin bir kullanıcısı tarafından yazılmıştır ve kendi kişisel görüşlerini yansıtmaktadır. MetaQuotes Ltd, sunulan bilgilerin doğruluğundan veya açıklanan çözümlerin, stratejilerin veya tavsiyelerin kullanımından kaynaklanan herhangi bir sonuçtan sorumlu değildir.

 Çok Para Birimli, Çok Sistemli bir Uzman Danışman Oluşturma
- Ücretsiz alım-satım uygulamaları
- İşlem kopyalama için 8.000'den fazla sinyal
- Finansal piyasaları keşfetmek için ekonomik haberler
Web sitesi politikasını ve kullanım şartlarını kabul edersiniz
Harika, ancak bu resim tester'da var ve shiftbars manuel olarak ayarlandıktan ve gösterge sizinkinin altında PRICE_CLOSE ile hesaplanacak şekilde değiştirildikten sonra bile gerçek:
Son zamanlarda MT kullanmaktan bir olumsuzluğum var ve bu, çoklu sistemlerde standart göstergeleri kullanmanın aksaklığı, sadece çalışmıyorlar. Bunun herhangi bir çarpık elin hatası olmadığını anlamaya çalışmak için çok fazla zaman harcadım. En son güncellemelerle daha da kötüleşiyor. Muhtemelen ustalar, çaresizlikten gelen aptalların yapacak hiçbir şeyden birleşmek için bu mucize üzerinde birkaç mashka kullanacağı gerçeğine güveniyorlar.
Harika, ancak shiftbars manuel olarak ayarlandıktan sonra bile test cihazında bu resim var, sizinkinin altında:
...
Son zamanlarda MT kullanmaktan bir olumsuzluğum var ve bu, çoklu sistemlerde standart göstergeleri kullanmanın aksaklığı, sadece çalışmıyorlar. En son güncellemelerle daha da kötüleşiyor. Muhtemelen, ustalar aptalların yapacak hiçbir şeyden birleşmek için çaresizlik içinde bu mucize üzerinde birkaç mashka kullanacaklarına güveniyorlar.
Bu göstergeyi test cihazında bu şekilde test etmedim bile. Bir test cihazı için çok fazla gereksiz şey var. Makale de bunun hakkında hiçbir şey söylemiyor.
Verilerini Uzman Danışmandan alırsanız, test cihazındaki göstergeleri diğer sembollerden ve zaman dilimlerinden kullanırken herhangi bir sorun fark etmedim.
Bunu çözmek gerekiyor. Henüz bir cevabım yok.
... uçuculuk ... gerçek çubuklar ...
makalenin ne hakkında konuştuğu tam olarak belli değil ?!
... farklı TF'lerden (bazı anahtar çubuklarla) - mevcut TF'de (?!) volatilite okumaları (ATR) hakkında.
ve "gerçek çubuklar" altında - muhtemelen (doğru anladıysam) - farklı TF'lerde (??) açılış çubukları anlamına gelir
örneğin: Açılış zamanı xx: 15 dakika, xx: 30 dakika (?!) olan TF m15 ile Gerçek Çubuk.