
MQL5 Coobook: MQL5에서 다중 기호 변동성 지표 개발

소개
이 글에서는 다중 기호 변동성 지표의 개발을 고려해볼 것입니다. 다중 기호 지표의 개발은 이 글에서 명확히 하는 데 도움이 되는 초보 MQL5 개발자에게 몇 가지 어려움을 줄 수 있습니다. 다중 기호 지표 개발 과정에서 발생하는 주요 문제는 현재 기호에 대한 다른 기호 데이터의 동기화, 일부 지표 데이터의 부족 및 주어진 시간 프레임의 '참' 바에 대한 시작 식별과 관련이 있습니다. 이 모든 문제는 글에서 면밀히 고려해보겠습니다.
핸들을 기반으로 각 기호에 대해 이미 계산된 Average True Range(ATR) 지표의 값을 가져옵니다. 설명을 위해 지표의 외부 매개변수에서 이름을 설정할 수 있는 6개의 기호가 있습니다. 입력한 이름이 올바른지 확인됩니다. 매개변수에 지정된 특정 기호를 일반 목록에서 사용할 수 없는 경우 이에 대한 계산이 수행되지 않습니다. 사용 가능한 모든 기호는 시장 조사 창에서 이미 사용 가능한 경우가 아니면 추가됩니다.
"MQL5 Cookbook: Indicator Subwindow Controls - Scrollbar"라는 제목의 이전 글에서 우리는 이미 텍스트를 프린트하고 그림을 그릴 수 있는 캔버스에 대해 이야기했습니다. 이번에는 캔버스에 그리는 것이 아니라 현재 프로그램 프로세스에 대한 메시지를 표시하여 사용자에게 주어진 시점에 무슨 일이 일어나고 있는지 알려주는 데 사용할 것입니다.
지표 개발
프로그램 개발을 시작하겠습니다. MQL5 마법사를 사용하여 맞춤 지표 템플릿을 만듭니다. 몇 가지 수정 후에 아래와 같은 소스 코드를 얻을 수 있습니다.
//+------------------------------------------------------------------+
//|                                               MultiSymbolATR.mq5 |
//|                        Copyright 2010, MetaQuotes Software Corp. |
//|                                              http://www.mql5.com |
//+------------------------------------------------------------------+
//--- Indicator properties
#property copyright "Copyright 2010, MetaQuotes Software Corp."
#property link      "http://www.mql5.com"
#property version   "1.00"
#property indicator_separate_window // Indicator is in a separate subwindow
#property indicator_minimum 0       // Minimum value of the indicator
#property indicator_buffers 6       // Number of buffers for indicator calculation
#property indicator_plots   6       // Number of plotting series
//+------------------------------------------------------------------+
//| Custom indicator initialization function                         |
//+------------------------------------------------------------------+
int OnInit()
  {
//--- Initialization completed successfully
   return(INIT_SUCCEEDED);
  }
//+------------------------------------------------------------------+
//| Deinitialization                                                 |
//+------------------------------------------------------------------+
void OnDeinit(const int reason)
  {
  }
//+------------------------------------------------------------------+
//| Custom indicator iteration function                              |
//+------------------------------------------------------------------+
int OnCalculate(const int      rates_total,     // Size of input time series
                const int      prev_calculated, // Bars processed at the previous call
                const datetime &time[],         // Opening time
                const double   &open[],         // Open prices
                const double   &high[],         // High prices
                const double   &low[],          // Low prices
                const double   &close[],        // Close prices
                const long     &tick_volume[],  // Tick volumes
                const long     &volume[],       // Real volumes
                const int      &spread[])       // Spread
  {
//--- Return the size of the data array of the current symbol
   return(rates_total);
  }
//+------------------------------------------------------------------+
//| Timer function                                                   |
//+------------------------------------------------------------------+
void OnTimer()
  {
  }
//+------------------------------------------------------------------+
아이디어를 구현하기 위해 이 템플릿을 필요한 것으로 추가로 채울 것입니다. 타이머의 필요성은 이 글의 뒷부분에서 설명합니다. 특정 지표 속성 바로 뒤에 시작 부분에 상수를 추가해 보겠습니다.
//--- Constants
#define RESET           0 // Returning the indicator recalculation command to the terminal
#define LEVELS_COUNT    6 // Number of levels
#define SYMBOLS_COUNT   6 // Number of symbols
LEVELS_COUNT 상수는 "가로선" 유형(OBJ_HLINE)의 그래픽 개체가 나타내는 수준 수 값을 포함합니다. 이러한 수준의 값은 지표의 외부 매개변수에서 지정할 수 있습니다.
맞춤 그래픽 작업을 위한 클래스가 있는 파일을 프로젝트에 포함해 보겠습니다.
//--- Include the class for working with the canvas
#include <Canvas\Canvas.mqh>
외부 매개변수에서 iATR 평균 기간, 변동성을 표시해야 하는 기호의 이름 및 수평 수준 값을 지정합니다. 첫 번째 기호는 차트에 지표가 첨부된 기호로 간주되므로 기호는 2부터 시작하여 번호가 매겨집니다.
//--- External parameters
input  int              IndicatorPeriod=14;       // Averaging period
sinput string dlm01=""; //- - - - - - - - - - - - - - - - - - - - - - - - - - -
input  string           Symbol02       ="GBPUSD"; // Symbol 2
input  string           Symbol03       ="AUDUSD"; // Symbol 3
input  string           Symbol04       ="NZDUSD"; // Symbol 4
input  string           Symbol05       ="USDCAD"; // Symbol 5
input  string           Symbol06       ="USDCHF"; // Symbol 6
sinput string dlm02=""; //- - - - - - - - - - - - - - - - - - - - - - - - - - -
input  int              Level01        =10;       // Level 1
input  int              Level02        =50;       // Level 2
input  int              Level03        =100;      // Level 3
input  int              Level04        =200;      // Level 4
input  int              Level05        =400;      // Level 5
input  int              Level06        =600;      // Level 6
코드에서 나중에 작업할 모든 전역 변수와 배열을 만들어야 합니다. 이들 모두는 자세한 설명과 함께 아래 코드에 제공됩니다.
//--- Global variables and arrays
CCanvas           canvas;                 // Loading the class
//--- Variables/arrays for copying data from OnCalculate()
int               OC_rates_total     =0;  // Size of input time series
int               OC_prev_calculated =0;  // Bars processed at the previous call
datetime          OC_time[];              // Opening time
double            OC_open[];              // Open prices
double            OC_high[];              // High prices
double            OC_low[];               // Low prices
double            OC_close[];             // Close prices
long              OC_tick_volume[];       // Tick volumes
long              OC_volume[];            // Real volumes
int               OC_spread[];            // Spread
//--- Structure of buffers for drawing indicator values
struct buffers {double data[];};
buffers           atr_buffers[SYMBOLS_COUNT];
//--- Structure of time arrays for data preparation
struct temp_time {datetime time[];};
temp_time         tmp_symbol_time[SYMBOLS_COUNT];
//--- Structure of arrays of the ATR indicator values for data preparation
struct temp_atr {double value[];};
temp_atr          tmp_atr_values[SYMBOLS_COUNT];
//--- For the purpose of storing and checking the time of the first bar in the terminal
datetime          series_first_date[SYMBOLS_COUNT];
datetime          series_first_date_last[SYMBOLS_COUNT];
//--- Time of the bar from which we will start drawing
datetime          limit_time[SYMBOLS_COUNT];
//--- Indicator levels
int               indicator_levels[LEVELS_COUNT];
//--- Symbol names
string            symbol_names[SYMBOLS_COUNT];
//--- Symbol handles
int               symbol_handles[SYMBOLS_COUNT];
//--- Colors of indicator lines
color             line_colors[SYMBOLS_COUNT]={clrRed,clrDodgerBlue,clrLimeGreen,clrGold,clrAqua,clrMagenta};
//--- String representing the lack of the symbol
string            empty_symbol="EMPTY";
//--- Indicator subwindow properties
int               subwindow_number        =WRONG_VALUE;              // Subwindow number
int               chart_width             =0;                        // Chart width
int               subwindow_height        =0;                        // Subwindow height
int               last_chart_width        =0;                        // Last saved chart width
int               last_subwindow_height   =0;                        // Last saved subwindow height
int               subwindow_center_x      =0;                        // Horizontal center of the subwindow
int               subwindow_center_y      =0;                        // Vertical center of the subwindow
string            subwindow_shortname     ="MS_ATR";                 // Short name of the indicator
string            prefix                  =subwindow_shortname+"_";  // Prefix for objects
//--- Canvas properties
string            canvas_name             =prefix+"canvas";          // Canvas name
color             canvas_background       =clrBlack;                 // Canvas background color
uchar             canvas_opacity          =190;                      // Opacity
int               font_size               =16;                       // Font size
string            font_name               ="Calibri";                // Font
ENUM_COLOR_FORMAT clr_format              =COLOR_FORMAT_ARGB_RAW;    // Color components should be correctly set by the user
//--- Canvas messages
string            msg_invalid_handle      ="Invalid indicator handle! Please wait...";
string            msg_prepare_data        ="Preparing data! Please wait...";
string            msg_not_synchronized    ="Unsynchronized data! Please wait...";
string            msg_load_data           ="";
string            msg_sync_update         ="";
string            msg_last                ="";
//--- Maximum number of bars specified in the terminal settings
int               terminal_max_bars=0;
지표를 차트에 로드할 때 OnInit() 함수는 다음 작업을 수행합니다.
- 지표 속성 설정;
- 플로팅 시리즈를 그리기 위한 배열을 결정하는 단계;
- 배열 초기화;
- 시장 조사 창에 외부 매개변수에 지정된 기호 추가;
- 매개변수의 정확성을 확인하고 지표 핸들을 얻기 위한 첫 번째 시도를 합니다.
이러한 모든 작업을 별도의 기능으로 정리하면 보다 편리하게 처리할 수 있습니다. 결과적으로 OnInit() 함수 소스 코드는 아래와 같이 매우 이해하기 쉬워집니다.:
//+------------------------------------------------------------------+
//| Custom indicator initialization function                         |
//+------------------------------------------------------------------+
int OnInit()
  {
//--- Check input parameters for correctness
   if(!CheckInputParameters())
      return(INIT_PARAMETERS_INCORRECT);
//--- Set the timer at 1-second intervals
   EventSetTimer(1);
//--- Set the font to be displayed on the canvas
   canvas.FontSet(font_name,font_size,FW_NORMAL);
//--- Initialization of arrays
   InitArrays();
//--- Initialize the array of symbols
   InitSymbolNames();
//--- Initialize the array of levels
   InitLevels();
//--- Get indicator handles
   GetIndicatorHandles();
//--- Set indicator properties
   SetIndicatorProperties();
//--- Get the number of bars specified in the terminal settings
   terminal_max_bars=TerminalInfoInteger(TERMINAL_MAXBARS);
//--- Clear the comment
   Comment("");
//--- Refresh the chart
   ChartRedraw();
//--- Initialization completed successfully
   return(INIT_SUCCEEDED);
  }
위의 코드에서 사용된 사용자 정의 함수를 자세히 살펴보겠습니다. CheckInputParameters() 함수에서 외부 매개변수가 정확한지 확인합니다. 우리의 경우 하나의 매개변수인 ATR 지표 기간만 확인합니다. 제한 값을 500으로 설정했습니다. 즉, 기간 값을 지정된 값보다 높게 설정하면 지표는 동작을 멈추고 프로그램 종료 사유에 대한 메시지를 로그와 차트 주석에 출력하게 됩니다. CheckInputParameters() 함수 코드는 아래에 나와 있습니다.
//+------------------------------------------------------------------+
//| Checking input parameters for correctness                        |
//+------------------------------------------------------------------+
bool CheckInputParameters()
  {
   if(IndicatorPeriod>500)
     {
      Comment("Decrease the indicator period! Indicator Period: ",IndicatorPeriod,"; Limit: 500;");
      printf("Decrease the indicator period! Indicator Period: %d; Limit: %d;",IndicatorPeriod,500);
      return(false);
     }
//---
   return(true);
  }
그런 다음 InitArrays(), InitSymbolNames() 및 InitLevels()의 세 가지 배열 초기화 함수로 이동합니다. 각각의 소스 코드는 다음과 같습니다.
//+------------------------------------------------------------------+
//| First initialization of arrays                                   |
//+------------------------------------------------------------------+
void InitArrays()
  {
   ArrayInitialize(limit_time,NULL);
   ArrayInitialize(series_first_date,NULL);
   ArrayInitialize(series_first_date_last,NULL);
   ArrayInitialize(symbol_handles,INVALID_HANDLE);
//---
   for(int s=0; s<SYMBOLS_COUNT; s++)
      ArrayInitialize(atr_buffers[s].data,EMPTY_VALUE);
  }
//+------------------------------------------------------------------+
//| Initializing array of symbols                                    |
//+------------------------------------------------------------------+
void InitSymbolNames()
  {
   symbol_names[0]=AddSymbolToMarketWatch(_Symbol);
   symbol_names[1]=AddSymbolToMarketWatch(Symbol02);
   symbol_names[2]=AddSymbolToMarketWatch(Symbol03);
   symbol_names[3]=AddSymbolToMarketWatch(Symbol04);
   symbol_names[4]=AddSymbolToMarketWatch(Symbol05);
   symbol_names[5]=AddSymbolToMarketWatch(Symbol06);
  }
//+------------------------------------------------------------------+
//| Initializing array of levels                                     |
//+------------------------------------------------------------------+
void InitLevels()
  {
   indicator_levels[0]=Level01;
   indicator_levels[1]=Level02;
   indicator_levels[2]=Level03;
   indicator_levels[3]=Level04;
   indicator_levels[4]=Level05;
   indicator_levels[5]=Level06;
  }
InitSymbolNames() 함수에서 다른 사용자 정의 함수인 AddSymbolToMarketWatch()를 사용합니다. 기호 이름을 수신하고 이 기호가 일반 목록에서 사용 가능한 경우 시장 조사 창에 추가되고 함수는 기호 이름과 함께 문자열을 반환합니다. 해당 기호를 사용할 수 없는 경우 함수는 "EMPTY" 문자열을 반환하고 다른 함수에서 검사를 실행할 때 기호 배열의 이 요소에 대해 더 이상 작업이 수행되지 않습니다.
//+------------------------------------------------------------------+
//| Adding the specified symbol to the Market Watch window           |
//+------------------------------------------------------------------+
string AddSymbolToMarketWatch(string symbol)
  {
   int      total=0; // Number of symbols
   string   name=""; // Symbol name
//--- If an empty string is passed, return the empty string
   if(symbol=="")
      return(empty_symbol);
//--- Total symbols on the server
   total=SymbolsTotal(false);
//--- Iterate over the entire list of symbols
   for(int i=0;i<total;i++)
     {
      //--- Symbol name on the server
      name=SymbolName(i,false);
      //--- If this symbol is available,
      if(name==symbol)
        {
         //--- add it to the Market Watch window and
         SymbolSelect(name,true);
         //--- return its name
         return(name);
        }
     }
//--- If this symbol is not available, return the string representing the lack of the symbol
   return(empty_symbol);
  }
GetIndicatorHandles()는 지표 초기화 시 호출되는 또 다른 함수입니다. 지정된 각 기호에 대해 ATR 지표 핸들을 가져오려고 시도합니다. 일부 기호에 대한 핸들을 얻지 못한 경우 함수는 false를 반환하지만 핸들 가용성은 프로그램의 다른 부분에서 확인되므로 OnInit()에서는 어떤 식으로든 처리되지 않습니다.
//+------------------------------------------------------------------+
//| Getting indicator handles                                        |
//+------------------------------------------------------------------+
bool GetIndicatorHandles()
  {
//--- An indication of all handles being valid
   bool valid_handles=true;
//--- Iterate over all symbols in a loop and ...
   for(int s=0; s<SYMBOLS_COUNT; s++)
     {
      //--- If the symbol is available
      if(symbol_names[s]!=empty_symbol)
        {
         // And if the handle of the current symbol is invalid
         if(symbol_handles[s]==INVALID_HANDLE)
           {
            //--- Get it
            symbol_handles[s]=iATR(symbol_names[s],Period(),IndicatorPeriod);
            //--- If the handle could not be obtained, try again next time
            if(symbol_handles[s]==INVALID_HANDLE)
               valid_handles=false;
           }
        }
     }
//--- Print the relevant message if the handle for one of the symbols could not be obtained
   if(!valid_handles)
     {
      msg_last=msg_invalid_handle;
      ShowCanvasMessage(msg_invalid_handle);
     }
//---
   return(valid_handles);
  }
ShowCanvasMessage() 함수는 캔버스 작업을 위한 다른 함수와 함께 잠시 후에 검토됩니다.
지표 속성은 SetIndicatorProperties() 함수에서 설정됩니다. 각 플로팅 시리즈의 속성은 비슷하므로 루프를 사용하여 설정하는 것이 더 편리합니다.
//+------------------------------------------------------------------+
//| Setting indicator properties                                     |
//+------------------------------------------------------------------+
void SetIndicatorProperties()
  {
//--- Set the short name
   IndicatorSetString(INDICATOR_SHORTNAME,subwindow_shortname);
//--- Set the number of decimal places
   IndicatorSetInteger(INDICATOR_DIGITS,_Digits);
//--- Define buffers for drawing
   for(int s=0; s<SYMBOLS_COUNT; s++)
      SetIndexBuffer(s,atr_buffers[s].data,INDICATOR_DATA);
//--- Set labels for the current symbol
   for(int s=0; s<SYMBOLS_COUNT; s++)
      PlotIndexSetString(s,PLOT_LABEL,"ATR ("+IntegerToString(s)+", "+symbol_names[s]+")");
//--- Set the plotting type: lines
   for(int s=0; s<SYMBOLS_COUNT; s++)
      PlotIndexSetInteger(s,PLOT_DRAW_TYPE,DRAW_LINE);
//--- Set the line width
   for(int s=0; s<SYMBOLS_COUNT; s++)
      PlotIndexSetInteger(s,PLOT_LINE_WIDTH,1);
//--- Set the line color
   for(int s=0; s<SYMBOLS_COUNT; s++)
      PlotIndexSetInteger(s,PLOT_LINE_COLOR,line_colors[s]);
//--- Empty value for plotting where nothing will be drawn
   for(int s=0; s<SYMBOLS_COUNT; s++)
      PlotIndexSetDouble(s,PLOT_EMPTY_VALUE,EMPTY_VALUE);
  }
프로그램을 성공적으로 초기화한 후 OnCalculate() 함수를 처음 호출해야 합니다. prev_calculated 변수의 값은 첫 번째 함수 호출에서 0입니다. 또한 더 깊은 히스토리가 로드되거나 히스토리의 공백이 채워질 때 터미널에 의해 0이 됩니다. 이러한 경우 지표 버퍼가 완전히 다시 계산됩니다. 이 매개변수 값이 0이 아닌 경우, 즉 입력 시계열의 크기인 동일한 함수에서 이전에 반환된 결과인 경우 버퍼의 마지막 값만 업데이트하면 됩니다.
첫 번째 시도에서 항상 모든 계산을 올바르게 수행할 수 있는 것은 아닙니다. 이 경우 반환하기 위해 0 값을 포함하는 RESET 상수를 사용합니다. OnCalculate()의 다음 호출에서(예: 다음 틱에서) prev_calculated 매개변수는 0 값을 포함합니다. 차트에 지표의 플로팅 시리즈를 표시하기 전에 필요한 모든 계산을 수행하십시오.
그러나 차트는 시장이 닫히고 새로운 틱이 없거나 계산에 실패한 경우 비어 있는 상태로 유지됩니다. 이 경우 차트 시간 프레임을 수동으로 변경하여 다른 시도를 하도록 명령을 내리는 간단한 방법을 시도할 수 있습니다. 그러나 우리는 다른 접근 방식을 사용할 것입니다. 이것이 바로 처음에 타이머 OnTimer() 함수를 프로그램 템플릿에 추가하고 OnInit() 함수에서 시간 간격을 1초로 설정한 이유입니다.
매초 타이머는 OnCalculate() 함수가 0을 반환했는지 여부를 확인합니다. 이를 위해 OnCalculate()의 모든 매개변수를 접두어가 OC_인 해당 이름과 배열이 있는 전역 변수로 복사하는 CopyDataOnCalculate() 함수를 작성할 것입니다.
//+------------------------------------------------------------------+
//| Copying data from OnCalculate                                    |
//+------------------------------------------------------------------+
void CopyDataOnCalculate(const int      rates_total,
                         const int      prev_calculated,
                         const datetime &time[],
                         const double   &open[],
                         const double   &high[],
                         const double   &low[],
                         const double   &close[],
                         const long     &tick_volume[],
                         const long     &volume[],
                         const int      &spread[])
  {
   OC_rates_total=rates_total;
   OC_prev_calculated=prev_calculated;
   ArrayCopy(OC_time,time);
   ArrayCopy(OC_open,open);
   ArrayCopy(OC_high,high);
   ArrayCopy(OC_low,low);
   ArrayCopy(OC_close,close);
   ArrayCopy(OC_tick_volume,tick_volume);
   ArrayCopy(OC_volume,volume);
   ArrayCopy(OC_spread,spread);
  }
이 함수는 OnCalculate() 함수 본문의 맨 처음에 호출되어야 합니다. 또한 맨 처음에 다른 사용자 정의 함수 ResizeCalculatedArrays()도 추가해야 합니다. 이 함수는 데이터 준비를 위해 배열을 지표 버퍼에 배치하기 전에 배열의 크기를 설정합니다. 이러한 배열의 크기는 입력 시계열의 크기와 같아야 합니다.
//+------------------------------------------------------------------+
//| Resizing the size of arrays to the size of the main array        |
//+------------------------------------------------------------------+
void ResizeCalculatedArrays()
  {
   for(int s=0; s<SYMBOLS_COUNT; s++)
     {
      ArrayResize(tmp_symbol_time[s].time,OC_rates_total);
      ArrayResize(tmp_atr_values[s].value,OC_rates_total);
     }
  }
또한 데이터 준비를 위한 배열을 차트에 출력하기 전에 0으로 초기화하는 ZeroCalculatedArrays() 함수를 생성합니다.
//+------------------------------------------------------------------+
//| Zeroing out arrays for data preparation                          |
//+------------------------------------------------------------------+
void ZeroCalculatedArrays()
  {
   for(int s=0; s<SYMBOLS_COUNT; s++)
     {
      ArrayInitialize(tmp_symbol_time[s].time,NULL);
      ArrayInitialize(tmp_atr_values[s].value,EMPTY_VALUE);
     }
  }
지표 버퍼를 예비 제로 아웃하려면 동일한 기능이 필요합니다. ZeroIndicatorBuffers()라고 해봅시다.
//+------------------------------------------------------------------+
//| Zeroing out indicator buffers                                    |
//+------------------------------------------------------------------+
void ZeroIndicatorBuffers()
  {
   for(int s=0; s<SYMBOLS_COUNT; s++)
      ArrayInitialize(atr_buffers[s].data,EMPTY_VALUE);
  }
OnCalculate() 함수의 현재 코드는 아래와 같습니다. 나는 또한 나중에 채워질 주요 작업에 대한 설명을 제공했습니다(아래에 설명과 점).
//+------------------------------------------------------------------+
//| Custom indicator iteration function                              |
//+------------------------------------------------------------------+
int OnCalculate(const int      rates_total,     // Size of input time series
                const int      prev_calculated, // Bars processed at the previous call
                const datetime &time[],         // Opening time
                const double   &open[],         // Open prices
                const double   &high[],         // High prices
                const double   &low[],          // Low prices
                const double   &close[],        // Close prices
                const long     &tick_volume[],  // Tick volumes
                const long     &volume[],       // Real volumes
                const int      &spread[])       // Spread
  {
//--- For the purpose of determining the bar from which the calculation shall be made
   int limit=0;
//--- Make a copy of the OnCalculate() parameters
   CopyDataOnCalculate(rates_total,prev_calculated,
                       time,open,high,low,close,
                       tick_volume,volume,spread);
//--- Set the size to arrays for data preparation
   ResizeCalculatedArrays();
//--- If this is the first calculation or if a deeper history has been loaded or gaps in the history have been filled
   if(prev_calculated==0)
     {
      //--- Zero out arrays for data preparation
      ZeroCalculatedArrays();
      //--- Zero out indicator buffers
      ZeroIndicatorBuffers();
      //--- Other checks
      // ...
      //--- If you reached this point, it means that OnCalculate() will return non-zero value and this needs to be saved
      OC_prev_calculated=rates_total;
     }
//--- If only the last values need to be recalculated
   else
      limit=prev_calculated-1;

//--- Prepare data for drawing
// ...
//--- Fill arrays with data for drawing
// ...

//--- Return the size of the data array of the current symbol
   return(rates_total);
  }
현재 OnTimer() 함수 코드는 다음과 같습니다.
//+------------------------------------------------------------------+
//| Timer function                                                   |
//+------------------------------------------------------------------+
void OnTimer()
  {
//--- If for some reason calculations have not been completed or
//    a deeper history has been loaded or
//    gaps in the history have been filled,
//    then make another attempt without waiting for the new tick
   if(OC_prev_calculated==0)
     {
      OnCalculate(OC_rates_total,OC_prev_calculated,
                  OC_time,OC_open,OC_high,OC_low,OC_close,
                  OC_tick_volume,OC_volume,OC_spread);
     }
  }
이제 prev_calculated 변수가 0일 때 사용될 다른 함수를 살펴보겠습니다. 이러한 기능은 다음을 수행합니다.
- 필요한 양의 데이터(바)를 로드하고 생성합니다.
- 모든 핸들의 가용성을 확인하십시오.
- 필요한 데이터 양의 준비 상태를 확인하십시오.
- 서버와 데이터를 동기화합니다.
- 플로팅 시리즈를 그릴 바를 결정합니다.
또한 각 기호에 대한 첫 번째 '참' 바를 식별합니다. 또한 각 기호에 대한 첫 번째 '참' 바를 식별합니다. 이것이 의미하는 바입니다. MetaTrader 5의 모든 시간 프레임은 분 데이터로 구성됩니다. 그러나 예를 들어 서버의 일별 데이터는 1993년부터 사용할 수 있고 분 데이터는 2000년부터 사용할 수 있는 경우 시간별 차트 시간 프레임을 선택하면 분 데이터를 사용할 수 있게 된 날짜부터 바가 작성됩니다 (즉, 2000년부터). 2000년 이전의 모든 것은 일일 데이터 또는 현재 시간 프레임에 가장 가까운 데이터로 표시됩니다. 따라서 혼동을 피하기 위해 현재 시간 프레임과 관련이 없는 데이터에 대한 지표 데이터를 표시하지 않아야 합니다. 이것이 현재 시간 프레임의 첫 번째 '참' 바를 식별하고 기호의 지표 버퍼와 동일한 색상의 수직선으로 표시하는 이유입니다.
매개변수가 특정 시간 프레임에 최적화되어 있으면 다른 시간 프레임의 데이터가 부적절하기 때문에 Expert Advisors를 개발할 때 '참' 바를 식별하는 것도 중요합니다.
위의 검사를 실행하기 전에 지표 하위 창에 캔버스를 추가합니다. 따라서 먼저 캔버스를 관리하는 데 필요한 모든 기능을 작성해야 합니다. 캔버스를 하위 창에 추가하기 전에 캔버스에 표시할 텍스트 메시지를 기반으로 한 좌표와 크기를 결정해야 합니다. 이를 위해 GetSubwindowGeometry() 함수를 작성해 보겠습니다.
//+------------------------------------------------------------------+
//| Getting geometry of the indicator subwindow                      |
//+------------------------------------------------------------------+
void GetSubwindowGeometry()
  {
//--- Get the indicator subwindow number
   subwindow_number=ChartWindowFind(0,subwindow_shortname);
//--- Get the subwindow width and height
   chart_width=(int)ChartGetInteger(0,CHART_WIDTH_IN_PIXELS);
   subwindow_height=(int)ChartGetInteger(0,CHART_HEIGHT_IN_PIXELS,subwindow_number);
//--- Calculate the center of the subwindow
   subwindow_center_x=chart_width/2;
   subwindow_center_y=subwindow_height/2;
  }
서브 윈도우 속성을 획득하면 캔버스를 추가할 수 있습니다. 배경은 100% 투명하며(불투명도는 0임), 사용자에게 현재 일어나고 있는 일을 알리기 위해 데이터를 로드하고 생성할 때만 표시됩니다. 표시될 때 배경 불투명도는 190과 같습니다. 불투명도 값은 0과 255 사이에서 설정할 수 있습니다. 자세한 내용은 도움말 아래에 있는 ColorToARGB() 함수 설명을 참조하십시오.
캔버스를 설정하려면 SetCanvas() 함수를 작성해보겠습니다.
//+------------------------------------------------------------------+
//| Setting canvas                                                   |
//+------------------------------------------------------------------+
void SetCanvas()
  {
//--- If there is no canvas, set it
   if(ObjectFind(0,canvas_name)<0)
     {
      //--- Create the canvas
      canvas.CreateBitmapLabel(0,subwindow_number,canvas_name,0,0,chart_width,subwindow_height,clr_format);
      //--- Make the canvas completely transparent
      canvas.Erase(ColorToARGB(canvas_background,0));
      //--- Redraw the canvas
      canvas.Update();
     }
  }
또한 지표 하위 창의 크기가 조정되었는지 확인하는 함수가 필요합니다. 있는 경우 캔버스 크기가 새 하위 창 크기로 자동 조정됩니다. 이 함수를 OnSubwindowChange()라고 합시다.
//+------------------------------------------------------------------+
//| Checking the subwindow size                                      |
//+------------------------------------------------------------------+
void OnSubwindowChange()
  {
//--- Get subwindow properties
   GetSubwindowGeometry();
//--- If the subwindow size has not changed, exit
   if(!SubwindowSizeChanged())
      return;
//--- If the subwindow height is less than one pixel or if the center has been calculated incorrectly, exit
   if(subwindow_height<1 || subwindow_center_y<1)
      return;
//--- Set the new canvas size
   ResizeCanvas();
//--- Show the last message
   ShowCanvasMessage(msg_last);
  }
위 코드에서 강조 표시된 기능은 아래에서 탐색할 수 있습니다. 하위 창의 크기를 조정하기 전에 실행되는 검사 유형에 유의하십시오. 속성이 잘못된 것으로 판명되면 함수가 작동을 중지합니다.
SubwindowSizeChanged() 함수 코드는 다음과 같습니다.
//+------------------------------------------------------------------+
//| Checking if the subwindow has been resized                       |
//+------------------------------------------------------------------+
bool SubwindowSizeChanged()
  {
//--- If the subwindow size has not changed, exit
   if(last_chart_width==chart_width && last_subwindow_height==subwindow_height)
      return(false);
//--- If the size has changed, save it
   else
     {
      last_chart_width=chart_width;
      last_subwindow_height=subwindow_height;
     }
//---
   return(true);
  }
ResizeCanvas() 함수 코드는 다음과 같습니다.
//+------------------------------------------------------------------+
//| Resizing canvas                                                  |
//+------------------------------------------------------------------+
void ResizeCanvas()
  {
//--- If the canvas has already been added to the indicator subwindow, set the new size
   if(ObjectFind(0,canvas_name)==subwindow_number)
      canvas.Resize(chart_width,subwindow_height);
  }
마지막으로 다음은 이전에 지표 핸들을 가져올 때 사용한 ShowCanvasMessage() 함수 코드입니다.
//+------------------------------------------------------------------+
//| Displaying message on the canvas                                 |
//+------------------------------------------------------------------+
void ShowCanvasMessage(string message_text)
  {
   GetSubwindowGeometry();
//--- If the canvas has already been added to the indicator subwindow
   if(ObjectFind(0,canvas_name)==subwindow_number)
     {
      //--- If the string passed is not empty and correct coordinates have been obtained, display the message
      if(message_text!="" && subwindow_center_x>0 && subwindow_center_y>0)
        {
         canvas.Erase(ColorToARGB(canvas_background,canvas_opacity));
         canvas.TextOut(subwindow_center_x,subwindow_center_y,message_text,ColorToARGB(clrRed),TA_CENTER|TA_VCENTER);
         canvas.Update();
        }
     }
  }
캔버스가 사라지는 효과와 함께 삭제됩니다. 이를 구현하려면 캔버스를 삭제하기 직전에 루프에서 불투명도를 현재 값에서 0으로 점진적으로 변경하면서 반복할 때마다 캔버스를 새로 고쳐야 합니다.
DeleteCanvas() 함수 코드는 다음과 같습니다.
//+------------------------------------------------------------------+
//| Deleting canvas                                                  |
//+------------------------------------------------------------------+
void DeleteCanvas()
  {
//--- Delete the canvas if it exists
   if(ObjectFind(0,canvas_name)>0)
     {
      //--- Before deleting, implement the disappearing effect
      for(int i=canvas_opacity; i>0; i-=5)
        {
         canvas.Erase(ColorToARGB(canvas_background,(uchar)i));
         canvas.Update();
        }
      //--- Delete the graphical resource
      canvas.Destroy();
     }
  }
다음으로 데이터를 지표 버퍼에 넣고 차트에 표시하기 전에 데이터의 준비 상태를 확인하는 데 필요한 기능을 살펴보겠습니다. LoadAndFormData() 함수부터 시작하겠습니다. 현재 기호 배열의 크기를 다른 기호에 사용할 수 있는 데이터와 비교하는 데 사용합니다. 필요한 경우 데이터가 서버에서 로드됩니다. 기능 코드는 고려 사항에 대한 자세한 설명과 함께 제공됩니다.
//+------------------------------------------------------------------+
//| Loading and generating the necessary/available amount of data    |
//+------------------------------------------------------------------+
void LoadAndFormData()
  {
   int bars_count=100; // Number of loaded bars
//---
   for(int s=0; s<SYMBOLS_COUNT; s++)
     {
      int      attempts          =0;    // Counter of data copying attempts
      int      array_size        =0;    // Array size
      datetime firstdate_server  =NULL; // Time of the first bar on the server
      datetime firstdate_terminal=NULL; // Time of the first bar in the terminal base
      //--- Get the first date by the symbol/time frame in the terminal base
      SeriesInfoInteger(symbol_names[s],Period(),SERIES_FIRSTDATE,firstdate_terminal);
      //--- Get the first date of the symbol/time frame on the server
      SeriesInfoInteger(symbol_names[s],Period(),SERIES_SERVER_FIRSTDATE,firstdate_server);
      //--- Print the message
      msg_last=msg_load_data="Loading and generating data: "+
               symbol_names[s]+"("+(string)(s+1)+"/"+(string)SYMBOLS_COUNT+") ... ";
      ShowCanvasMessage(msg_load_data);
      //--- Load/generate data.
      //    If the array size is smaller than the maximum number of bars in the terminal, and if
      //    the number of bars between the first date of the series in the terminal and the first date of the series on the server is more than specified
      while(array_size<OC_rates_total &&
            firstdate_terminal-firstdate_server>PeriodSeconds()*bars_count)
        {
         datetime copied_time[];
         //--- Get the first date by the symbol/time frame in the terminal base
         SeriesInfoInteger(symbol_names[s],Period(),SERIES_FIRSTDATE,firstdate_terminal);
         //--- Load/copy the specified number of bars
         if(CopyTime(symbol_names[s],Period(),0,array_size+bars_count,copied_time)!=-1)
           {
            //--- If the time of the first bar in the array, excluding the number of the bars being loaded, is earlier
            //    than the time of the first bar in the chart, terminate the loop
            if(copied_time[0]-PeriodSeconds()*bars_count<OC_time[0])
               break;
            //--- If the array size hasn't increased, increase the counter
            if(ArraySize(copied_time)==array_size)
               attempts++;
            //--- Otherwise get the current size of the array
            else
               array_size=ArraySize(copied_time);
            //--- If the array size hasn't increased over 100 attempts, terminate the loop
            if(attempts==100)
              {
               attempts=0;
               break;
              }
           }
         //--- Check the subwindow size once every 2000 bars
         //    and if the size has changed, adjust the canvas size to it
         if(!(array_size%2000))
            OnSubwindowChange();
        }
     }
  }
필요한 양의 데이터를 로드하려고 시도한 후 지표 핸들을 다시 한 번 확인합니다. 이를 위해 위에서 고려한 GetIndicatorHandles() 함수를 사용합니다.
핸들이 확인되면 프로그램은 CheckAvailableData() 함수를 사용하여 지정된 기호의 데이터 및 각 기호에 대한 지표 값의 가용성을 확인합니다. 아래에서 이것이 어떻게 수행되는지 자세히 볼 수 있습니다.
//+------------------------------------------------------------------+
//| Checking the amount of available data for all symbols            |
//+------------------------------------------------------------------+
bool CheckAvailableData()
  {
   for(int s=0; s<SYMBOLS_COUNT; s++)
     {
      //--- If this symbol is available
      if(symbol_names[s]!=empty_symbol)
        {
         double   data[]; // Array for checking the amount of indicator data
         datetime time[]; // Array for checking the number of bars
         int      calculated_values =0;    // Amount of indicator data
         int      available_bars    =0;    // Number of bars of the current period
         datetime firstdate_terminal=NULL; // First date of the current time frame data available in the terminal
         //--- Get the number of calculated values of the indicator
         calculated_values=BarsCalculated(symbol_handles[s]);
         //--- Get the first date of the current time frame data in the terminal
         firstdate_terminal=(datetime)SeriesInfoInteger(symbol_names[s],Period(),SERIES_TERMINAL_FIRSTDATE);
         //--- Get the number of available bars from the date specified
         available_bars=Bars(symbol_names[s],Period(),firstdate_terminal,TimeCurrent());
         //--- Check the readiness of bar data: 5 attempts to get values
         for(int i=0; i<5; i++)
           {
            //--- Copy the specified amount of data
            if(CopyTime(symbol_names[s],Period(),0,available_bars,time)!=-1)
              {
               //--- If the required amount has been copied, terminate the loop
               if(ArraySize(time)>=available_bars)
                  break;
              }
           }
         //--- Check the readiness of indicator data: 5 attempts to get values
         for(int i=0; i<5; i++)
           {
            //--- Copy the specified amount of data
            if(CopyBuffer(symbol_handles[s],0,0,calculated_values,data)!=-1)
              {
               //--- If the required amount has been copied, terminate the loop
               if(ArraySize(data)>=calculated_values)
                  break;
              }
           }
         //--- If the amount of data copied is not sufficient, one more attempt is required
         if(ArraySize(time)<available_bars || ArraySize(data)<calculated_values)
           {
            msg_last=msg_prepare_data;
            ShowCanvasMessage(msg_prepare_data);
            OC_prev_calculated=0;
            return(false);
           }
        }
     }
//---
   return(true);
  }
CheckAvailableData() 함수는 모든 기호에 대한 데이터가 준비될 때까지 추가 계산을 허용하지 않습니다. 모든 검사 기능의 작동은 유사한 패턴을 따릅니다.
다음 함수는 따옴표의 더 깊은 기록을 로드하는 이벤트를 모니터링하는 데 필요합니다. CheckEventLoadHistory()라고 합시다. 더 많은 양의 데이터가 로드되면 지표가 완전히 다시 계산되어야 합니다. 이 함수의 소스 코드는 다음과 같습니다.
//+------------------------------------------------------------------+
//| Checking the event of loading a deeper history                   |
//+------------------------------------------------------------------+
bool CheckLoadedHistory()
  {
   bool loaded=false;
//---
   for(int s=0; s<SYMBOLS_COUNT; s++)
     {
      //--- If this symbol is available
      if(symbol_names[s]!=empty_symbol)
        {
         //--- If the series need to be updated
         if(OC_prev_calculated==0)
           {
            //--- Get the first date by the symbol/time frame
            series_first_date[s]=(datetime)SeriesInfoInteger(symbol_names[s],Period(),SERIES_FIRSTDATE);
            //--- If this is the first time (no value is available), then
            if(series_first_date_last[s]==NULL)
               //--- Store the first date by the symbol/time frame for further comparison
               //    in order to determine if a deeper history has been loaded
               series_first_date_last[s]=series_first_date[s];
           }
         else
           {
            //--- Get the first date by the symbol/time frame
            series_first_date[s]=(datetime)SeriesInfoInteger(symbol_names[s],Period(),SERIES_FIRSTDATE);
            //--- If the dates are different, i.e. the date in the memory is later than the one we have just obtained,
            //     this means that a deeper history has been loaded
            if(series_first_date_last[s]>series_first_date[s])
              {
               //--- Print the relevant message to the log
               Print("(",symbol_names[s],",",TimeframeToString(Period()),
                     ") > A deeper history has been loaded/generated: ",
                     series_first_date_last[s]," > ",series_first_date[s]);
               //--- Store the date
               series_first_date_last[s]=series_first_date[s];
               loaded=true;
              }
           }
        }
     }
//--- If a deeper history has been loaded/generated, then
//    send the command to refresh the plotting series of the indicator
   if(loaded)
      return(false);
//---
   return(true);
  }
터미널과 서버의 데이터 간의 동기화를 확인하는 또 다른 함수를 작성해보겠습니다. 이 검사는 서버에 대한 연결이 설정된 경우에만 실행됩니다. CheckSymbolIsSynchronized() 함수 코드는 다음과 같습니다.
//+------------------------------------------------------------------+
//| Checking synchronization by symbol/time frame                    |
//+------------------------------------------------------------------+
bool CheckSymbolIsSynchronized()
  {
//--- If the connection to the server is established, check the data synchronization
   if(TerminalInfoInteger(TERMINAL_CONNECTED))
     {
      for(int s=0; s<SYMBOLS_COUNT; s++)
        {
         //--- If the symbol is available
         if(symbol_names[s]!=empty_symbol)
           {
            //--- If the data are not synchronized, print the relevant message and try again
            if(!SeriesInfoInteger(symbol_names[s],Period(),SERIES_SYNCHRONIZED))
              {
               msg_last=msg_not_synchronized;
               ShowCanvasMessage(msg_not_synchronized);
               return(false);
              }
           }
        }
     }
//---
   return(true);
  }
시간 프레임을 문자열로 변환하는 함수는 "MQL5 Cookbook" 시리즈의 이전 글에서 가져옵니다.
//+------------------------------------------------------------------+
//| Converting time frame to a string                                |
//+------------------------------------------------------------------+
string TimeframeToString(ENUM_TIMEFRAMES timeframe)
  {
   string str="";
//--- If the value passed is incorrect, take the current chart time frame
   if(timeframe==WRONG_VALUE || timeframe== NULL)
      timeframe= Period();
   switch(timeframe)
     {
      case PERIOD_M1  : str="M1";  break;
      case PERIOD_M2  : str="M2";  break;
      case PERIOD_M3  : str="M3";  break;
      case PERIOD_M4  : str="M4";  break;
      case PERIOD_M5  : str="M5";  break;
      case PERIOD_M6  : str="M6";  break;
      case PERIOD_M10 : str="M10"; break;
      case PERIOD_M12 : str="M12"; break;
      case PERIOD_M15 : str="M15"; break;
      case PERIOD_M20 : str="M20"; break;
      case PERIOD_M30 : str="M30"; break;
      case PERIOD_H1  : str="H1";  break;
      case PERIOD_H2  : str="H2";  break;
      case PERIOD_H3  : str="H3";  break;
      case PERIOD_H4  : str="H4";  break;
      case PERIOD_H6  : str="H6";  break;
      case PERIOD_H8  : str="H8";  break;
      case PERIOD_H12 : str="H12"; break;
      case PERIOD_D1  : str="D1";  break;
      case PERIOD_W1  : str="W1";  break;
      case PERIOD_MN1 : str="MN1"; break;
     }
//---
   return(str);
  }
마지막으로 차트에서 수직선으로 표시하여 각 기호에 대한 첫 번째 실제 바를 식별하고 저장해야 합니다. 이를 위해 DetermineFirstTrueBar() 함수와 첫 번째 실제 바의 시간을 반환하는 보조 함수 GetFirstTrueBarTime()을 작성해 보겠습니다.
//+-----------------------------------------------------------------------+
//| Determining the time of the first true bar for the purpose of drawing |
//+-----------------------------------------------------------------------+
bool DetermineFirstTrueBar()
  {
   for(int s=0; s<SYMBOLS_COUNT; s++)
     {
      datetime time[];           // Bar time array
      int      available_bars=0; // Number of bars
      //--- If this symbol is not available, move to the next one
      if(symbol_names[s]==empty_symbol)
         continue;
      //--- Get the total number of bars for the symbol
      available_bars=Bars(symbol_names[s],Period());
      //--- Copy the bar time array. If this action failed, try again.
      if(CopyTime(symbol_names[s],Period(),0,available_bars,time)<available_bars)
         return(false);
      //--- Get the time of the first true bar corresponding to the current time frame
      limit_time[s]=GetFirstTrueBarTime(time);
      //--- Place a vertical line on the true bar
      CreateVerticalLine(0,0,limit_time[s],prefix+symbol_names[s]+": begin time series",
                          2,STYLE_SOLID,line_colors[s],false,TimeToString(limit_time[s]),"\n");
     }
//---
   return(true);
  }
//+-----------------------------------------------------------------------+
//| Returning the time of the first true bar of the current time frame    |
//+-----------------------------------------------------------------------+
datetime GetFirstTrueBarTime(datetime &time[])
  {
   datetime true_period =NULL; // Time of the first true bar
   int      array_size  =0;    // Array size
//--- Get the array size
   array_size=ArraySize(time);
   ArraySetAsSeries(time,false);
//--- Check each bar one by one
   for(int i=1; i<array_size; i++)
     {
      //--- If the bar corresponds to the current time frame
      if(time[i]-time[i-1]==PeriodSeconds())
        {
         //--- Save it and terminate the loop
         true_period=time[i];
         break;
        }
     }
//--- Return the time of the first true bar
   return(true_period);
  }
첫 번째 실제 바의 시간은 CreateVerticalLine() 함수를 사용하여 차트에 세로선으로 표시됩니다.
//+------------------------------------------------------------------+
//| Creating a vertical line at the specified time point             |
//+------------------------------------------------------------------+
void CreateVerticalLine(long            chart_id,           // chart id
                        int             window_number,      // window number
                        datetime        time,               // time
                        string          object_name,        // object name
                        int             line_width,         // line width
                        ENUM_LINE_STYLE line_style,         // line style
                        color           line_color,         // line color
                        bool            selectable,         // cannot select the object if FALSE
                        string          description_text,   // text of the description
                        string          tooltip)            // no tooltip if "\n"
  {
//--- If the object has been created successfully
   if(ObjectCreate(chart_id,object_name,OBJ_VLINE,window_number,time,0))
     {
      //--- set its properties
      ObjectSetInteger(chart_id,object_name,OBJPROP_TIME,time);
      ObjectSetInteger(chart_id,object_name,OBJPROP_SELECTABLE,selectable);
      ObjectSetInteger(chart_id,object_name,OBJPROP_STYLE,line_style);
      ObjectSetInteger(chart_id,object_name,OBJPROP_WIDTH,line_width);
      ObjectSetInteger(chart_id,object_name,OBJPROP_COLOR,line_color);
      ObjectSetString(chart_id,object_name,OBJPROP_TEXT,description_text);
      ObjectSetString(chart_id,object_name,OBJPROP_TOOLTIP,tooltip);
     }
  }
확인 기능이 준비되었습니다. 결과적으로 prev_calculated 변수가 0일 때 OnCalculate() 함수 코드의 일부는 이제 아래와 같이 표시됩니다.
//--- If this is the first calculation or if a deeper history has been loaded or gaps in the history have been filled
   if(prev_calculated==0)
     {
      //--- Zero out arrays for data preparation
      ZeroCalculatedArrays();
      //--- Zero out indicator buffers
      ZeroIndicatorBuffers();
      //--- Get subwindow properties
      GetSubwindowGeometry();
      //--- Add the canvas
      SetCanvas();
      //--- Load and generate the necessary/available amount of data
      LoadAndFormData();
      //--- If there is an invalid handle, try to get it again
      if(!GetIndicatorHandles())
         return(RESET);
      //--- Check the amount of data available for all symbols
      if(!CheckAvailableData())
         return(RESET);
      //--- Check if a deeper history has been loaded
      if(!CheckLoadedHistory())
         return(RESET);
      //--- Check synchronization by symbol/time frame at the current moment
      if(!CheckSymbolIsSynchronized())
         return(RESET);
      //--- For each symbol, determine the bar from which we should start drawing
      if(!DetermineFirstTrueBar())
         return(RESET);
      //--- If you reached this point, it means that OnCalculate() will return non-zero value and this needs to be saved
      OC_prev_calculated=rates_total;
     }
이제 특정 검사가 실패할 때마다 프로그램은 뒤로 이동하여 다음 틱 또는 타이머 이벤트에서 다시 시도합니다. 타이머에서 OnCalculate() 함수 외부에 더 깊은 기록을 로드하기 위한 검사도 실행해야 합니다.
//+------------------------------------------------------------------+
//| Timer function                                                   |
//+------------------------------------------------------------------+
void OnTimer()
  {
//--- If a deeper history has been loaded
   if(!CheckLoadedHistory())
      OC_prev_calculated=0;
//--- If for some reason calculations have not been completed or
//    a deeper history has been loaded or
//    gaps in the history have been filled,
//    then make another attempt without waiting for the new tick
   if(OC_prev_calculated==0)
     {
      OnCalculate(OC_rates_total,OC_prev_calculated,
                  OC_time,OC_open,OC_high,OC_low,OC_close,
                  OC_tick_volume,OC_volume,OC_spread);
     }
  }
이제 OnCalculate() 함수에 배치할 두 개의 주요 루프만 작성하면 됩니다.
- 첫 번째 루프는 지표 계열의 공백을 피하기 위해 "꼭 값을 가져옵니다"라는 원칙에 따라 데이터를 준비합니다. 그 이면의 아이디어는 간단합니다. 값을 얻지 못할 경우 주어진 횟수만큼 시도합니다. 이 루프에서 기호의 시간 값과 변동성 지표(ATR) 값은 별도의 배열에 저장됩니다.
- 두 번째 메인 루프에서 지표 버퍼를 채울 때 현재 기호의 시간과 모든 플로팅 시리즈의 동기화를 비교하기 위해 다른 기호의 시간 배열이 필요합니다.
첫 번째 루프의 코드는 다음과 같습니다.
//--- Prepare data for drawing
   for(int s=0; s<SYMBOLS_COUNT; s++)
     {
      //--- If the symbol is available
      if(symbol_names[s]!=empty_symbol)
        {
         double percent=0.0; // For the purpose of calculating the progress percentage
         msg_last=msg_sync_update="Preparing data ("+IntegerToString(rates_total)+" bars) : "+
                      symbol_names[s]+"("+(string)(s+1)+"/"+(string)(SYMBOLS_COUNT)+") - 00% ... ";
         //--- Print the message
         ShowCanvasMessage(msg_sync_update);
         //--- Control every value of the array
         for(int i=limit; i<rates_total; i++)
           {
            PrepareData(i,s,time);
            //--- Refresh the message once every 1000 bars
            if(i%1000==0)
              {
               //--- Progress percentage
               ProgressPercentage(i,s,percent);
               //--- Print the message
               ShowCanvasMessage(msg_sync_update);
              }
            //--- Check the subwindow size once every 2000 bars
            //    and if the size has changed, adjust the canvas size to it
            if(i%2000==0)
               OnSubwindowChange();
           }
        }
     }
값을 복사하고 저장하는 주요 기능인 PrepareData()는 위 코드에서 강조표시되어 있습니다. 아직 고려되지 않은 새로운 기능인 ProgressPercentage()도 있습니다. 현재 작업의 진행률을 계산하여 사용자에게 작업이 얼마나 오래 지속되는지 알려줍니다.
PrepareData() 함수의 코드는 다음과 같습니다.
//+------------------------------------------------------------------+
//| Preparing data before drawing                                    |
//+------------------------------------------------------------------+
void PrepareData(int bar_index,int symbol_number,datetime const &time[])
  {
   int attempts=100; // Number of copying attempts
//--- Time of the bar of the specified symbol and time frame
   datetime symbol_time[];
//--- Array for copying indicator values
   double atr_values[];
//--- If within the area of the current time frame bars
   if(time[bar_index]>=limit_time[symbol_number])
     {
      //--- Copy the time
      for(int i=0; i<attempts; i++)
        {
         if(CopyTime(symbol_names[symbol_number],0,time[bar_index],1,symbol_time)==1)
           {
            tmp_symbol_time[symbol_number].time[bar_index]=symbol_time[0];
            break;
           }
        }
      //--- Copy the indicator value
      for(int i=0; i<attempts; i++)
        {
         if(CopyBuffer(symbol_handles[symbol_number],0,time[bar_index],1,atr_values)==1)
           {
            tmp_atr_values[symbol_number].value[bar_index]=atr_values[0];
            break;
           }
        }
     }
//--- If outside the area of the current time frame bars, set an empty value
   else
      tmp_atr_values[symbol_number].value[bar_index]=EMPTY_VALUE;
  }
ProgressPercentage() 함수의 코드는 다음과 같습니다.
//+------------------------------------------------------------------+
//| Calculating progress percentage                                  |
//+------------------------------------------------------------------+
void ProgressPercentage(int bar_index,int symbol_number,double &percent)
  {
   string message_text="";
   percent=(double(bar_index)/OC_rates_total)*100;
//---
   if(percent<=9.99)
      message_text="0"+DoubleToString(percent,0);
   else if(percent<99)
      message_text=DoubleToString(percent,0);
   else
      message_text="100";
//---
   msg_last=msg_sync_update="Preparing data ("+(string)OC_rates_total+" bars) : "+
            symbol_names[symbol_number]+
            "("+(string)(symbol_number+1)+"/"+(string)SYMBOLS_COUNT+") - "+message_text+"% ... ";
  }
지표 버퍼는 OnCalculate() 함수의 두 번째 기본 루프에서 채워집니다.
//--- Fill indicator buffers
   for(int s=0; s<SYMBOLS_COUNT; s++)
     {
      //--- If the specified symbol does not exist, zero out the buffer
      if(symbol_names[s]==empty_symbol)
         ArrayInitialize(atr_buffers[s].data,EMPTY_VALUE);
      else
        {
         //--- Generate a message
         msg_last=msg_sync_update="Updating indicator data: "+
                      symbol_names[s]+"("+(string)(s+1)+"/"+(string)SYMBOLS_COUNT+") ... ";
         //--- Print the message
         ShowCanvasMessage(msg_sync_update);
         //--- Fill indicator buffers with values
         for(int i=limit; i<rates_total; i++)
           {
            FillIndicatorBuffers(i,s,time);
            //--- Check the subwindow size once every 2000 bars
            //    and if the size has changed, adjust the canvas size to it
            if(i%2000==0)
               OnSubwindowChange();
           }
        }
     }
위 코드에서 강조 표시된 문자열에는 FillIndicatorBuffers() 함수가 포함되어 있습니다. 차트에 지표의 플로팅 시리즈를 표시하기 전에 최종 작업이 수행되는 곳입니다.
//+------------------------------------------------------------------+
//| Filling indicator buffers                                        |
//+------------------------------------------------------------------+
void FillIndicatorBuffers(int bar_index,int symbol_number,datetime const &time[])
  {
//--- For the purpose of checking the obtained indicator value
   bool check_value=false;
//--- Counter of the current time frame bars
   static int bars_count=0;
//--- Zero out the counter of the current time frame bars at the beginning of the symbol's time series
   if(bar_index==0)
      bars_count=0;
//--- If within the area of current time frame bars and the counter is smaller
//    than the specified indicator period, increase the counter
   if(bars_count<IndicatorPeriod && time[bar_index]>=limit_time[symbol_number])
      bars_count++;
//--- If within the indicator area and the time of the current symbol coincides with the time of the specified symbol
   if(bars_count>=IndicatorPeriod &&
      time[bar_index]==tmp_symbol_time[symbol_number].time[bar_index])
     {
      //--- If the value obtained is not empty
      if(tmp_atr_values[symbol_number].value[bar_index]!=EMPTY_VALUE)
        {
         check_value=true;
         atr_buffers[symbol_number].data[bar_index]=tmp_atr_values[symbol_number].value[bar_index];
        }
     }
//--- Set an empty value in case of failure to set a higher value
   if(!check_value)
      atr_buffers[symbol_number].data[bar_index]=EMPTY_VALUE;
  }
OnCalculate() 함수가 끝나면 캔버스를 삭제하고 수준을 설정하고 메시지 변수를 0으로 만들고 차트를 새로 고쳐야 합니다. 마지막으로 rates_total 배열 크기가 반환되며, 이후 OnCalculate()의 각 후속 틱 또는 타이머 이벤트에서 마지막 값만 다시 계산됩니다.
다음은 두 번째 메인 루프와 함수에서 반환된 값 사이에 삽입할 코드 문자열입니다.
//--- Delete the canvas
   DeleteCanvas();
//--- Set indicator levels
   SetIndicatorLevels();
//--- Zero out variables
   msg_last="";
   msg_sync_update="";
//--- Refresh the chart
   ChartRedraw();
수평 레벨 설정을 위한 SetIndicatorLevels() 함수의 코드는 다음과 같습니다.
//+------------------------------------------------------------------------+
//| Setting indicator levels                                               |
//+------------------------------------------------------------------------+
void SetIndicatorLevels()
  {
//--- Get the indicator subwindow number
   subwindow_number=ChartWindowFind(0,subwindow_shortname);
//--- Set levels
   for(int i=0; i<LEVELS_COUNT; i++)
      CreateHorizontalLine(0,subwindow_number,
                            prefix+"level_0"+(string)(i+1)+"",
                            CorrectValueBySymbolDigits(indicator_levels[i]*_Point),
                            1,STYLE_DOT,clrLightSteelBlue,false,false,false,"\n");
  }
//+------------------------------------------------------------------------+
//| Adjusting the value based on the number of digits in the price (double)|
//+------------------------------------------------------------------------+
double CorrectValueBySymbolDigits(double value)
  {
   return(_Digits==3 || _Digits==5) ? value*=10 : value;
  }
지정된 속성으로 수평 레벨을 설정하기 위한 CreateHorizontalLine() 함수 코드는 다음과 같습니다.
//+------------------------------------------------------------------+
//| Creating a horizontal line at the price level specified          |
//+------------------------------------------------------------------+
void CreateHorizontalLine(long            chart_id,      // chart id
                          int             window_number, // window number
                          string          object_name,   // object name
                          double          price,         // price level
                          int             line_width,    // line width
                          ENUM_LINE_STYLE line_style,    // line style
                          color           line_color,    // line color
                          bool            selectable,    // cannot select the object if FALSE
                          bool            selected,      // line is selected
                          bool            back,          // background position
                          string          tooltip)       // no tooltip if "\n"
  {
//--- If the object has been created successfully
   if(ObjectCreate(chart_id,object_name,OBJ_HLINE,window_number,0,price))
     {
      //--- set its properties
      ObjectSetInteger(chart_id,object_name,OBJPROP_SELECTABLE,selectable);
      ObjectSetInteger(chart_id,object_name,OBJPROP_SELECTED,selected);
      ObjectSetInteger(chart_id,object_name,OBJPROP_BACK,back);
      ObjectSetInteger(chart_id,object_name,OBJPROP_STYLE,line_style);
      ObjectSetInteger(chart_id,object_name,OBJPROP_WIDTH,line_width);
      ObjectSetInteger(chart_id,object_name,OBJPROP_COLOR,line_color);
      ObjectSetString(chart_id,object_name,OBJPROP_TOOLTIP,tooltip);
     }
  }
그래픽 개체 삭제 기능::
//+------------------------------------------------------------------+
//| Deleting levels                                                  |
//+------------------------------------------------------------------+
void DeleteLevels()
  {
   for(int i=0; i<LEVELS_COUNT; i++)
      DeleteObjectByName(prefix+"level_0"+(string)(i+1)+"");
  }
//+------------------------------------------------------------------+
//| Deleting vertical lines of the beginning of the series           |
//+------------------------------------------------------------------+
void DeleteVerticalLines()
  {
   for(int s=0; s<SYMBOLS_COUNT; s++)
      DeleteObjectByName(prefix+symbol_names[s]+": begin time series");
  }
//+------------------------------------------------------------------+
//| Deleting the object by name                                      |
//+------------------------------------------------------------------+
void DeleteObjectByName(string object_name)
  {
//--- If such object exists
   if(ObjectFind(0,object_name)>=0)
     {
      //--- If an error occurred when deleting, print the relevant message
      if(!ObjectDelete(0,object_name))
         Print("Error ("+IntegerToString(GetLastError())+") when deleting the object!");
     }
  }
OnDeinit() 함수에 다음 코드를 추가해야 합니다.
이제 모든 것이 준비되었으며 철저히 테스트할 수 있습니다. 창의 최대 바 수는 터미널 설정의 차트 탭에서 설정할 수 있습니다. 지표를 실행할 준비가 되는 속도는 창의 바 수에 따라 달라집니다.

그림 1. 터미널 설정에서 최대 바 수 설정
지표를 차트에 로드할 때 모든 기호에 대한 데이터 준비 진행 상황을 볼 수 있습니다.

그림 2. 데이터 준비 중 캔버스의 메시지
아래에서 20분 단위로 지표를 표시하는 스크린샷을 볼 수 있습니다.

그림 3. 20분 단위의 다중 기호 ATR 지표
'true' 바의 시작 부분은 차트에서 수직선으로 표시됩니다. 아래 스크린샷은 NZDUSD(노란색 선)의 실제 바가 2000년(MetaQuotes-Demo 서버)부터 시작하는 반면 다른 모든 통화 쌍의 경우 실제 바가 1999년 초에 나타나는 것을 보여주게 되는데, 그런 이유로 오직 한 라인만 표시됩니다 (모두 같은 날짜에 있음). 또한 1999년 이전에는 마침표 구분 기호의 간격이 더 작아서 바의 시간을 분석하면 일일 바임을 알 수 있습니다.
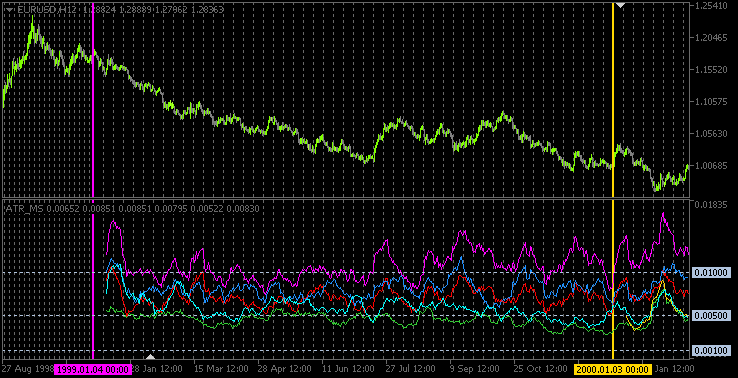
그림 4. 수직선은 각 기호에 대한 실제 바의 시작을 표시합니다.
결론
글은 여기서 마쳐도 될 것 같습니다. 설명된 소스 코드는 글에 첨부되어 있으며 다운로드 가능합니다. 향후에 올라올 글 중 하나에서 우리는 변동성을 분석하고 그 결과를 확인하는 거래 시스템을 구현하려고 노력해볼 것입니다.
MetaQuotes 소프트웨어 사를 통해 러시아어가 번역됨.
원본 기고글: https://www.mql5.com/ru/articles/752
경고: 이 자료들에 대한 모든 권한은 MetaQuotes(MetaQuotes Ltd.)에 있습니다. 이 자료들의 전부 또는 일부에 대한 복제 및 재출력은 금지됩니다.
이 글은 사이트 사용자가 작성했으며 개인의 견해를 반영합니다. Metaquotes Ltd는 제시된 정보의 정확성 또는 설명 된 솔루션, 전략 또는 권장 사항의 사용으로 인한 결과에 대해 책임을 지지 않습니다.

 다중 통화 다중 시스템 Expert Advisor 만들기
하지만 시프트 바를 수동으로 설정하고 표시기를 아래 PRICE_CLOSE로 계산하도록 변경한 후에도 테스터와 실제 사진에 이 그림이 있습니다:
최근에 MT를 사용하면서 한 가지 부정적인 점이 있는데, 그것은 다중 시스템에서 표준 지표를 사용하는 결함이며 작동하지 않습니다. 나는 이것이 비뚤어진 손의 잘못이 아니라는 것을 알아 내기 위해 너무 많은 시간을 보냈습니다. 최신 업데이트를 사용하면 점점 더 나빠집니다. 아마도 주인은 절망의 바보들이이 기적에 두 개의 마쉬카를 사용하여 할 일없이 병합 할 것이라는 사실에 의지하고있을 것입니다.
좋아요, 하지만 시프트바를 수동으로 설정한 후에도 테스터에 이 사진이 아래에 있습니다:
...
최근에 MT를 사용하면서 한 가지 부정적인 점이 있는데, 그것은 다중 시스템에서 표준 표시기를 사용하는 결함이 있으며 작동하지 않는다는 것입니다. 최신 업데이트를 사용하면 점점 더 나빠집니다. 아마도 마스터들은 바보들이 할 일없이 병합하기 위해 필사적으로이 기적에 두 개의 마쉬카를 사용할 것이라는 사실에 의존하고있을 것입니다.
나는이 양식의 테스터 에서이 표시기를 테스트하지도 않았습니다. 테스터에게는 불필요한 것들이 많이 있습니다. 기사에서도 이에 대해 아무 말도하지 않습니다.
전문가 고문으로부터 데이터를 가져 오면 다른 기호 및 시간대의 테스터에서 지표를 사용하는 데 문제가 있음을 발견하지 못했습니다.
알아낼 필요가 있습니다. 아직 답이 없습니다.
... 변동성 ... 진정한 바 ...
기사가 무슨 말을하는지 명확하지 않습니다 ?!
... 현재 TF (?!)의 다른 TF (일부 주요 막대 별)의 변동성 판독 값 (ATR)에 관한 것입니다.
그리고 "진정한 바"에서-아마도 (내가 올바르게 이해했다면) - 다른 TF (??)에서 바를 여는 것을 의미합니다 (??)
예 : TF m15가있는 True Bar , 개장 시간 xx : 15 분, xx : 30 분 (?!).