
MQL5 Tarif Defteri Birkaç Zaman Aralığını Tek bir Pencerede Görüntüleme
Giriş
Bir pozisyon açmak için yönü seçerken, aynı anda görüntülenen birçok zaman aralığı olan bir fiyat grafiği oldukça faydalı olabilir. MetaTrader 5 İstemci Terminali analiz için 21 zaman aralığı sağlar. Mevcut grafiğe yerleştirebileceğiniz özel grafik nesnelerinden yararlanabilir ve sembolü, zaman aralığını ve diğer bazı özellikleri tam buradan ayarlayabilirsiniz. Bu grafik nesnelerinden herhangi bir sayıda ekleyebilirsiniz, ancak bu, manuel olarak yapıldığından oldukça kullanışsız ve zaman alıcı olacaktır. Hepsinden de öte, tüm grafik özellikleri manuel modda ayarlanamamaktadır.
Bu makalede, bu grafik nesnelerine daha yakından bakacağız. Örnekleme amacıyla, bir alt pencerede aynı anda birçok grafik nesnesi ayarlamamıza olanak sağlayacak kontrollere (düğmelere) sahip bir gösterge oluşturacağız. Ayrıca, grafik nesneleri alt pencereye tam olarak sığar ve ana grafik veya terminal penceresi yeniden boyutlandırıldığında otomatik olarak ayarlanır.
Grafik nesneleri eklemek için düğmelere ek olarak, programlı olarak değiştirilebilenler dahil olmak üzere grafik özelliklerinden bazılarının etkinleştirilmesi/devre dışı bırakılmasına yönelik düğmelerimiz de vardır.
Geliştirme
Ekle menüsü->Nesneler->Grafik Nesneleri->Grafik yolunu kullanarak bir grafik nesnesini manuel olarak ekleyebilirsiniz. Örneğin H4 ve D1 zaman aralıklarına sahip nesneler 1 Saatlik grafikte şu şekilde gösterilir:
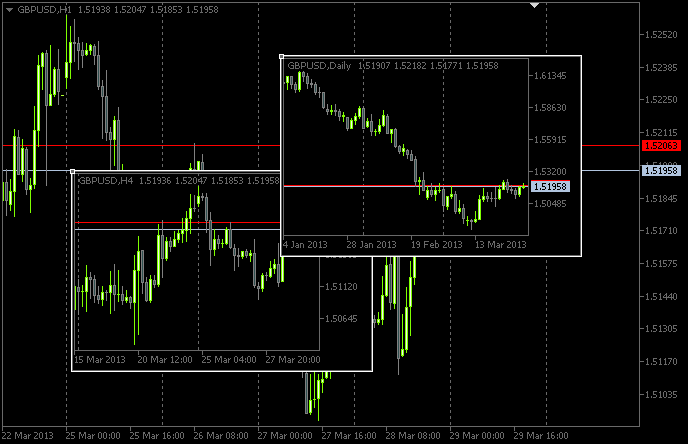
Şekil 1. Grafik nesneleri
Nesne parametrelerini değiştirerek yalnızca sınırlı bir özellikler setini yönetebilirsiniz:
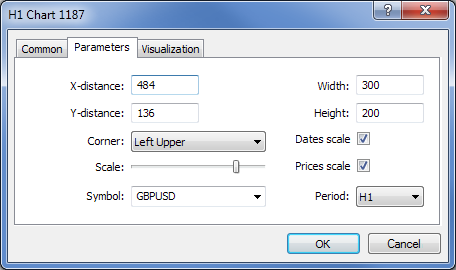
Şekil 2. Grafik nesnesi özellikleri
Ancak, satış (ask) ve alış (bid) fiyat seviyeleri, sağ grafik kenarından girintili şekilde, alım satım seviyeleri vb. gibi parametreler yalnızca uygun bir şekilde programlandığında görüntülenebilir.
Hadi gösterge geliştirmeye başlayalım. Diyelim ki, bunun adını ChartObjects (makalenin çalışma başlığı) koyduk. MQL5 Sihirbazını kullanarak MetaEditor'da gösterge için bir şablon oluşturun. Özel Gösterge programının olay işleyicileri için seçim yaparken, aşağıdaki ekran görüntüsünde gösterilenleri seçin:
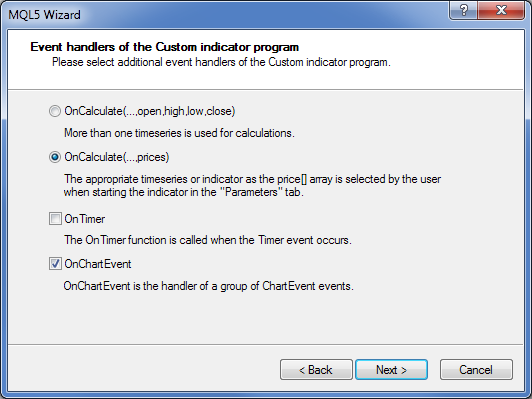
Şekil 3. Göstergenin olay işleyicileri
MetaEditor'da açıldığında şablon kaynağı nihai olarak şu şekilde görünecektir:
//+------------------------------------------------------------------+
//|                                                 ChartObjects.mq5 |
//|                        Copyright 2013, MetaQuotes Software Corp. |
//|                                              http://www.mql5.com |
//+------------------------------------------------------------------+
#property copyright "Copyright 2013, MetaQuotes Software Corp."
#property link      "http://www.mql5.com"
#property version   "1.00"
#property indicator_chart_window
//+------------------------------------------------------------------+
//| Custom indicator initialization function                         |
//+------------------------------------------------------------------+
int OnInit()
  {
//--- indicator buffers mapping

//---
   return(INIT_SUCCEEDED);
  }
//+------------------------------------------------------------------+
//| Custom indicator iteration function                              |
//+------------------------------------------------------------------+
int OnCalculate(const int rates_total,
                const int prev_calculated,
                const int begin,
                const double &price[])
  {
//---

//--- return value of prev_calculated for next call
   return(rates_total);
  }
//+------------------------------------------------------------------+
//| TradeTransaction function                                        |
//+------------------------------------------------------------------+
void OnTradeTransaction(const MqlTradeTransaction& trans,
                        const MqlTradeRequest& request,
                        const MqlTradeResult& result)
  {
//---

  }
//+------------------------------------------------------------------+
//| ChartEvent function                                              |
//+------------------------------------------------------------------+
void OnChartEvent(const int id,
                  const long &lparam,
                  const double &dparam,
                  const string &sparam)
  {
//---

  }
//+------------------------------------------------------------------+
Bu uygulamada temel olarak OnCalculate() fonksiyonuna ihtiyaç duymayacağız, ancak göstergeyi bu olmaksızın derlemek imkansızdır. Ayrıca, ana fonksiyonlardan birine ihtiyacımız olacak: OnDeinit(). Bu, programın grafikten silinmesini görüntüleyecektir. Şablonun ana işlemesinin ardından aşağıdaki kaynak kodumuz olacak:
//+------------------------------------------------------------------+
//|                                                 ChartObjects.mq5 |
//|                        Copyright 2013, MetaQuotes Software Corp. |
//|                                              http://www.mql5.com |
//+------------------------------------------------------------------+
#property copyright "Copyright 2013, MetaQuotes Software Corp."
#property link      "http://www.mql5.com"
#property version   "1.00"
//---
#property indicator_chart_window // Indicator is in the main window
#property indicator_plots 0      // Zero plotting series
//+------------------------------------------------------------------+
//| Custom indicator initialization function                         |
//+------------------------------------------------------------------+
int OnInit()
  {
//--- Set the short name for the indicator
   IndicatorSetString(INDICATOR_SHORTNAME,"TimeFramesPanel");
//--- Initialization completed successfully
   return(INIT_SUCCEEDED);
  }
//+------------------------------------------------------------------+
//| Indicator deinitialization                                       |
//+------------------------------------------------------------------+
void OnDeinit(const int reason)
  {
//--- If the indicator has been deleted from the chart
   if(reason==REASON_REMOVE)
     {
     }
  }
//+------------------------------------------------------------------+
//| Custom indicator iteration function                              |
//+------------------------------------------------------------------+
int OnCalculate(const int rates_total,
                const int prev_calculated,
                const int begin,
                const double &price[])
  {
//---

//--- return value of prev_calculated for next call
   return(rates_total);
  }
//+------------------------------------------------------------------+
//| ChartEvent function                                              |
//+------------------------------------------------------------------+
void OnChartEvent(const int id,
                  const long &lparam,
                  const double &dparam,
                  const string &sparam)
  {
//---

  }
//+------------------------------------------------------------------+
Şimdi, grafik nesneleri için depo (alt pencere) olarak kullanılacak bir gösterge oluşturmamız gerekiyor. Bu temel olarak bir sahte gösterge olacak. Buna SubWindow diyelim. Kodu aşağıda verilmektedir:
//+------------------------------------------------------------------+
//|                                                    SubWindow.mq5 |
//|                        Copyright 2013, MetaQuotes Software Corp. |
//|                                              http://www.mql5.com |
//+------------------------------------------------------------------+
#property copyright "Copyright 2013, MetaQuotes Software Corp."
#property link      "http://www.mql5.com"
#property version   "1.00"
//---
#property indicator_chart_window // Indicator is in the subwindow
#property indicator_plots 0      // Zero plotting series
//+------------------------------------------------------------------+
//| Custom indicator initialization function                         |
//+------------------------------------------------------------------+
int OnInit()
  {
//--- Set the short name for the indicator
   IndicatorSetString(INDICATOR_SHORTNAME,"SubWindow");
//--- Initialization completed successfully
   return(INIT_SUCCEEDED);
  }
//+------------------------------------------------------------------+
//| Custom indicator iteration function                              |
//+------------------------------------------------------------------+
int OnCalculate(const int rates_total,
                const int prev_calculated,
                const int begin,
                const double &price[])
  {
//---

//--- return value of prev_calculated for next call
   return(rates_total);
  }
//+------------------------------------------------------------------+
SubWindow.ex5 göstergesi, derleme sonrası ChartObjects.ex5 altında bir kaynak olarak saklanacaktır. Dolayısıyla, program geliştirici son kullanıcıya nihai olarak iki yerine yalnızca bir dosya sağlayabilecektir.
"MQL5 Tarif Defteri: MetaTrader 5 Alım Satım Olayları için Sesli Bildirimler" başlıklı önceki makalede halihazırda açıklandığı gibi kaynak dosyaları, #resource direktifini kullanarak programa dahil edilebilir. ChartObjects programımızın başında, aşağıdaki kod dizesini eklememiz gerekiyor:
//--- Include indicator resource
#resource "\\Indicators\\SubWindow.ex5"
Daha sonra, #define direktifini kullanarak, kontrollere atanacak dizilerin boyutlarını ayarlıyoruz:
//--- Number of time frame buttons
#define TIMEFRAME_BUTTONS 21
//--- Number of buttons for chart object properties
#define PROPERTY_BUTTONS 5
Ve her zamanki gibi, programın en başında global değişkenleri bildiriyoruz:
//--- Location of the SubWindow indicator in the resource
string subwindow_path         ="::Indicators\\SubWindow.ex5";
int    subwindow_number       =-1;               // Subwindow number
int    subwindow_handle       =INVALID_HANDLE;   // SubWindow indicator handle
string subwindow_shortname    ="SubWindow";      // Short name of the indicator
//---
int    chart_width            =0;                // Chart width
int    chart_height           =0;                // Chart height
int    chart_scale            =0;                // Chart scale
//---
color  cOffButtonFont         =clrWhite;         // Unclicked button text color
color  cOffButtonBackground   =clrDarkSlateGray; // Unclicked button background color
color  cOffButtonBorder       =clrLightGray;     // Unclicked button border color
//---
color  cOnButtonFont          =clrGold;          // Clicked button text color
color  cOnButtonBackground    =C'28,47,47';      // Clicked button background color
color  cOnButtonBorder        =clrLightGray;     // Clicked button border color
Bunu zaman aralığı düğmeleri için dizilerin bildirilmesi izler:
//--- Array of object names for time frame buttons
string timeframe_button_names[TIMEFRAME_BUTTONS]=
  {
   "button_M1","button_M2","button_M3","button_M4","button_M5","button_M6","button_M10",
   "button_M12","button_M15","button_M20","button_M30","button_H1","button_H2","button_H3",
   "button_H4","button_H6","button_H8","button_H12","button_D1","button_W1","button_MN"
  };
//--- Array of text displayed on time frame buttons
string timeframe_button_texts[TIMEFRAME_BUTTONS]=
  {
   "M1","M2","M3","M4","M5","M6","M10",
   "M12","M15","M20","M30","H1","H2","H3",
   "H4","H6","H8","H12","D1","W1","MN"
  };
//--- Array of time frame button states
bool timeframe_button_states[TIMEFRAME_BUTTONS]={false};
Grafik nesnesi özelliklerini kontrol etmek için düğme dizileri:
//--- Array of object names for buttons of chart properties
string property_button_names[PROPERTY_BUTTONS]=
  {
   "property_button_date","property_button_price",
   "property_button_ohlc","property_button_askbid",
   "property_button_trade_levels"
  };
//--- Array of text displayed on buttons of chart properties
string property_button_texts[PROPERTY_BUTTONS]=
  {
   "Date","Price","OHLC","Ask / Bid","Trade Levels"
  };
//--- Array of states for buttons of chart properties
bool property_button_states[PROPERTY_BUTTONS]={false};

//--- Array of sizes for buttons of chart properties
int property_button_widths[PROPERTY_BUTTONS]=
  {
   66,68,66,100,101
  };
Ve son olarak grafik nesnesi adlarının bir dizisini elde ediyoruz:
//--- Array of chart object names
string chart_object_names[TIMEFRAME_BUTTONS]=
  {
   "chart_object_m1","chart_object_m2","chart_object_m3","chart_object_m4","chart_object_m5","chart_object_m6","chart_object_m10",
   "chart_object_m12","chart_object_m15","chart_object_m20","chart_object_m30","chart_object_h1","chart_object_h2","chart_object_h3",
   "chart_object_h4","chart_object_h6","chart_object_h8","chart_object_h12","chart_object_d1","chart_object_w1","chart_object_mn"
  };
Grafik nesnelerinin etkileşimi ile ilgili olan fonksiyonlara geçmeden önce, ilk olarak grafikte bu nesneleri oluşturan fonksiyonları yazalım. Programımızda, grafik nesnelerinin iki türüne ihtiyacımız olacak: OBJ_BUTTON ve OBJ_CHART.
Düğmeler CreateButton() fonksiyonu ile oluşturulacaktır:
//+------------------------------------------------------------------+
//| Creating the Button object                                       |
//+------------------------------------------------------------------+
void CreateButton(long              chart_id,         // chart id
                  int               window_number,    // window number
                  string            name,             // object name
                  string            text,             // displayed name
                  ENUM_ANCHOR_POINT anchor,           // anchor point
                  ENUM_BASE_CORNER  corner,           // chart corner
                  string            font_name,        // font
                  int               font_size,        // font size
                  color             font_color,       // font color
                  color             background_color, // background color
                  color             border_color,     // border color
                  int               x_size,           // width
                  int               y_size,           // height
                  int               x_distance,       // X-coordinate
                  int               y_distance,       // Y-coordinate
                  long              z_order)          // Z-order
  {
//--- If the object has been created successfully
   if(ObjectCreate(chart_id,name,OBJ_BUTTON,window_number,0,0))
     {
      // set its properties
      ObjectSetString(chart_id,name,OBJPROP_TEXT,text);                  // setting name
      ObjectSetString(chart_id,name,OBJPROP_FONT,font_name);             // setting font
      ObjectSetInteger(chart_id,name,OBJPROP_COLOR,font_color);          // setting font color
      ObjectSetInteger(chart_id,name,OBJPROP_BGCOLOR,background_color);  // setting background color
      ObjectSetInteger(chart_id,name,OBJPROP_BORDER_COLOR,border_color); // setting border color
      ObjectSetInteger(chart_id,name,OBJPROP_ANCHOR,anchor);             // setting anchor point
      ObjectSetInteger(chart_id,name,OBJPROP_CORNER,corner);             // setting chart corner
      ObjectSetInteger(chart_id,name,OBJPROP_FONTSIZE,font_size);        // setting font size
      ObjectSetInteger(chart_id,name,OBJPROP_XSIZE,x_size);              // setting width
      ObjectSetInteger(chart_id,name,OBJPROP_YSIZE,y_size);              // setting height
      ObjectSetInteger(chart_id,name,OBJPROP_XDISTANCE,x_distance);      // setting X-coordinate
      ObjectSetInteger(chart_id,name,OBJPROP_YDISTANCE,y_distance);      // setting Y-coordinate
      ObjectSetInteger(chart_id,name,OBJPROP_SELECTABLE,false);          // object is not available for selection
      ObjectSetInteger(chart_id,name,OBJPROP_STATE,false);               // button state (clicked/unclicked)
      ObjectSetInteger(chart_id,name,OBJPROP_ZORDER,z_order);            // Z-order for getting the click event
      ObjectSetString(chart_id,name,OBJPROP_TOOLTIP,"\n");               // no tooltip
     }
  }
Buna uygun olarak, bir grafiğin bir alt pencerede oluşturulması CreateChartInSubwindow() fonksiyonu ile gerçekleştirilecektir:
//+------------------------------------------------------------------+
//| Creating a chart object in a subwindow                           |
//+------------------------------------------------------------------+
void CreateChartInSubwindow(int             window_number,  // subwindow number
                            int             x_distance,     // X-coordinate
                            int             y_distance,     // Y-coordinate
                            int             x_size,         // width
                            int             y_size,         // height
                            string          name,           // object name
                            string          symbol,         // symbol
                            ENUM_TIMEFRAMES timeframe,      // time frame
                            int             subchart_scale, // bar scale
                            bool            show_dates,     // show date scale
                            bool            show_prices,    // show price scale
                            bool            show_ohlc,      // show OHLC prices
                            bool            show_ask_bid,   // show ask/bid levels
                            bool            show_levels,    // show trade levels
                            string          tooltip)        // tooltip
  {
//--- If the object has been created successfully
   if(ObjectCreate(0,name,OBJ_CHART,window_number,0,0))
     {
      //--- Set the properties of the chart object
      ObjectSetInteger(0,name,OBJPROP_CORNER,CORNER_LEFT_UPPER);   // chart corner
      ObjectSetInteger(0,name,OBJPROP_XDISTANCE,x_distance);       // X-coordinate
      ObjectSetInteger(0,name,OBJPROP_YDISTANCE,y_distance);       // Y-coordinate
      ObjectSetInteger(0,name,OBJPROP_XSIZE,x_size);               // width
      ObjectSetInteger(0,name,OBJPROP_YSIZE,y_size);               // height
      ObjectSetInteger(0,name,OBJPROP_CHART_SCALE,subchart_scale); // bar scale
      ObjectSetInteger(0,name,OBJPROP_DATE_SCALE,show_dates);      // date scale
      ObjectSetInteger(0,name,OBJPROP_PRICE_SCALE,show_prices);    // price scale
      ObjectSetString(0,name,OBJPROP_SYMBOL,symbol);               // symbol
      ObjectSetInteger(0,name,OBJPROP_PERIOD,timeframe);           // time frame
      ObjectSetString(0,name,OBJPROP_TOOLTIP,tooltip);             // tooltip
      ObjectSetInteger(0,name,OBJPROP_BACK,false);                 // object in the foreground
      ObjectSetInteger(0,name,OBJPROP_SELECTABLE,false);           // object is not available for selection
      ObjectSetInteger(0,name,OBJPROP_COLOR,clrWhite);             // white color
      //--- Get the chart object identifier
      long subchart_id=ObjectGetInteger(0,name,OBJPROP_CHART_ID);
      //--- Set the special properties of the chart object
      ChartSetInteger(subchart_id,CHART_SHOW_OHLC,show_ohlc);           // OHLC
      ChartSetInteger(subchart_id,CHART_SHOW_TRADE_LEVELS,show_levels); // trade levels
      ChartSetInteger(subchart_id,CHART_SHOW_BID_LINE,show_ask_bid);    // bid level
      ChartSetInteger(subchart_id,CHART_SHOW_ASK_LINE,show_ask_bid);    // ask level
      ChartSetInteger(subchart_id,CHART_COLOR_LAST,clrLimeGreen);       // color of the level of the last executed deal
      ChartSetInteger(subchart_id,CHART_COLOR_STOP_LEVEL,clrRed);       // color of Stop order levels
      //--- Refresh the chart object
      ChartRedraw(subchart_id);
     }
  }
Yukarıdaki kodda, ilk olarak bir grafik nesnesi için standart grafik özelliklerini ayarlıyoruz. Grafik nesnesi tanımlayıcıyı elde ettikten sonra özel özellikler ayarlanır. Aynı zamanda grafik nesnesini ChartRedraw() fonksiyonunu kullanarak yenilemek önemlidir, burada grafik nesne tanımlayıcı buna aktarılır.
Kontrollerin ayarlarını iki fonksiyona bölelim: AddTimeframeButtons() ve AddPropertyButtons():
//+------------------------------------------------------------------+
//| Adding time frame buttons                                        |
//+------------------------------------------------------------------+
void AddTimeframeButtons()
  {
   int x_dist =1;   // Indent from the left side of the chart
   int y_dist =125; // Indent from the bottom of the chart
   int x_size =28;  // Button width
   int y_size =20;  // Button height
//---
   for(int i=0; i<TIMEFRAME_BUTTONS; i++)
     {
      //--- If 7 buttons have already been added to the same row, set the coordinates for the next row
      if(i%7==0)
        {
         x_dist=1;
         y_dist-=21;
        }
      //--- Add a time frame button
      CreateButton(0,0,timeframe_button_names[i],timeframe_button_texts[i],
                   ANCHOR_LEFT_LOWER,CORNER_LEFT_LOWER,"Arial",8,
                   cOffButtonFont,cOffButtonBackground,cOffButtonBorder,
                   x_size,y_size,x_dist,y_dist,3);
      //--- Set the X-coordinate for the next button
      x_dist+=x_size+1;
     }
  }
//+------------------------------------------------------------------+
//| Adding buttons of chart properties                               |
//+------------------------------------------------------------------+
void AddPropertyButtons()
  {
   int x_dist =1;  // Indent from the left side of the chart
   int y_dist =41; // Indent from the bottom of the chart
   int x_size =66; // Button width
   int y_size =20; // Button height
//---
   for(int i=0; i<PROPERTY_BUTTONS; i++)
     {
      //--- If the first three buttons have already been added, set the coordinates for the next row
      if(i==3)
        {
         x_dist=1;
         y_dist-=21;
        }
      //--- Add a button
      CreateButton(0,0,property_button_names[i],property_button_texts[i],
                   ANCHOR_LEFT_LOWER,CORNER_LEFT_LOWER,"Arial",8,
                   cOffButtonFont,cOffButtonBackground,cOffButtonBorder,
                   property_button_widths[i],y_size,x_dist,y_dist,3);
      //--- Set the X-coordinate for the next button
      x_dist+=property_button_widths[i]+1;
     }
  }
Göstergeyi grafikten silerken, aynı zamanda program tarafından oluşturulan nesneleri de silmeliyiz. Bunun için, sadece aşağıdaki yardımcı fonksiyonlara ihtiyacımız var:
//+------------------------------------------------------------------+
//| Deleting the panel with time frame buttons                       |
//+------------------------------------------------------------------+
void DeleteTimeframeButtons()
  {
   for(int i=0; i<TIMEFRAME_BUTTONS; i++)
      DeleteObjectByName(timeframe_button_names[i]);
  }
//+------------------------------------------------------------------+
//| Deleting the panel with buttons of chart properties              |
//+------------------------------------------------------------------+
void DeletePropertyButtons()
  {
   for(int i=0; i<PROPERTY_BUTTONS; i++)
      DeleteObjectByName(property_button_names[i]);
  }
//+------------------------------------------------------------------+
//| Deleting objects by name                                         |
//+------------------------------------------------------------------+
void DeleteObjectByName(string object_name)
  {
//--- If such object exists
   if(ObjectFind(ChartID(),object_name)>=0)
     {
      //--- Delete it or print the relevant error message
      if(!ObjectDelete(ChartID(),object_name))
         Print("Error ("+IntegerToString(GetLastError())+") when deleting the object!");
     }
  }
Şimdi, gösterge yüklenirken panelin grafik üzerinde ayarlandığından ve gösterge grafikten silinirken tüm panel nesnelerinin silindiğinden emin olmak için, OnInit() ve OnDeinit() işleyici fonksiyonlarına aşağıdaki kod dizelerini eklememiz gerekiyor:
//+------------------------------------------------------------------+
//| Custom indicator initialization function                         |
//+------------------------------------------------------------------+
int OnInit()
  {
//--- Add the panel with time frame buttons to the chart
   AddTimeframeButtons();
//--- Add the panel with buttons of chart properties to the chart
   AddPropertyButtons();
//--- Redraw the chart
   ChartRedraw();
//--- Initialization completed successfully
   return(INIT_SUCCEEDED);
  }
//+------------------------------------------------------------------+
//| Indicator deinitialization                                       |
//+------------------------------------------------------------------+
void OnDeinit(const int reason)
  {
//--- If the indicator has been deleted from the chart
   if(reason==REASON_REMOVE)
     {
      //--- Delete buttons
      DeleteTimeframeButtons();
      DeletePropertyButtons();
      //--- Redraw the chart
      ChartRedraw();
     }
  }
Şimdi göstergeyi derlediysek ve bunu grafiğe eklediysek, paneli aşağıdaki ekran görüntüsünde gösterildiği şekilde görürüz:
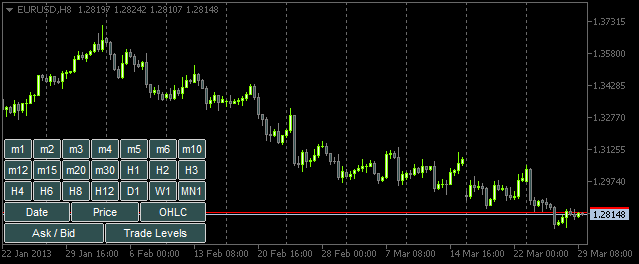
Şekil 4. Düğmelerin olduğu panel
Artık kullanıcı ve panel arasındaki etkileşme yönelik fonksiyonları oluşturmaya başlamak için her şey hazır. Bunların büyük ölçüde tamamı, ana OnChartEvent() fonksiyonundan çağrılacaktır. Bu makalede, bu fonksiyonda işlenecek iki olayı ele alacağız:
- CHARTEVENT_OBJECT_CLICK - bir grafik nesnesi üzerine tıklama olayı.
- CHARTEVENT_CHART_CHANGE - grafiğin yeniden boyutlandırılması ve grafik özelliklerinin özellikler iletişim penceresi kullanılarak değiştirilmesi olayı.
CHARTEVENT_OBJECT_CLICK olayı ile başlayalım. Yazmak üzere olduğumuz ChartEventObjectClick() fonksiyonu, OnChartEvent() fonksiyonundan tüm argümanları alacaktır (diğer olaylar için benzer fonksiyonlar oluşturacağız):
//+------------------------------------------------------------------+
//| Event of the click on a graphical object                         |
//+------------------------------------------------------------------+
bool ChartEventObjectClick(int id,
                           long lparam,
                           double dparam,
                           string sparam)
  {
//--- Click on a graphical object
   if(id==CHARTEVENT_OBJECT_CLICK)
     {
      //--- If a time frame button has been clicked, set/delete 'SubWindow' and a chart object
      if(ToggleSubwindowAndChartObject(sparam))
         return(true);
      //--- If a button of chart properties has been clicked, set/delete the property in chart objects
      if(ToggleChartObjectProperty(sparam))
         return(true);
     }
//---
   return(false);
  }
ChartEventObjectClick() fonksiyon kodu basittir. Panel düğmesine tıklama olayı tanımlayıcı kullanılarak belirlenir. Ardından, uygulama mantığı iki yöne bölünür: zaman aralığı düğmelerine tıklama olayını veya grafik özellikleri düğmelerine tıklama olayını ele alma. Sol tıklanan nesnenin adını içeren sparam dize parametresi ilgili ToggleSubwindowAndChartObject() ve ToggleChartObjectProperty() fonksiyonlarına aktarılır.
Bu fonksiyonların kaynak koduna bir göz atalım. ToggleSubwindowAndChartObject() ile başlayacağız:
//+------------------------------------------------------------------+
//| Setting/deleting SubWindow and a chart object                    |
//+------------------------------------------------------------------+
bool ToggleSubwindowAndChartObject(string clicked_object_name)
  {
//--- Make sure that the click was on the time frame button object
   if(CheckClickOnTimeframeButton(clicked_object_name))
     {
      //--- Check if the SubWindow exists
      subwindow_number=ChartWindowFind(0,subwindow_shortname);
      //--- If the SubWindow does not exist, set it
      if(subwindow_number<0)
        {
         //--- If the SubWindow is set
         if(AddSubwindow())
           {
            //--- Add chart objects to it
            AddChartObjectsToSubwindow(clicked_object_name);
            return(true);
           }
        }
      //--- If the SubWindow exists
      if(subwindow_number>0)
        {
         //--- Add chart objects to it
         AddChartObjectsToSubwindow(clicked_object_name);
         return(true);
        }
     }
//---
   return(false);
  }
Yukarıdaki kodda verilen yorumları kullanarak uygulama mantığını kolayca anlayabilmeniz gerekir. Vurgulanan dizeler, kodu aşağıda bulunabilen bazı özel fonksiyonları içerir.
CheckClickOnTimeframeButton() fonksiyonu, tıklanan düğme zaman aralıkları paneli ile ilişkili ise true döndürür.
//+------------------------------------------------------------------+
//| Checking if a time frame button has been clicked                 |
//+------------------------------------------------------------------+
bool CheckClickOnTimeframeButton(string clicked_object_name)
  {
//--- Iterate over all time frame buttons and check the names
   for(int i=0; i<TIMEFRAME_BUTTONS; i++)
     {
      //--- Report the match
      if(clicked_object_name==timeframe_button_names[i])
         return(true);
     }
//---
   return(false);
  }
Bir zaman aralığı düğmesine tıklama onaylandıysa, SubWindow'un şu anda ana grafiğe eklenip eklenmediğini kontrol ederiz. Onaylanmadıysa bu, AddSubwindow() fonksiyonu kullanılarak ayarlanır:
//+------------------------------------------------------------------+
//| Adding a subwindow for chart objects                             |
//+------------------------------------------------------------------+
bool AddSubwindow()
  {
//--- Get the "SubWindow" indicator handle
   subwindow_handle=iCustom(_Symbol,_Period,subwindow_path);
//--- If the handle has been obtained
   if(subwindow_handle!=INVALID_HANDLE)
     {
      //--- Determine the number of windows in the chart for the subwindow number
      subwindow_number=(int)ChartGetInteger(0,CHART_WINDOWS_TOTAL);
      //--- Add the SubWindow to the chart
      if(!ChartIndicatorAdd(0,subwindow_number,subwindow_handle))
         Print("Failed to add the SUBWINDOW indicator ! ");
      //--- The subwindow exists
      else
         return(true);
     }
//--- There is no subwindow
   return(false);
  }
Ardından AddChartObjectsToSubwindow() fonksiyonunu kullanarak oluşturulan alt pencereye grafik nesnelerini ekleriz:
//+------------------------------------------------------------------+
//| Adding chart objects to the subwindow                            |
//+------------------------------------------------------------------+
void AddChartObjectsToSubwindow(string clicked_object_name)
  {
   ENUM_TIMEFRAMES tf                 =WRONG_VALUE; // Time frame
   string          object_name        ="";          // Object name
   string          object_text        ="";          // Object text
   int             x_distance         =0;           // X-coordinate
   int             total_charts       =0;           // Total chart objects
   int             chart_object_width =0;           // Chart object width
//--- Get the bar scale and SubWindow height/width
   chart_scale=(int)ChartGetInteger(0,CHART_SCALE);
   chart_width=(int)ChartGetInteger(0,CHART_WIDTH_IN_PIXELS,subwindow_number);
   chart_height=(int)ChartGetInteger(0,CHART_HEIGHT_IN_PIXELS,subwindow_number);
//--- Get the number of chart objects in the SUBWINDOW
   total_charts=ObjectsTotal(0,subwindow_number,OBJ_CHART);
//--- If there are no chart objects
   if(total_charts==0)
     {
      //--- Check if a time frame button has been clicked
      if(CheckClickOnTimeframeButton(clicked_object_name))
        {
         //--- Initialize the array of time frame buttons
         InitializeTimeframeButtonStates();
         //--- Get the time frame button text for the chart object tooltip
         object_text=ObjectGetString(0,clicked_object_name,OBJPROP_TEXT);
         //--- Get the time frame for the chart object
         tf=StringToTimeframe(object_text);
         //--- Set the chart object
         CreateChartInSubwindow(subwindow_number,0,0,chart_width,chart_height,
                                "chart_object_"+object_text,_Symbol,tf,chart_scale,
                                property_button_states[0],property_button_states[1],
                                property_button_states[2],property_button_states[3],
                                property_button_states[4],object_text);
         //--- Refresh the chart and exit
         ChartRedraw();
         return;
        }
     }
//--- If chart objects already exist in the SubWindow
   if(total_charts>0)
     {
      //--- Get the number of clicked time frame buttons and initialize the array of states
      int pressed_buttons_count=InitializeTimeframeButtonStates();
      //--- If there are no clicked buttons, delete the SubWindow
      if(pressed_buttons_count==0)
         DeleteSubwindow();
      //--- If the clicked buttons exist
      else
        {
         //--- Delete all chart objects from the subwindow
         ObjectsDeleteAll(0,subwindow_number,OBJ_CHART);
         //--- Get the width for chart objects
         chart_object_width=chart_width/pressed_buttons_count;
         //--- Iterate over all buttons in a loop
         for(int i=0; i<TIMEFRAME_BUTTONS; i++)
           {
            //--- If the button is clicked
            if(timeframe_button_states[i])
              {
               //--- Get the time frame button text for the chart object tooltip
               object_text=ObjectGetString(0,timeframe_button_names[i],OBJPROP_TEXT);
               //--- Get the time frame for the chart object
               tf=StringToTimeframe(object_text);
               //--- Set the chart object
               CreateChartInSubwindow(subwindow_number,x_distance,0,chart_object_width,chart_height,
                                      chart_object_names[i],_Symbol,tf,chart_scale,
                                      property_button_states[0],property_button_states[1],
                                      property_button_states[2],property_button_states[3],
                                      property_button_states[4],object_text);
               //--- Determine the X-coordinate for the next chart object
               x_distance+=chart_object_width;
              }
           }
        }
     }
//--- Refresh the chart
   ChartRedraw();
  }
Yukarıdaki kodda verilen ayrıntılı yorumlar, fonksiyon çalışmasını anlamanıza yardımcı olacaktır. Daha önce karşılaşmadığımız özel fonksiyonlar vurgulanmıştır.
InitializeTimeframeButtonStates() fonksiyonu tıklanan zaman aralığı düğmelerinin sayısını döndürür ve karşılık gelen durumların dizisini başlatır. Bu aynı zamanda düğme durumuna göre renkleri ayarlar:
//+------------------------------------------------------------------+
//| Initializing array of time frame button states and               |
//| returning the number of clicked buttons                          |
//+------------------------------------------------------------------+
int InitializeTimeframeButtonStates()
  {
//--- Counter of the clicked time frame buttons
   int pressed_buttons_count=0;
//--- Iterate over all time frame buttons and count the clicked ones
   for(int i=0; i<TIMEFRAME_BUTTONS; i++)
     {
      //--- If the button is clicked
      if(ObjectGetInteger(0,timeframe_button_names[i],OBJPROP_STATE))
        {
         //--- Indicate it in the current index of the array
         timeframe_button_states[i]=true;
         //--- Set clicked button colors
         ObjectSetInteger(0,timeframe_button_names[i],OBJPROP_COLOR,cOnButtonFont);
         ObjectSetInteger(0,timeframe_button_names[i],OBJPROP_BGCOLOR,cOnButtonBackground);
         //--- Increase the counter by one
         pressed_buttons_count++;
        }
      else
        {
         //--- Set unclicked button colors
         ObjectSetInteger(0,timeframe_button_names[i],OBJPROP_COLOR,cOffButtonFont);
         ObjectSetInteger(0,timeframe_button_names[i],OBJPROP_BGCOLOR,cOffButtonBackground);
         //--- Indicate that the button is unclicked
         timeframe_button_states[i]=false;
        }
     }
//--- Return the number of clicked buttons
   return(pressed_buttons_count);
  }
DeleteSubwindow() fonksiyonu oldukça basittir: grafikler için alt pencere varlığını kontrol eder ve bunu siler:
//+------------------------------------------------------------------+
//| Deleting subwindow for chart objects                             |
//+------------------------------------------------------------------+
void DeleteSubwindow()
  {
//--- If the SubWindow exists
   if((subwindow_number=ChartWindowFind(0,subwindow_shortname))>0)
     {
      //--- Delete it
      if(!ChartIndicatorDelete(0,subwindow_number,subwindow_shortname))
         Print("Failed to delete the "+subwindow_shortname+" indicator!");
     }
  }
Şimdi grafik nesnelerinin özelliklerine bakmalıyız. Diğer bir deyişle, ChartEventObjectClick() fonksiyonuna geri döneriz ve ToggleChartObjectProperty() fonksiyonunu değerlendiririz. Tıklanan nesnenin adı da buna aktarılır.
//+------------------------------------------------------------------+
//| Setting/deleting chart object property                           |
//| depending on the clicked button state                            |
//+------------------------------------------------------------------+
bool ToggleChartObjectProperty(string clicked_object_name)
  {

//--- If the "Date" button is clicked
   if(clicked_object_name=="property_button_date")
     {
      //--- If the button is clicked
      if(SetButtonColor(clicked_object_name))
         ShowDate(true);
      //--- If the button is unclicked
      else
         ShowDate(false);
      //--- Refresh the chart and exit
      ChartRedraw();
      return(true);
     }
//--- If the "Price" button is clicked
   if(clicked_object_name=="property_button_price")
     {
      //--- If the button is clicked
      if(SetButtonColor(clicked_object_name))
         ShowPrice(true);
      //--- If the button is unclicked
      else
         ShowPrice(false);
      //--- Refresh the chart and exit
      ChartRedraw();
      return(true);
     }
//--- If the "OHLC" button is clicked
   if(clicked_object_name=="property_button_ohlc")
     {
      //--- If the button is clicked
      if(SetButtonColor(clicked_object_name))
         ShowOHLC(true);
      //--- If the button is unclicked
      else
         ShowOHLC(false);
      //--- Refresh the chart and exit
      ChartRedraw();
      return(true);
     }
//--- If the "Ask/Bid" button is clicked
   if(clicked_object_name=="property_button_askbid")
     {
      //--- If the button is clicked
      if(SetButtonColor(clicked_object_name))
         ShowAskBid(true);
      //--- If the button is unclicked
      else
         ShowAskBid(false);
      //--- Refresh the chart and exit
      ChartRedraw();
      return(true);
     }
//--- If the "Trade Levels" button is clicked
   if(clicked_object_name=="property_button_trade_levels")
     {
      //--- If the button is clicked
      if(SetButtonColor(clicked_object_name))
         ShowTradeLevels(true);
      //--- If the button is unclicked
      else
         ShowTradeLevels(false);
      //--- Refresh the chart and exit
      ChartRedraw();
      return(true);
     }
//--- No matches
   return(false);
  }
Yukarıdaki kodda, tıklanan nesnenin adı, grafik özellikleri ile ilgili nesnenin adına göre sıralıdır. Bir eşleşme varsa, SetButtonColor() fonksiyonunda düğmeye tıklanıp tıklanmadığını kontrol ederiz ve ilgili düğme renklerini ayarlarız.
//+------------------------------------------------------------------+
//| Setting color of button elements depending on the state          |
//+------------------------------------------------------------------+
bool SetButtonColor(string clicked_object_name)
  {
//--- If the button is clicked
   if(ObjectGetInteger(0,clicked_object_name,OBJPROP_STATE))
     {
      //--- Set clicked button colors
      ObjectSetInteger(0,clicked_object_name,OBJPROP_COLOR,cOnButtonFont);
      ObjectSetInteger(0,clicked_object_name,OBJPROP_BGCOLOR,cOnButtonBackground);
      return(true);
     }
//--- If the button is unclicked
   if(!ObjectGetInteger(0,clicked_object_name,OBJPROP_STATE))
     {
      //--- Set unclicked button colors
      ObjectSetInteger(0,clicked_object_name,OBJPROP_COLOR,cOffButtonFont);
      ObjectSetInteger(0,clicked_object_name,OBJPROP_BGCOLOR,cOffButtonBackground);
      return(false);
     }
//---
   return(false);
  }
SetButtonColor() fonksiyonu düğme durumunu döndürür. Bu özniteliğe göre program, ilgili fonksiyonu, SubWindow içindeki tüm grafik nesnelerinde belirli bir özelliğin etkinleştirilmesi veya devre dışı bırakılması gerektiğine dair bilgilendirir. Bu, her bir özellik için yazılan ayrı bir fonksiyondur. İlgili fonksiyon kodları aşağıda verilmektedir:
//+------------------------------------------------------------------+
//| Enabling/disabling dates for all chart objects                   |
//+------------------------------------------------------------------+
void ShowDate(bool state)
  {
   int    total_charts =0;  // Number of objects
   string chart_name  =""; // Chart object name
//--- Check if the SubWindow exists
//    If it exists, then
   if((subwindow_number=ChartWindowFind(0,subwindow_shortname))>0)
     {
      //--- Get the number of chart objects
      total_charts=ObjectsTotal(0,subwindow_number,OBJ_CHART);
      //--- Iterate over all chart objects in a loop
      for(int i=0; i<total_charts; i++)
        {
         //--- Get the chart object name
         chart_name=ObjectName(0,i,subwindow_number,OBJ_CHART);
         //--- Set the property
         ObjectSetInteger(0,chart_name,OBJPROP_DATE_SCALE,state);
        }
      //--- Set the button state to the relevant index
      if(state)
         property_button_states[0]=true;
      else
         property_button_states[0]=false;
      //--- Refresh the chart
      ChartRedraw();
     }
  }
//+------------------------------------------------------------------+
//| Enabling/disabling prices for all chart objects                  |
//+------------------------------------------------------------------+
void ShowPrice(bool state)
  {
   int    total_charts =0;  // Number of objects
   string chart_name  =""; // Chart object name
//--- Check if the SubWindow exists
//    If it exists, then
   if((subwindow_number=ChartWindowFind(0,subwindow_shortname))>0)
     {
      //--- Get the number of chart objects
      total_charts=ObjectsTotal(0,subwindow_number,OBJ_CHART);
      //--- Iterate over all chart objects in a loop
      for(int i=0; i<total_charts; i++)
        {
         //--- Get the chart object name
         chart_name=ObjectName(0,i,subwindow_number,OBJ_CHART);
         //--- Set the property
         ObjectSetInteger(0,chart_name,OBJPROP_PRICE_SCALE,state);
        }
      //--- Set the button state to the relevant index
      if(state)
         property_button_states[1]=true;
      else
         property_button_states[1]=false;
      //--- Refresh the chart
      ChartRedraw();
     }
  }
//+------------------------------------------------------------------+
//| Enabling/disabling OHLC for all chart objects                    |
//+------------------------------------------------------------------+
void ShowOHLC(bool state)
  {
   int    total_charts =0;  // Number of objects
   long   subchart_id =0;  // Chart object identifier
   string chart_name  =""; // Chart object name
//--- Check if the SubWindow exists
//    If it exists, then
   if((subwindow_number=ChartWindowFind(0,subwindow_shortname))>0)
     {
      //--- Get the number of chart objects
      total_charts=ObjectsTotal(0,subwindow_number,OBJ_CHART);
      //--- Iterate over all chart objects in a loop
      for(int i=0; i<total_charts; i++)
        {
         //--- Get the chart object name
         chart_name=ObjectName(0,i,subwindow_number,OBJ_CHART);
         //--- Get the chart object identifier
         subchart_id=ObjectGetInteger(0,chart_name,OBJPROP_CHART_ID);
         //--- Set the property
         ChartSetInteger(subchart_id,CHART_SHOW_OHLC,state);
         //--- Refresh the chart object
         ChartRedraw(subchart_id);
        }
      //--- Set the button state to the relevant index
      if(state)
         property_button_states[2]=true;
      else
         property_button_states[2]=false;
      //--- Refresh the chart
      ChartRedraw();
     }
  }
//+------------------------------------------------------------------+
//| Enabling/disabling Ask/Bid levels for all chart objects          |
//+------------------------------------------------------------------+
void ShowAskBid(bool state)
  {
   int    total_charts =0;  // Number of objects
   long   subchart_id =0;  // Chart object identifier
   string chart_name  =""; // Chart object name
//--- Check if the SubWindow exists
//    If it exists, then
   if((subwindow_number=ChartWindowFind(0,subwindow_shortname))>0)
     {
      //--- Get the number of chart objects
      total_charts=ObjectsTotal(0,subwindow_number,OBJ_CHART);
      //--- Iterate over all chart objects in a loop
      for(int i=0; i<total_charts; i++)
        {
         //--- Get the chart object name
         chart_name=ObjectName(0,i,subwindow_number,OBJ_CHART);
         //--- Get the chart object identifier
         subchart_id=ObjectGetInteger(0,chart_name,OBJPROP_CHART_ID);
         //--- Set the properties
         ChartSetInteger(subchart_id,CHART_SHOW_ASK_LINE,state);
         ChartSetInteger(subchart_id,CHART_SHOW_BID_LINE,state);
         //--- Refresh the chart object
         ChartRedraw(subchart_id);
        }
      //--- Set the button state to the relevant index
      if(state)
         property_button_states[3]=true;
      else
         property_button_states[3]=false;
      //--- Refresh the chart
      ChartRedraw();
     }
  }
//+------------------------------------------------------------------+
//| Enabling/disabling trade levels for all chart objects            |
//+------------------------------------------------------------------+
void ShowTradeLevels(bool state)
  {
   int    total_charts =0;  // Number of objects
   long   subchart_id =0;  // Chart object identifier
   string chart_name  =""; // Chart object name
//--- Check if the SubWindow exists
//    If it exists, then
   if((subwindow_number=ChartWindowFind(0,subwindow_shortname))>0)
     {
      //--- Get the number of chart objects
      total_charts=ObjectsTotal(0,subwindow_number,OBJ_CHART);
      //--- Iterate over all chart objects in a loop
      for(int i=0; i<total_charts; i++)
        {
         //--- Get the chart object name
         chart_name=ObjectName(0,i,subwindow_number,OBJ_CHART);
         //--- Get the chart object identifier
         subchart_id=ObjectGetInteger(0,chart_name,OBJPROP_CHART_ID);
         //--- Set the property
         ChartSetInteger(subchart_id,CHART_SHOW_TRADE_LEVELS,state);
         //--- Refresh the chart object
         ChartRedraw(subchart_id);
        }
      //--- Set the button state to the relevant index
      if(state)
         property_button_states[4]=true;
      else
         property_button_states[4]=false;
      //--- Refresh the chart
      ChartRedraw();
     }
  }
Artık, fonksiyonların tamamı panel ile etkileşim için hazırdır. Sadece ana OnChartEvent() fonksiyonuna kodun bir dizesini eklememiz gerekiyor:
//+------------------------------------------------------------------+
//| ChartEvent function                                              |
//+------------------------------------------------------------------+
void OnChartEvent(const int id,
                  const long &lparam,
                  const double &dparam,
                  const string &sparam)
  {
//--- The CHARTEVENT_OBJECT_CLICK event
   if(ChartEventObjectClick(id,lparam,dparam,sparam))
      return;

  }
Gösterge derlenirse ve grafikte şimdi çalıştırılırsa, ilgili zaman aralığı düğmelerine tıklandığında grafik nesneleri alt pencereye eklenecektir. Ayrıca, özelliklerin düğmelerinden herhangi birine tıklarsak, grafik nesnelerindeki ilgili değişiklikleri görebiliriz:
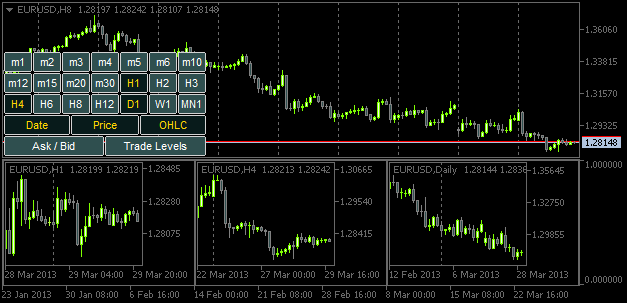
Şekil 5. Belirtilen özelliklere sahip grafik nesnelerini ekleme
Ancak, grafik penceresi veya alt pencere yeniden boyutlandırılırsa, grafik nesnesinin boyutları buna göre ayarlanmayacaktır. Şimdi sıra CHARTEVENT_CHART_CHANGE olayında.
Tıpkı "grafik nesnesine tıklama" olayını takip ederken ChartEventObjectClick() fonksiyonunu oluşturduğumuz gibi, şimdi ChartEventChartChange() fonksiyonunu yazacağız:
//+------------------------------------------------------------------+
//| Event of modifying the chart properties                          |
//+------------------------------------------------------------------+
bool ChartEventChartChange(int id,
                           long lparam,
                           double dparam,
                           string sparam)
  {
//--- Chart has been resized or the chart properties have been modified
   if(id==CHARTEVENT_CHART_CHANGE)
     {
      //--- If the SubWindow has been deleted (or does not exist), while the time frame buttons are clicked,
      //    release all the buttons (reset)
      if(OnSubwindowDelete())
         return(true);
      //--- Save the height and width values of the main chart and SubWindow, if it exists
      GetSubwindowWidthAndHeight();
      //--- Adjust the sizes of chart objects
      AdjustChartObjectsSizes();
      //--- Refresh the chart and exit
      ChartRedraw();
      return(true);
     }
//---
   return(false);
  }
Program ana grafik boyutunun veya özelliklerinin değiştirildiğini belirlemişse, SubWindow öğesinin silinip silinmediğini kontrol etmek için ilk olarak OnSubwindowDelete() fonksiyonunu kullanırız. Alt pencere bulunamazsa, panel sıfırlanır.
//+------------------------------------------------------------------+
//| Response to Subwindow deletion                                   |
//+------------------------------------------------------------------+
bool OnSubwindowDelete()
  {
//--- if there is no SubWindow
   if(ChartWindowFind(0,subwindow_shortname)<1)
     {
      //--- Reset the panel with time frame buttons
      AddTimeframeButtons();
      ChartRedraw();
      return(true);
     }
//--- SubWindow exists
   return(false);
  }
Alt pencere olması gereken yerdeyse, alt pencere genişlik ve yükseklik değerleri GetSubwindowWidthAndHeight() fonksiyonundaki global değişkenlere atanır:
//+------------------------------------------------------------------+
//| Saving the SubWindow height and width values                     |
//+------------------------------------------------------------------+
void GetSubwindowWidthAndHeight()
  {
//--- Check if there is a subwindow named SubWindow
   if((subwindow_number=ChartWindowFind(0,subwindow_shortname))>0)
     {
      // Get the subwindow height and width
      chart_height=(int)ChartGetInteger(0,CHART_HEIGHT_IN_PIXELS,subwindow_number);
      chart_width=(int)ChartGetInteger(0,CHART_WIDTH_IN_PIXELS,subwindow_number);
     }
  }
Ve son olarak grafik nesnelerinin boyutları AdjustChartObjectsSizes() fonksiyonunda ayarlanır:
//+------------------------------------------------------------------+
//| Adjusting width of chart objects when modifying the window width |
//+------------------------------------------------------------------+
void AdjustChartObjectsSizes()
  {
   int             x_distance         =0;           // X-coordinate
   int             total_objects      =0;           // Number of chart objects
   int             chart_object_width =0;           // Chart object width
   string          object_name        ="";          // Object name
   ENUM_TIMEFRAMES TF                 =WRONG_VALUE; // Time frame
//--- Get the SubWindow number
   if((subwindow_number=ChartWindowFind(0,subwindow_shortname))>0)
     {
      //--- Get the total number of chart objects
      total_objects=ObjectsTotal(0,subwindow_number,OBJ_CHART);
      //--- If there are no objects, delete the subwindow and exit
      if(total_objects==0)
        {
         DeleteSubwindow();
         return;
        }
      //--- Get the width for chart objects
      chart_object_width=chart_width/total_objects;
      //--- Iterate over all chart objects in a loop
      for(int i=total_objects-1; i>=0; i--)
        {
         //--- Get the name
         object_name=ObjectName(0,i,subwindow_number,OBJ_CHART);
         //--- Set the chart object width and height
         ObjectSetInteger(0,object_name,OBJPROP_YSIZE,chart_height);
         ObjectSetInteger(0,object_name,OBJPROP_XSIZE,chart_object_width);
         //--- Set the chart object position
         ObjectSetInteger(0,object_name,OBJPROP_YDISTANCE,0);
         ObjectSetInteger(0,object_name,OBJPROP_XDISTANCE,x_distance);
         //--- Set the new X-coordinate for the next chart object
         x_distance+=chart_object_width;
        }
     }
  }
Ana grafiğin boyutunun ve özelliklerinin değiştirilmesini olayını takip etmek için, OnChartEvent() fonksiyonuna aşağıdaki dize eklenmelidir:
Göstergenin derlenmesinin ve bunun grafiğe eklenmesinin ardından, grafik nesnelerinin ana pencere her yeniden boyutlandırıldığında alt pencere boyutuna göre ayarlandığını göreceksiniz.
Sonuç
Makaleyi burada sonlandıralım. Ev ödevi olarak, ana grafikteki sembol değiştirildiğinde grafik nesnelerindeki sembollerin ayarlanması için bu özelliği uygulamaya çalışın. Ayrıca, düşükten yükseğe (soldan sağa) sıralı olarak ayarlanan grafik nesnelerinde zaman aralıkları bulunmasını da isteyebilirsiniz. Bu imkan, yukarıda açıklanan gösterge sürümünde uygulanmamıştır.
Hazır TF PANEL uygulamasının açıklamasında, bu özelliklerin uygulanmasını gösteren bir video bulabilirsiniz. Kaynak kodu dosyaları makaleye eklenmiştir ve buradan indirilebilir.
MetaQuotes Ltd tarafından Rusçadan çevrilmiştir.
Orijinal makale: https://www.mql5.com/ru/articles/749
Uyarı: Bu materyallerin tüm hakları MetaQuotes Ltd.'a aittir. Bu materyallerin tamamen veya kısmen kopyalanması veya yeniden yazdırılması yasaktır.
Bu makale sitenin bir kullanıcısı tarafından yazılmıştır ve kendi kişisel görüşlerini yansıtmaktadır. MetaQuotes Ltd, sunulan bilgilerin doğruluğundan veya açıklanan çözümlerin, stratejilerin veya tavsiyelerin kullanımından kaynaklanan herhangi bir sonuçtan sorumlu değildir.
- Ücretsiz alım-satım uygulamaları
- İşlem kopyalama için 8.000'den fazla sinyal
- Finansal piyasaları keşfetmek için ekonomik haberler
Gizlilik ve Veri Koruma Politikasını ve MQL5.com Kullanım Şartlarını kabul edersiniz
MQL5 Tarifler - Tek Pencerede Birden Fazla Zaman Dilimini İzleme makalesi yayınlandı:
Yazar: Anatoli Kazharski
Lütfen bana ikinci zaman dilimlerini, örneğin 10 saniye, 30 saniye gibi bir ekran eklemenin mümkün olup olmadığını söyleyebilir misiniz?
Çok kullanışlı bir gösterge.
Lütfen bana ikinci zaman dilimlerinin, örneğin 10 sn, 30 sn gibi bir ekranın eklenmesinin mümkün olup olmadığını söyleyebilir misiniz?
Merhaba Anatoli,
Böyle harika bir makale için teşekkürler! Ben sadece alt pencere göstergesini merak ediyordum. Ayrı bir pencere yerine grafik penceresinde olacak şekilde ayarladığınızı fark ettim... bu bir hata mı?