
MQL5 クックブック: MQL5でのマルチシンボルボラティリティインジケーターの開発

イントロダクション
この記事では、マルチシンボルボラティリティインジケーターを紹介します。マルチシンボルインジケーターの開発は、MQL5開発初心者にとっていくつか難しい点があります。マルチシンボルインジケーターの開発中に生じる主要な問題は、現在のシンボルに関連したその他のシンボルのデータの同期化、いくつかのインジケーターデータの欠如、特定のタイムフレーム間の初めの「本当の」バーの特定などに関連します。これらの問題は、この記事にて詳しく焦点が当てられます。
ハンドルに基づいたそれぞれのシンボルごとに計算されたAverage True Range (ATR) インジケーターの値を取得します。そのインジケーターの外部パラメーターにセットされる名前を持つ6つのシンボルがあります。入力された名前は正しいかチェックされます。そのパラメーターにて明記された特定のシンボルがリストにて使用できなければ、それに対して計算が行われません。すでにそこで使用できるという形でないかぎり、全てのシンボルは、Market Watchウィンドウに追加されます。
"MQL5 Cookbook: Indicator Subwindow Controls - Scrollbar" という以前の記事では、すでにテキストを貼り付けたり描画できるキャンバスについて紹介しました。今回は、キャンバスに描画しませんが、源氏あのプログラムの進行についてのメッセージを表示するために使用し、特定の時間に何が起こっているのかをユーザーに知らせることができます。
インジケーターの開発
プログラムの開発を始めましょう。MQL5 ウィザードを用いて、カスタムインジケーターテンプレートを作成してください。いくつかの修正の後、以下に示された通りのソースコードを取得できるはずです。
//+------------------------------------------------------------------+
//|                                               MultiSymbolATR.mq5 |
//|                        Copyright 2010, MetaQuotes Software Corp. |
//|                                              http://www.mql5.com |
//+------------------------------------------------------------------+
//--- Indicator properties
#property copyright "Copyright 2010, MetaQuotes Software Corp."
#property link      "http://www.mql5.com"
#property version   "1.00"
#property indicator_separate_window // Indicator is in a separate subwindow
#property indicator_minimum 0       // Minimum value of the indicator
#property indicator_buffers 6       // Number of buffers for indicator calculation
#property indicator_plots   6       // Number of plotting series
//+------------------------------------------------------------------+
//| Custom indicator initialization function                         |
//+------------------------------------------------------------------+
int OnInit()
  {
//--- Initialization completed successfully
   return(INIT_SUCCEEDED);
  }
//+------------------------------------------------------------------+
//| Deinitialization                                                 |
//+------------------------------------------------------------------+
void OnDeinit(const int reason)
  {
  }
//+------------------------------------------------------------------+
//| Custom indicator iteration function                              |
//+------------------------------------------------------------------+
int OnCalculate(const int      rates_total,     // Size of input time series
                const int      prev_calculated, // Bars processed at the previous call
                const datetime &time[],         // Opening time
                const double   &open[],         // Open prices
                const double   &high[],         // High prices
                const double   &low[],          // Low prices
                const double   &close[],        // Close prices
                const long     &tick_volume[],  // Tick volumes
                const long     &volume[],       // Real volumes
                const int      &spread[])       // Spread
  {
//--- Return the size of the data array of the current symbol
   return(rates_total);
  }
//+------------------------------------------------------------------+
//| Timer function                                                   |
//+------------------------------------------------------------------+
void OnTimer()
  {
  }
//+------------------------------------------------------------------+
アイディアを実装するために、このテンプレートに必要なものすべて記入していきます。タイマーの必要性は、この記事の最後に説明されます。最初に、特定のインジケーターの属性の直後に定数を追加します。
//--- Constants
#define RESET           0 // Returning the indicator recalculation command to the terminal
#define LEVELS_COUNT    6 // Number of levels
#define SYMBOLS_COUNT   6 // Number of symbols
LEVELS_COUNT定数は、「水平線」タイプ(OBJ_HLINE)のグラフィカルオブジェクトによって表現されるレベル数の値を所持します。これらのレベルの値は、インジケーターの外部パラメーターにて明記されます。
カスタムグラフィックスを扱うためのクラスを持つファイルをプロジェクトに追加しましょう:
//--- Include the class for working with the canvas
#include <Canvas\Canvas.mqh>
外部パラメーターにて、iATR 平均期間、ボラティリティが表示されるシンボル名と、水平レベル値を明記します。最初のシンボルはインジケーターが添付されるチャートのものであり、シンボルは2から数字がつけられます。
//--- External parameters
input  int              IndicatorPeriod=14;       // Averaging period
sinput string dlm01=""; //- - - - - - - - - - - - - - - - - - - - - - - - - - -
input  string           Symbol02       ="GBPUSD"; // Symbol 2
input  string           Symbol03       ="AUDUSD"; // Symbol 3
input  string           Symbol04       ="NZDUSD"; // Symbol 4
input  string           Symbol05       ="USDCAD"; // Symbol 5
input  string           Symbol06       ="USDCHF"; // Symbol 6
sinput string dlm02=""; //- - - - - - - - - - - - - - - - - - - - - - - - - - -
input  int              Level01        =10;       // Level 1
input  int              Level02        =50;       // Level 2
input  int              Level03        =100;      // Level 3
input  int              Level04        =200;      // Level 4
input  int              Level05        =400;      // Level 5
input  int              Level06        =600;      // Level 6
後ほど扱うグローバル変数と配列を作成しなければなりません。それらすべて詳細なコメント付きで以下のコードにて提供されています。
//--- Global variables and arrays
CCanvas           canvas;                 // Loading the class
//--- Variables/arrays for copying data from OnCalculate()
int               OC_rates_total     =0;  // Size of input time series
int               OC_prev_calculated =0;  // Bars processed at the previous call
datetime          OC_time[];              // Opening time
double            OC_open[];              // Open prices
double            OC_high[];              // High prices
double            OC_low[];               // Low prices
double            OC_close[];             // Close prices
long              OC_tick_volume[];       // Tick volumes
long              OC_volume[];            // Real volumes
int               OC_spread[];            // Spread
//--- Structure of buffers for drawing indicator values
struct buffers {double data[];};
buffers           atr_buffers[SYMBOLS_COUNT];
//--- Structure of time arrays for data preparation
struct temp_time {datetime time[];};
temp_time         tmp_symbol_time[SYMBOLS_COUNT];
//--- Structure of arrays of the ATR indicator values for data preparation
struct temp_atr {double value[];};
temp_atr          tmp_atr_values[SYMBOLS_COUNT];
//--- For the purpose of storing and checking the time of the first bar in the terminal
datetime          series_first_date[SYMBOLS_COUNT];
datetime          series_first_date_last[SYMBOLS_COUNT];
//--- Time of the bar from which we will start drawing
datetime          limit_time[SYMBOLS_COUNT];
//--- Indicator levels
int               indicator_levels[LEVELS_COUNT];
//--- Symbol names
string            symbol_names[SYMBOLS_COUNT];
//--- Symbol handles
int               symbol_handles[SYMBOLS_COUNT];
//--- Colors of indicator lines
color             line_colors[SYMBOLS_COUNT]={clrRed,clrDodgerBlue,clrLimeGreen,clrGold,clrAqua,clrMagenta};
//--- String representing the lack of the symbol
string            empty_symbol="EMPTY";
//--- Indicator subwindow properties
int               subwindow_number        =WRONG_VALUE;              // Subwindow number
int               chart_width             =0;                        // Chart width
int               subwindow_height        =0;                        // Subwindow height
int               last_chart_width        =0;                        // Last saved chart width
int               last_subwindow_height   =0;                        // Last saved subwindow height
int               subwindow_center_x      =0;                        // Horizontal center of the subwindow
int               subwindow_center_y      =0;                        // Vertical center of the subwindow
string            subwindow_shortname     ="MS_ATR";                 // Short name of the indicator
string            prefix                  =subwindow_shortname+"_";  // Prefix for objects
//--- Canvas properties
string            canvas_name             =prefix+"canvas";          // Canvas name
color             canvas_background       =clrBlack;                 // Canvas background color
uchar             canvas_opacity          =190;                      // Opacity
int               font_size               =16;                       // Font size
string            font_name               ="Calibri";                // Font
ENUM_COLOR_FORMAT clr_format              =COLOR_FORMAT_ARGB_RAW;    // Color components should be correctly set by the user
//--- Canvas messages
string            msg_invalid_handle      ="Invalid indicator handle! Please wait...";
string            msg_prepare_data        ="Preparing data! Please wait...";
string            msg_not_synchronized    ="Unsynchronized data! Please wait...";
string            msg_load_data           ="";
string            msg_sync_update         ="";
string            msg_last                ="";
//--- Maximum number of bars specified in the terminal settings
int               terminal_max_bars=0;
インジケーターをチャートに追加する際に、OnInit()関数が以下を実行します;
- インジケータープロパティの設定:
- プロッティング描画用配列の決定;
- 配列の初期化;
- Market Watchウィンドウへの外部パラメーターで明記されているシンボルの追加;
- パラメーターの正誤チェックとインジケーターハンドルの初期取得
これらすべてのアクションは個別の関数にて調整されれば、より便利な方法で処理されます。結果として、OnInit()関数ソースコードは、以下のようにとても理解しやすいです;
//+------------------------------------------------------------------+
//| Custom indicator initialization function                         |
//+------------------------------------------------------------------+
int OnInit()
  {
//--- Check input parameters for correctness
   if(!CheckInputParameters())
      return(INIT_PARAMETERS_INCORRECT);
//--- Set the timer at 1-second intervals
   EventSetTimer(1);
//--- Set the font to be displayed on the canvas
   canvas.FontSet(font_name,font_size,FW_NORMAL);
//--- Initialization of arrays
   InitArrays();
//--- Initialize the array of symbols
   InitSymbolNames();
//--- Initialize the array of levels
   InitLevels();
//--- Get indicator handles
   GetIndicatorHandles();
//--- Set indicator properties
   SetIndicatorProperties();
//--- Get the number of bars specified in the terminal settings
   terminal_max_bars=TerminalInfoInteger(TERMINAL_MAXBARS);
//--- Clear the comment
   Comment("");
//--- Refresh the chart
   ChartRedraw();
//--- Initialization completed successfully
   return(INIT_SUCCEEDED);
  }
上記のコードにて使用されているカスタム関数を詳しく見てみましょう。CheckInputParameters()関数では、正誤判定のため外部パラメーターをチェックします。この場合、パラメーター一つのみをチェックします - ATRインジケーター期間です500の制限値を設定しました。つまり、もし明記された値より高い期間値を設定すれば、そのインジケーターは処理を終了し、プログラムの終了理由に関するメッセージをログとチャートコメントに出力します。CheckInputParameters()関数コードは以下にて提供されています。
//+------------------------------------------------------------------+
//| Checking input parameters for correctness                        |
//+------------------------------------------------------------------+
bool CheckInputParameters()
  {
   if(IndicatorPeriod>500)
     {
      Comment("Decrease the indicator period! Indicator Period: ",IndicatorPeriod,"; Limit: 500;");
      printf("Decrease the indicator period! Indicator Period: %d; Limit: %d;",IndicatorPeriod,500);
      return(false);
     }
//---
   return(true);
  }
3つの配列初期化関数に移ります: InitArrays()、InitSymbolNames()とInitLevels()です。それぞれのソースコードは以下で提供されています:
//+------------------------------------------------------------------+
//| First initialization of arrays                                   |
//+------------------------------------------------------------------+
void InitArrays()
  {
   ArrayInitialize(limit_time,NULL);
   ArrayInitialize(series_first_date,NULL);
   ArrayInitialize(series_first_date_last,NULL);
   ArrayInitialize(symbol_handles,INVALID_HANDLE);
//---
   for(int s=0; s<SYMBOLS_COUNT; s++)
      ArrayInitialize(atr_buffers[s].data,EMPTY_VALUE);
  }
//+------------------------------------------------------------------+
//| Initializing array of symbols                                    |
//+------------------------------------------------------------------+
void InitSymbolNames()
  {
   symbol_names[0]=AddSymbolToMarketWatch(_Symbol);
   symbol_names[1]=AddSymbolToMarketWatch(Symbol02);
   symbol_names[2]=AddSymbolToMarketWatch(Symbol03);
   symbol_names[3]=AddSymbolToMarketWatch(Symbol04);
   symbol_names[4]=AddSymbolToMarketWatch(Symbol05);
   symbol_names[5]=AddSymbolToMarketWatch(Symbol06);
  }
//+------------------------------------------------------------------+
//| Initializing array of levels                                     |
//+------------------------------------------------------------------+
void InitLevels()
  {
   indicator_levels[0]=Level01;
   indicator_levels[1]=Level02;
   indicator_levels[2]=Level03;
   indicator_levels[3]=Level04;
   indicator_levels[4]=Level05;
   indicator_levels[5]=Level06;
  }
InitSymbolNames()関数では、別のカスタム関数を使用します - AddSymbolToMarketWatch()です。シンボル名を取得し、このシンボルがリストにて使用できる場合、Market Watchウィンドウに追加されその関数はシンボル名を持つStringを返します。そのシンボルは使用できなければ、その関数は「Empty」Stringを返し、その他の関数のチェック中、シンボル配列のこの要素に対して何も実行されません。
//+------------------------------------------------------------------+
//| Adding the specified symbol to the Market Watch window           |
//+------------------------------------------------------------------+
string AddSymbolToMarketWatch(string symbol)
  {
   int      total=0; // Number of symbols
   string   name=""; // Symbol name
//--- If an empty string is passed, return the empty string
   if(symbol=="")
      return(empty_symbol);
//--- Total symbols on the server
   total=SymbolsTotal(false);
//--- Iterate over the entire list of symbols
   for(int i=0;i<total;i++)
     {
      //--- Symbol name on the server
      name=SymbolName(i,false);
      //--- If this symbol is available,
      if(name==symbol)
        {
         //--- add it to the Market Watch window and
         SymbolSelect(name,true);
         //--- return its name
         return(name);
        }
     }
//--- If this symbol is not available, return the string representing the lack of the symbol
   return(empty_symbol);
  }
GetIndicatorHandles()はインジケーター初期化中に呼ばれる別の関数です。明記されているそれぞれのシンボルにおけるATR インジケーターハンドルを取得します。もしそのハンドルがその他のシンボルにて取得されていなければ、その関数はfalseを返しますが、これは OnInit() 関数にてどのみち処理されません。ハンドルが使用できるかはプログラムのその他の部分にてチェックされます。
//+------------------------------------------------------------------+
//| Getting indicator handles                                        |
//+------------------------------------------------------------------+
bool GetIndicatorHandles()
  {
//--- An indication of all handles being valid
   bool valid_handles=true;
//--- Iterate over all symbols in a loop and ...
   for(int s=0; s<SYMBOLS_COUNT; s++)
     {
      //--- If the symbol is available
      if(symbol_names[s]!=empty_symbol)
        {
         // And if the handle of the current symbol is invalid
         if(symbol_handles[s]==INVALID_HANDLE)
           {
            //--- Get it
            symbol_handles[s]=iATR(symbol_names[s],Period(),IndicatorPeriod);
            //--- If the handle could not be obtained, try again next time
            if(symbol_handles[s]==INVALID_HANDLE)
               valid_handles=false;
           }
        }
     }
//--- Print the relevant message if the handle for one of the symbols could not be obtained
   if(!valid_handles)
     {
      msg_last=msg_invalid_handle;
      ShowCanvasMessage(msg_invalid_handle);
     }
//---
   return(valid_handles);
  }
ShowCanvasMessage()関数はキャンバスを扱うその他の関数とともに後ほど概観します。
インジケーターの属性はSetIndicatorProperties()関数雨にて設定されています。それぞれの描画における属性は同様なので、ループを用いて設定する方が便利です。
//+------------------------------------------------------------------+
//| Setting indicator properties                                     |
//+------------------------------------------------------------------+
void SetIndicatorProperties()
  {
//--- Set the short name
   IndicatorSetString(INDICATOR_SHORTNAME,subwindow_shortname);
//--- Set the number of decimal places
   IndicatorSetInteger(INDICATOR_DIGITS,_Digits);
//--- Define buffers for drawing
   for(int s=0; s<SYMBOLS_COUNT; s++)
      SetIndexBuffer(s,atr_buffers[s].data,INDICATOR_DATA);
//--- Set labels for the current symbol
   for(int s=0; s<SYMBOLS_COUNT; s++)
      PlotIndexSetString(s,PLOT_LABEL,"ATR ("+IntegerToString(s)+", "+symbol_names[s]+")");
//--- Set the plotting type: lines
   for(int s=0; s<SYMBOLS_COUNT; s++)
      PlotIndexSetInteger(s,PLOT_DRAW_TYPE,DRAW_LINE);
//--- Set the line width
   for(int s=0; s<SYMBOLS_COUNT; s++)
      PlotIndexSetInteger(s,PLOT_LINE_WIDTH,1);
//--- Set the line color
   for(int s=0; s<SYMBOLS_COUNT; s++)
      PlotIndexSetInteger(s,PLOT_LINE_COLOR,line_colors[s]);
//--- Empty value for plotting where nothing will be drawn
   for(int s=0; s<SYMBOLS_COUNT; s++)
      PlotIndexSetDouble(s,PLOT_EMPTY_VALUE,EMPTY_VALUE);
  }
プログラムの初期化の後、OnCalculate()関数の最初の呼び出しを行う必要があります。prev_calculated変数の値は最初の呼び出し時は0です。より多くの履歴がロードされるか、履歴内のギャップが埋められている際にターミナルにより0にされます。そのような場合、インジケーターバッファーは完全に再計算されます。もしこのパラメーター値が0でなければ、すなわち、入力時系列のサイズである、同じ関数により返された結果であれば、バッファーの最後の値を更新するだけで十分です。
最初にすべての計算を正しく行えることはありません。この場合、戻るため0の値を含むRESET定数を用います。OnCalculate()の次の呼び出し時(次のティック時に) prev_calculatedパラメーターが0の値を所持します。つまり、チャートのインジケーターを表示する前の必要な計算を行うさらなる試みをする必要があります。
しかし、マーケットが閉まっているか、失敗した計算や新しいティックがない際、そのチャートはなにもない状態になります。この場合、チャートのタイムフレームを変更することで、さらなる試みを行うため命令を与えるという簡単な方法を試すことができます。しかし、異なるアプローチを使用します。そのため、最初に、タイマー、OnTimer()関数をプログラムのテンプレートに追加し、OnInit()関数にて1秒のインターバルを設定しました。
毎秒毎にそのタイマーがOnCalculate()関数が0を返したか否かをチェックします。このため、OnCalculate()から、 OC_という接頭辞を持つ配列や一致する名前のグローバル変数まですべてのパラメーターをコピーするCopyDataOnCalculate()関数を記述します。
//+------------------------------------------------------------------+
//| Copying data from OnCalculate                                    |
//+------------------------------------------------------------------+
void CopyDataOnCalculate(const int      rates_total,
                         const int      prev_calculated,
                         const datetime &time[],
                         const double   &open[],
                         const double   &high[],
                         const double   &low[],
                         const double   &close[],
                         const long     &tick_volume[],
                         const long     &volume[],
                         const int      &spread[])
  {
   OC_rates_total=rates_total;
   OC_prev_calculated=prev_calculated;
   ArrayCopy(OC_time,time);
   ArrayCopy(OC_open,open);
   ArrayCopy(OC_high,high);
   ArrayCopy(OC_low,low);
   ArrayCopy(OC_close,close);
   ArrayCopy(OC_tick_volume,tick_volume);
   ArrayCopy(OC_volume,volume);
   ArrayCopy(OC_spread,spread);
  }
OnCalculate()関数の最初にこの関数を呼び出します。さらに、最初にさらに別のカスタム関数ResizeCalculatedArrays()を追加する必要があります。この関数はインジケーターバッファーに設定する前にデータの準備のために配列にサイズを設定します。これらの配列のサイズは入力時系列のサイズと等しいです。
//+------------------------------------------------------------------+
//| Resizing the size of arrays to the size of the main array        |
//+------------------------------------------------------------------+
void ResizeCalculatedArrays()
  {
   for(int s=0; s<SYMBOLS_COUNT; s++)
     {
      ArrayResize(tmp_symbol_time[s].time,OC_rates_total);
      ArrayResize(tmp_atr_values[s].value,OC_rates_total);
     }
  }
さらに、チャートに出力する前にデータの準備のために配列を0に初期化するZeroCalculatedArrays()関数を作成します。
//+------------------------------------------------------------------+
//| Zeroing out arrays for data preparation                          |
//+------------------------------------------------------------------+
void ZeroCalculatedArrays()
  {
   for(int s=0; s<SYMBOLS_COUNT; s++)
     {
      ArrayInitialize(tmp_symbol_time[s].time,NULL);
      ArrayInitialize(tmp_atr_values[s].value,EMPTY_VALUE);
     }
  }
同じ関数にてインジケーターバッファーを0にする必要があります。それを ZeroIndicatorBuffers()と呼びましょう。
//+------------------------------------------------------------------+
//| Zeroing out indicator buffers                                    |
//+------------------------------------------------------------------+
void ZeroIndicatorBuffers()
  {
   for(int s=0; s<SYMBOLS_COUNT; s++)
      ArrayInitialize(atr_buffers[s].data,EMPTY_VALUE);
  }
OnCalculate()関数の現在のコードは以下にてご覧になれます。後ほど主要な処理が記入されるようコメントを記載しています。
//+------------------------------------------------------------------+
//| Custom indicator iteration function                              |
//+------------------------------------------------------------------+
int OnCalculate(const int      rates_total,     // Size of input time series
                const int      prev_calculated, // Bars processed at the previous call
                const datetime &time[],         // Opening time
                const double   &open[],         // Open prices
                const double   &high[],         // High prices
                const double   &low[],          // Low prices
                const double   &close[],        // Close prices
                const long     &tick_volume[],  // Tick volumes
                const long     &volume[],       // Real volumes
                const int      &spread[])       // Spread
  {
//--- For the purpose of determining the bar from which the calculation shall be made
   int limit=0;
//--- Make a copy of the OnCalculate() parameters
   CopyDataOnCalculate(rates_total,prev_calculated,
                       time,open,high,low,close,
                       tick_volume,volume,spread);
//--- Set the size to arrays for data preparation
   ResizeCalculatedArrays();
//--- If this is the first calculation or if a deeper history has been loaded or gaps in the history have been filled
   if(prev_calculated==0)
     {
      //--- Zero out arrays for data preparation
      ZeroCalculatedArrays();
      //--- Zero out indicator buffers
      ZeroIndicatorBuffers();
      //--- Other checks
      // ...
      //--- If you reached this point, it means that OnCalculate() will return non-zero value and this needs to be saved
      OC_prev_calculated=rates_total;
     }
//--- If only the last values need to be recalculated
   else
      limit=prev_calculated-1;

//--- Prepare data for drawing
// ...
//--- Fill arrays with data for drawing
// ...

//--- Return the size of the data array of the current symbol
   return(rates_total);
  }
OnTimer() 関数コードは以下にあります:
//+------------------------------------------------------------------+
//| Timer function                                                   |
//+------------------------------------------------------------------+
void OnTimer()
  {
//--- If for some reason calculations have not been completed or
//    a deeper history has been loaded or
//    gaps in the history have been filled,
//    then make another attempt without waiting for the new tick
   if(OC_prev_calculated==0)
     {
      OnCalculate(OC_rates_total,OC_prev_calculated,
                  OC_time,OC_open,OC_high,OC_low,OC_close,
                  OC_tick_volume,OC_volume,OC_spread);
     }
  }
prev_calculated変数が0に等しい際に使用されるそのほかの関数を考察してみましょう。これらの関数は:
- 必要なデータ量を生成し、ロードします;
- ハンドルが使用できるかチェックします;
- 必要なデータが読めるかをチェックします;
- サーバーとデータを同期化します;
- 描画が行われるバーを決定します。
さらに、各シンボル毎で最初の「本当の」バーを特定します。この意味は後ほど紹介します。詳しくは以下です。すべてのタイムフレームが分毎のデータから作成されます。しかし、例えば、サーバーの日々のデータは1993年から使用できますが、一方、分毎のデータは2000年からしかし使用できないとすれば、時間毎のチャートを選択した際、分毎のデータが使用可能になった2000年からバーが作成され始めます。2000年より前は、日毎のデータや現在のタイムフレームに近いデータにて表現されます。したがって、混乱を避けるために現在のタイムフレームに関連しないデータのためにインジケータデータを表示すべきではありません。これは、現在のタイムフレームにおける「本当の」最初のバーを特定し、シンボルのインジケーターバッファーと同じ色の垂直線でマークするためです。
「本当の」バーの特定は、エキスパートアドバイザーを開発する際にも重要です。なぜなら、パラメーターが特定のタイムフレームにおいて最適化される際、その他のタイムフレームからのデータが不適切になる可能性があるためです。
上記のチェックを行う前に、キャンバスをインジケーターサブウィンドウに追加します。最初にキャンバスを管理するのに必要な関数を記述します。キャンバスをサブウィンドウに追加する前に、テキストメッセージがキャンバスに表示される際に重要な座標値に加えて、サイズを決定する必要があります。このために、GetSubwindowGeometry()関数を記述しましょう:
//+------------------------------------------------------------------+
//| Getting geometry of the indicator subwindow                      |
//+------------------------------------------------------------------+
void GetSubwindowGeometry()
  {
//--- Get the indicator subwindow number
   subwindow_number=ChartWindowFind(0,subwindow_shortname);
//--- Get the subwindow width and height
   chart_width=(int)ChartGetInteger(0,CHART_WIDTH_IN_PIXELS);
   subwindow_height=(int)ChartGetInteger(0,CHART_HEIGHT_IN_PIXELS,subwindow_number);
//--- Calculate the center of the subwindow
   subwindow_center_x=chart_width/2;
   subwindow_center_y=subwindow_height/2;
  }
サブウィンドウ属性が取得された際にキャンバスを追加できます。その背景は100% 透明になります(不透明度は 0に等しいです)、何が起こっているかユーザーに知らせるためにデータをロードし生成する際に見えるようになります。見えるようにする場合、背景の不透明度は190に等しくなります。0から 255の間で不透明度の値を設定できます。より詳しくは、Help下にあるColorToARGB()関数の記述を参照してください。
キャンバスを設定するためにSetCanvas()関数を記述します;
//+------------------------------------------------------------------+
//| Setting canvas                                                   |
//+------------------------------------------------------------------+
void SetCanvas()
  {
//--- If there is no canvas, set it
   if(ObjectFind(0,canvas_name)<0)
     {
      //--- Create the canvas
      canvas.CreateBitmapLabel(0,subwindow_number,canvas_name,0,0,chart_width,subwindow_height,clr_format);
      //--- Make the canvas completely transparent
      canvas.Erase(ColorToARGB(canvas_background,0));
      //--- Redraw the canvas
      canvas.Update();
     }
  }
インジケーターサブウィンドウが再調整されたかをチェックする関数も必要です。もしあれば、キャンバスのサイズが自動的に新しいサブウィンドウのサイズに調整されます。この関数をOnSubwindowChange()と呼びましょう:
//+------------------------------------------------------------------+
//| Checking the subwindow size                                      |
//+------------------------------------------------------------------+
void OnSubwindowChange()
  {
//--- Get subwindow properties
   GetSubwindowGeometry();
//--- If the subwindow size has not changed, exit
   if(!SubwindowSizeChanged())
      return;
//--- If the subwindow height is less than one pixel or if the center has been calculated incorrectly, exit
   if(subwindow_height<1 || subwindow_center_y<1)
      return;
//--- Set the new canvas size
   ResizeCanvas();
//--- Show the last message
   ShowCanvasMessage(msg_last);
  }
上記のコードにてハイライト表示されている関数は以下にて詳しく述べられます。サブウィンドウのサイズ変更を行う前に稼働しているチェックの種類に注目してください。どれかプロパティが間違っていれば、その関数は処理を停止します。
SubwindowSizeChanged()関数のコードは以下です:
//+------------------------------------------------------------------+
//| Checking if the subwindow has been resized                       |
//+------------------------------------------------------------------+
bool SubwindowSizeChanged()
  {
//--- If the subwindow size has not changed, exit
   if(last_chart_width==chart_width && last_subwindow_height==subwindow_height)
      return(false);
//--- If the size has changed, save it
   else
     {
      last_chart_width=chart_width;
      last_subwindow_height=subwindow_height;
     }
//---
   return(true);
  }
ResizeCanvas()関数のコードは以下です:
//+------------------------------------------------------------------+
//| Resizing canvas                                                  |
//+------------------------------------------------------------------+
void ResizeCanvas()
  {
//--- If the canvas has already been added to the indicator subwindow, set the new size
   if(ObjectFind(0,canvas_name)==subwindow_number)
      canvas.Resize(chart_width,subwindow_height);
  }
そして、最後に、インジケーターのハンドルを取得する際に使用するShowCanvasMessage()関数のコードが以下です。
//+------------------------------------------------------------------+
//| Displaying message on the canvas                                 |
//+------------------------------------------------------------------+
void ShowCanvasMessage(string message_text)
  {
   GetSubwindowGeometry();
//--- If the canvas has already been added to the indicator subwindow
   if(ObjectFind(0,canvas_name)==subwindow_number)
     {
      //--- If the string passed is not empty and correct coordinates have been obtained, display the message
      if(message_text!="" && subwindow_center_x>0 && subwindow_center_y>0)
        {
         canvas.Erase(ColorToARGB(canvas_background,canvas_opacity));
         canvas.TextOut(subwindow_center_x,subwindow_center_y,message_text,ColorToARGB(clrRed),TA_CENTER|TA_VCENTER);
         canvas.Update();
        }
     }
  }
キャンバスは消去エフェクトともに削除されます。それを実装するため、キャンバス削除前に徐々に不透明度を現在の値から0にループを用いて変更する必要があります。
DeleteCanvas()関数のコードは以下です:
//+------------------------------------------------------------------+
//| Deleting canvas                                                  |
//+------------------------------------------------------------------+
void DeleteCanvas()
  {
//--- Delete the canvas if it exists
   if(ObjectFind(0,canvas_name)>0)
     {
      //--- Before deleting, implement the disappearing effect
      for(int i=canvas_opacity; i>0; i-=5)
        {
         canvas.Erase(ColorToARGB(canvas_background,(uchar)i));
         canvas.Update();
        }
      //--- Delete the graphical resource
      canvas.Destroy();
     }
  }
次に、インジケーターバッファーに配置し、チャートに表示する前にデータが読めるかをチェックする上で必要な関数を見ていきましょう。LoadAndFormData()関数から始めましょう。現在のシンボルの配列のサイズとその他のシンボルにて使用できるデータを比較するために使用します。必要な際には、データはサーバーからロードされます。その関数のコードは、詳細なコメント付きで以下に記載されています。
//+------------------------------------------------------------------+
//| Loading and generating the necessary/available amount of data    |
//+------------------------------------------------------------------+
void LoadAndFormData()
  {
   int bars_count=100; // Number of loaded bars
//---
   for(int s=0; s<SYMBOLS_COUNT; s++)
     {
      int      attempts          =0;    // Counter of data copying attempts
      int      array_size        =0;    // Array size
      datetime firstdate_server  =NULL; // Time of the first bar on the server
      datetime firstdate_terminal=NULL; // Time of the first bar in the terminal base
      //--- Get the first date by the symbol/time frame in the terminal base
      SeriesInfoInteger(symbol_names[s],Period(),SERIES_FIRSTDATE,firstdate_terminal);
      //--- Get the first date of the symbol/time frame on the server
      SeriesInfoInteger(symbol_names[s],Period(),SERIES_SERVER_FIRSTDATE,firstdate_server);
      //--- Print the message
      msg_last=msg_load_data="Loading and generating data: "+
               symbol_names[s]+"("+(string)(s+1)+"/"+(string)SYMBOLS_COUNT+") ... ";
      ShowCanvasMessage(msg_load_data);
      //--- Load/generate data.
      //    If the array size is smaller than the maximum number of bars in the terminal, and if
      //    the number of bars between the first date of the series in the terminal and the first date of the series on the server is more than specified
      while(array_size<OC_rates_total &&
            firstdate_terminal-firstdate_server>PeriodSeconds()*bars_count)
        {
         datetime copied_time[];
         //--- Get the first date by the symbol/time frame in the terminal base
         SeriesInfoInteger(symbol_names[s],Period(),SERIES_FIRSTDATE,firstdate_terminal);
         //--- Load/copy the specified number of bars
         if(CopyTime(symbol_names[s],Period(),0,array_size+bars_count,copied_time)!=-1)
           {
            //--- If the time of the first bar in the array, excluding the number of the bars being loaded, is earlier
            //    than the time of the first bar in the chart, terminate the loop
            if(copied_time[0]-PeriodSeconds()*bars_count<OC_time[0])
               break;
            //--- If the array size hasn't increased, increase the counter
            if(ArraySize(copied_time)==array_size)
               attempts++;
            //--- Otherwise get the current size of the array
            else
               array_size=ArraySize(copied_time);
            //--- If the array size hasn't increased over 100 attempts, terminate the loop
            if(attempts==100)
              {
               attempts=0;
               break;
              }
           }
         //--- Check the subwindow size once every 2000 bars
         //    and if the size has changed, adjust the canvas size to it
         if(!(array_size%2000))
            OnSubwindowChange();
        }
     }
  }
必要な量のデータをロードしたのち、再度インジケーターハンドルをチェックしあmす。このため、上記のGetIndicatorHandles()関数を使用します。
そのハンドルがチェックされれば、プログラムは明記されたシンボルのデータや各シンボルのインジケーター値が使用できるか、CheckAvailableData()関数を用いてチェックします。以下にてどのように実行されるかご覧になれます。
//+------------------------------------------------------------------+
//| Checking the amount of available data for all symbols            |
//+------------------------------------------------------------------+
bool CheckAvailableData()
  {
   for(int s=0; s<SYMBOLS_COUNT; s++)
     {
      //--- If this symbol is available
      if(symbol_names[s]!=empty_symbol)
        {
         double   data[]; // Array for checking the amount of indicator data
         datetime time[]; // Array for checking the number of bars
         int      calculated_values =0;    // Amount of indicator data
         int      available_bars    =0;    // Number of bars of the current period
         datetime firstdate_terminal=NULL; // First date of the current time frame data available in the terminal
         //--- Get the number of calculated values of the indicator
         calculated_values=BarsCalculated(symbol_handles[s]);
         //--- Get the first date of the current time frame data in the terminal
         firstdate_terminal=(datetime)SeriesInfoInteger(symbol_names[s],Period(),SERIES_TERMINAL_FIRSTDATE);
         //--- Get the number of available bars from the date specified
         available_bars=Bars(symbol_names[s],Period(),firstdate_terminal,TimeCurrent());
         //--- Check the readiness of bar data: 5 attempts to get values
         for(int i=0; i<5; i++)
           {
            //--- Copy the specified amount of data
            if(CopyTime(symbol_names[s],Period(),0,available_bars,time)!=-1)
              {
               //--- If the required amount has been copied, terminate the loop
               if(ArraySize(time)>=available_bars)
                  break;
              }
           }
         //--- Check the readiness of indicator data: 5 attempts to get values
         for(int i=0; i<5; i++)
           {
            //--- Copy the specified amount of data
            if(CopyBuffer(symbol_handles[s],0,0,calculated_values,data)!=-1)
              {
               //--- If the required amount has been copied, terminate the loop
               if(ArraySize(data)>=calculated_values)
                  break;
              }
           }
         //--- If the amount of data copied is not sufficient, one more attempt is required
         if(ArraySize(time)<available_bars || ArraySize(data)<calculated_values)
           {
            msg_last=msg_prepare_data;
            ShowCanvasMessage(msg_prepare_data);
            OC_prev_calculated=0;
            return(false);
           }
        }
     }
//---
   return(true);
  }
CheckAvailableData()関数は、すべてのシンボルにおけるデータが準備完了になるまでさらなる計算を行いません。すべてのチェックを行う関数の処理は類似したパターンに沿います。
次の関数は、取引価格の履歴のロードを行うイベントの監視のために必要です。CheckEventLoadHistoryと呼びましょう。さらなるデータ量がロードされれば、そのインジケーターは再度計算されます。この関数のソースコードは以下です;
//+------------------------------------------------------------------+
//| Checking the event of loading a deeper history                   |
//+------------------------------------------------------------------+
bool CheckLoadedHistory()
  {
   bool loaded=false;
//---
   for(int s=0; s<SYMBOLS_COUNT; s++)
     {
      //--- If this symbol is available
      if(symbol_names[s]!=empty_symbol)
        {
         //--- If the series need to be updated
         if(OC_prev_calculated==0)
           {
            //--- Get the first date by the symbol/time frame
            series_first_date[s]=(datetime)SeriesInfoInteger(symbol_names[s],Period(),SERIES_FIRSTDATE);
            //--- If this is the first time (no value is available), then
            if(series_first_date_last[s]==NULL)
               //--- Store the first date by the symbol/time frame for further comparison
               //    in order to determine if a deeper history has been loaded
               series_first_date_last[s]=series_first_date[s];
           }
         else
           {
            //--- Get the first date by the symbol/time frame
            series_first_date[s]=(datetime)SeriesInfoInteger(symbol_names[s],Period(),SERIES_FIRSTDATE);
            //--- If the dates are different, i.e. the date in the memory is later than the one we have just obtained,
            //     this means that a deeper history has been loaded
            if(series_first_date_last[s]>series_first_date[s])
              {
               //--- Print the relevant message to the log
               Print("(",symbol_names[s],",",TimeframeToString(Period()),
                     ") > A deeper history has been loaded/generated: ",
                     series_first_date_last[s]," > ",series_first_date[s]);
               //--- Store the date
               series_first_date_last[s]=series_first_date[s];
               loaded=true;
              }
           }
        }
     }
//--- If a deeper history has been loaded/generated, then
//    send the command to refresh the plotting series of the indicator
   if(loaded)
      return(false);
//---
   return(true);
  }
ターミナルとサーバーのデータの同期化をチェックする別の関数を記述しましょう。そのチェックはサーバーとの接続が行われた際にのみ稼働します。CheckSymbolIsSynchronized() 関数のコードは以下にて提供されています;
//+------------------------------------------------------------------+
//| Checking synchronization by symbol/time frame                    |
//+------------------------------------------------------------------+
bool CheckSymbolIsSynchronized()
  {
//--- If the connection to the server is established, check the data synchronization
   if(TerminalInfoInteger(TERMINAL_CONNECTED))
     {
      for(int s=0; s<SYMBOLS_COUNT; s++)
        {
         //--- If the symbol is available
         if(symbol_names[s]!=empty_symbol)
           {
            //--- If the data are not synchronized, print the relevant message and try again
            if(!SeriesInfoInteger(symbol_names[s],Period(),SERIES_SYNCHRONIZED))
              {
               msg_last=msg_not_synchronized;
               ShowCanvasMessage(msg_not_synchronized);
               return(false);
              }
           }
        }
     }
//---
   return(true);
  }
タイムフレームのString型への変換のための関数は"MQL5クックブック"の記事から取得できます;
//+------------------------------------------------------------------+
//| Converting time frame to a string                                |
//+------------------------------------------------------------------+
string TimeframeToString(ENUM_TIMEFRAMES timeframe)
  {
   string str="";
//--- If the value passed is incorrect, take the current chart time frame
   if(timeframe==WRONG_VALUE || timeframe== NULL)
      timeframe= Period();
   switch(timeframe)
     {
      case PERIOD_M1  : str="M1";  break;
      case PERIOD_M2  : str="M2";  break;
      case PERIOD_M3  : str="M3";  break;
      case PERIOD_M4  : str="M4";  break;
      case PERIOD_M5  : str="M5";  break;
      case PERIOD_M6  : str="M6";  break;
      case PERIOD_M10 : str="M10"; break;
      case PERIOD_M12 : str="M12"; break;
      case PERIOD_M15 : str="M15"; break;
      case PERIOD_M20 : str="M20"; break;
      case PERIOD_M30 : str="M30"; break;
      case PERIOD_H1  : str="H1";  break;
      case PERIOD_H2  : str="H2";  break;
      case PERIOD_H3  : str="H3";  break;
      case PERIOD_H4  : str="H4";  break;
      case PERIOD_H6  : str="H6";  break;
      case PERIOD_H8  : str="H8";  break;
      case PERIOD_H12 : str="H12"; break;
      case PERIOD_D1  : str="D1";  break;
      case PERIOD_W1  : str="W1";  break;
      case PERIOD_MN1 : str="MN1"; break;
     }
//---
   return(str);
  }
そして最後に、チャート内を垂直線にてマークし、それぞれのシンボルごとの最初の「本当の」バーを特定し、保存する必要があります。このために、DetermineFirstTrueBar()関数と、最初のバーの時間を返す補助関数GetFirstTrueBarTime()を記述しましょう.
//+-----------------------------------------------------------------------+
//| Determining the time of the first true bar for the purpose of drawing |
//+-----------------------------------------------------------------------+
bool DetermineFirstTrueBar()
  {
   for(int s=0; s<SYMBOLS_COUNT; s++)
     {
      datetime time[];           // Bar time array
      int      available_bars=0; // Number of bars
      //--- If this symbol is not available, move to the next one
      if(symbol_names[s]==empty_symbol)
         continue;
      //--- Get the total number of bars for the symbol
      available_bars=Bars(symbol_names[s],Period());
      //--- Copy the bar time array. If this action failed, try again.
      if(CopyTime(symbol_names[s],Period(),0,available_bars,time)<available_bars)
         return(false);
      //--- Get the time of the first true bar corresponding to the current time frame
      limit_time[s]=GetFirstTrueBarTime(time);
      //--- Place a vertical line on the true bar
      CreateVerticalLine(0,0,limit_time[s],prefix+symbol_names[s]+": begin time series",
                          2,STYLE_SOLID,line_colors[s],false,TimeToString(limit_time[s]),"\n");
     }
//---
   return(true);
  }
//+-----------------------------------------------------------------------+
//| Returning the time of the first true bar of the current time frame    |
//+-----------------------------------------------------------------------+
datetime GetFirstTrueBarTime(datetime &time[])
  {
   datetime true_period =NULL; // Time of the first true bar
   int      array_size  =0;    // Array size
//--- Get the array size
   array_size=ArraySize(time);
   ArraySetAsSeries(time,false);
//--- Check each bar one by one
   for(int i=1; i<array_size; i++)
     {
      //--- If the bar corresponds to the current time frame
      if(time[i]-time[i-1]==PeriodSeconds())
        {
         //--- Save it and terminate the loop
         true_period=time[i];
         break;
        }
     }
//--- Return the time of the first true bar
   return(true_period);
  }
CreateVerticalLine()関数を用いて、最初のバーの時刻が垂直線でチャート内にてマークされています。
//+------------------------------------------------------------------+
//| Creating a vertical line at the specified time point             |
//+------------------------------------------------------------------+
void CreateVerticalLine(long            chart_id,           // chart id
                        int             window_number,      // window number
                        datetime        time,               // time
                        string          object_name,        // object name
                        int             line_width,         // line width
                        ENUM_LINE_STYLE line_style,         // line style
                        color           line_color,         // line color
                        bool            selectable,         // cannot select the object if FALSE
                        string          description_text,   // text of the description
                        string          tooltip)            // no tooltip if "\n"
  {
//--- If the object has been created successfully
   if(ObjectCreate(chart_id,object_name,OBJ_VLINE,window_number,time,0))
     {
      //--- set its properties
      ObjectSetInteger(chart_id,object_name,OBJPROP_TIME,time);
      ObjectSetInteger(chart_id,object_name,OBJPROP_SELECTABLE,selectable);
      ObjectSetInteger(chart_id,object_name,OBJPROP_STYLE,line_style);
      ObjectSetInteger(chart_id,object_name,OBJPROP_WIDTH,line_width);
      ObjectSetInteger(chart_id,object_name,OBJPROP_COLOR,line_color);
      ObjectSetString(chart_id,object_name,OBJPROP_TEXT,description_text);
      ObjectSetString(chart_id,object_name,OBJPROP_TOOLTIP,tooltip);
     }
  }
チェック関数は準備完了です。結果として、prev_calculated変数が0の時、OnCalculate()関数コードは以下のようになります:
//--- If this is the first calculation or if a deeper history has been loaded or gaps in the history have been filled
   if(prev_calculated==0)
     {
      //--- Zero out arrays for data preparation
      ZeroCalculatedArrays();
      //--- Zero out indicator buffers
      ZeroIndicatorBuffers();
      //--- Get subwindow properties
      GetSubwindowGeometry();
      //--- Add the canvas
      SetCanvas();
      //--- Load and generate the necessary/available amount of data
      LoadAndFormData();
      //--- If there is an invalid handle, try to get it again
      if(!GetIndicatorHandles())
         return(RESET);
      //--- Check the amount of data available for all symbols
      if(!CheckAvailableData())
         return(RESET);
      //--- Check if a deeper history has been loaded
      if(!CheckLoadedHistory())
         return(RESET);
      //--- Check synchronization by symbol/time frame at the current moment
      if(!CheckSymbolIsSynchronized())
         return(RESET);
      //--- For each symbol, determine the bar from which we should start drawing
      if(!DetermineFirstTrueBar())
         return(RESET);
      //--- If you reached this point, it means that OnCalculate() will return non-zero value and this needs to be saved
      OC_prev_calculated=rates_total;
     }
特定のチェックが失敗するごとに、そのプログラムは次のティックか、タイマーイベント時に再度試すためにもどります。タイマーにて、OnCalculate()関数から履歴をロードするためのチェックを稼働します。
//+------------------------------------------------------------------+
//| Timer function                                                   |
//+------------------------------------------------------------------+
void OnTimer()
  {
//--- If a deeper history has been loaded
   if(!CheckLoadedHistory())
      OC_prev_calculated=0;
//--- If for some reason calculations have not been completed or
//    a deeper history has been loaded or
//    gaps in the history have been filled,
//    then make another attempt without waiting for the new tick
   if(OC_prev_calculated==0)
     {
      OnCalculate(OC_rates_total,OC_prev_calculated,
                  OC_time,OC_open,OC_high,OC_low,OC_close,
                  OC_tick_volume,OC_volume,OC_spread);
     }
  }
あとは、OnCalculate()関数にて配置されている二つのメインループを記述するだけです。
- 最初のループは、「あらゆる方法で値を取得する」という法則に基づいたデータを準備し、インジケータのギャップを避けます。そのアイディアの元はシンプルです;特定回数の試みがその値を取得に失敗した際に行われます。このループでは、シンボルのタイム値とボラティリティインジケーター(ATR)値が個別の配列に保存されます。
- 二番目のループにて、インジケーターバッファーに記入する際にその他のシンボルのタイム配列が現在のシンボルの時間とすべての病がの同期の比較に必要となります。
最初のループのコードは以下です;
//--- Prepare data for drawing
   for(int s=0; s<SYMBOLS_COUNT; s++)
     {
      //--- If the symbol is available
      if(symbol_names[s]!=empty_symbol)
        {
         double percent=0.0; // For the purpose of calculating the progress percentage
         msg_last=msg_sync_update="Preparing data ("+IntegerToString(rates_total)+" bars) : "+
                      symbol_names[s]+"("+(string)(s+1)+"/"+(string)(SYMBOLS_COUNT)+") - 00% ... ";
         //--- Print the message
         ShowCanvasMessage(msg_sync_update);
         //--- Control every value of the array
         for(int i=limit; i<rates_total; i++)
           {
            PrepareData(i,s,time);
            //--- Refresh the message once every 1000 bars
            if(i%1000==0)
              {
               //--- Progress percentage
               ProgressPercentage(i,s,percent);
               //--- Print the message
               ShowCanvasMessage(msg_sync_update);
              }
            //--- Check the subwindow size once every 2000 bars
            //    and if the size has changed, adjust the canvas size to it
            if(i%2000==0)
               OnSubwindowChange();
           }
        }
     }
値のコピーと保存を行うメイン関数PrepareData()は上記のコードにてハイライト表示されています。いまだ考慮されていなかった新しい関数 ProgressPercentage()があります。どのくらいの時間続くのかユーザーに知らせるため、現在の処理の進行率を計算します。
PrepareData()関数のコードは以下の通りです:
//+------------------------------------------------------------------+
//| Preparing data before drawing                                    |
//+------------------------------------------------------------------+
void PrepareData(int bar_index,int symbol_number,datetime const &time[])
  {
   int attempts=100; // Number of copying attempts
//--- Time of the bar of the specified symbol and time frame
   datetime symbol_time[];
//--- Array for copying indicator values
   double atr_values[];
//--- If within the area of the current time frame bars
   if(time[bar_index]>=limit_time[symbol_number])
     {
      //--- Copy the time
      for(int i=0; i<attempts; i++)
        {
         if(CopyTime(symbol_names[symbol_number],0,time[bar_index],1,symbol_time)==1)
           {
            tmp_symbol_time[symbol_number].time[bar_index]=symbol_time[0];
            break;
           }
        }
      //--- Copy the indicator value
      for(int i=0; i<attempts; i++)
        {
         if(CopyBuffer(symbol_handles[symbol_number],0,time[bar_index],1,atr_values)==1)
           {
            tmp_atr_values[symbol_number].value[bar_index]=atr_values[0];
            break;
           }
        }
     }
//--- If outside the area of the current time frame bars, set an empty value
   else
      tmp_atr_values[symbol_number].value[bar_index]=EMPTY_VALUE;
  }
ProgressPercentage()関数のコードは以下の通りになります:
//+------------------------------------------------------------------+
//| Calculating progress percentage                                  |
//+------------------------------------------------------------------+
void ProgressPercentage(int bar_index,int symbol_number,double &percent)
  {
   string message_text="";
   percent=(double(bar_index)/OC_rates_total)*100;
//---
   if(percent<=9.99)
      message_text="0"+DoubleToString(percent,0);
   else if(percent<99)
      message_text=DoubleToString(percent,0);
   else
      message_text="100";
//---
   msg_last=msg_sync_update="Preparing data ("+(string)OC_rates_total+" bars) : "+
            symbol_names[symbol_number]+
            "("+(string)(symbol_number+1)+"/"+(string)SYMBOLS_COUNT+") - "+message_text+"% ... ";
  }
インジケーターバッファーはOnCalculate()関数の二番目のループにて記入されます:
//--- Fill indicator buffers
   for(int s=0; s<SYMBOLS_COUNT; s++)
     {
      //--- If the specified symbol does not exist, zero out the buffer
      if(symbol_names[s]==empty_symbol)
         ArrayInitialize(atr_buffers[s].data,EMPTY_VALUE);
      else
        {
         //--- Generate a message
         msg_last=msg_sync_update="Updating indicator data: "+
                      symbol_names[s]+"("+(string)(s+1)+"/"+(string)SYMBOLS_COUNT+") ... ";
         //--- Print the message
         ShowCanvasMessage(msg_sync_update);
         //--- Fill indicator buffers with values
         for(int i=limit; i<rates_total; i++)
           {
            FillIndicatorBuffers(i,s,time);
            //--- Check the subwindow size once every 2000 bars
            //    and if the size has changed, adjust the canvas size to it
            if(i%2000==0)
               OnSubwindowChange();
           }
        }
     }
上記のコードでハイライト表示されたStringは、FillIndicatorBuffers()関数を含みます。これは、最後のオペレーションがチャート内でインジケーターの描画を表示する前、実行されるところです。
//+------------------------------------------------------------------+
//| Filling indicator buffers                                        |
//+------------------------------------------------------------------+
void FillIndicatorBuffers(int bar_index,int symbol_number,datetime const &time[])
  {
//--- For the purpose of checking the obtained indicator value
   bool check_value=false;
//--- Counter of the current time frame bars
   static int bars_count=0;
//--- Zero out the counter of the current time frame bars at the beginning of the symbol's time series
   if(bar_index==0)
      bars_count=0;
//--- If within the area of current time frame bars and the counter is smaller
//    than the specified indicator period, increase the counter
   if(bars_count<IndicatorPeriod && time[bar_index]>=limit_time[symbol_number])
      bars_count++;
//--- If within the indicator area and the time of the current symbol coincides with the time of the specified symbol
   if(bars_count>=IndicatorPeriod &&
      time[bar_index]==tmp_symbol_time[symbol_number].time[bar_index])
     {
      //--- If the value obtained is not empty
      if(tmp_atr_values[symbol_number].value[bar_index]!=EMPTY_VALUE)
        {
         check_value=true;
         atr_buffers[symbol_number].data[bar_index]=tmp_atr_values[symbol_number].value[bar_index];
        }
     }
//--- Set an empty value in case of failure to set a higher value
   if(!check_value)
      atr_buffers[symbol_number].data[bar_index]=EMPTY_VALUE;
  }
OnCalculate()関数の最後にキャンバスを削除し、レベルを設定、メッセージの変数を0にし、チャートをリフレッシュする必要があります。最後にrates_total 配列のサイズが返され、その後、最後の値がOnCalculate()の後続のティックやタイマーイベントごとに再計算されます。
これらはに番目のループと関数によって返される値の間に挿入されるコードです。
//--- Delete the canvas
   DeleteCanvas();
//--- Set indicator levels
   SetIndicatorLevels();
//--- Zero out variables
   msg_last="";
   msg_sync_update="";
//--- Refresh the chart
   ChartRedraw();
水平レベルを設定するためのSetIndicatorLevels()関数のコードは以下のようになります;
//+------------------------------------------------------------------------+
//| Setting indicator levels                                               |
//+------------------------------------------------------------------------+
void SetIndicatorLevels()
  {
//--- Get the indicator subwindow number
   subwindow_number=ChartWindowFind(0,subwindow_shortname);
//--- Set levels
   for(int i=0; i<LEVELS_COUNT; i++)
      CreateHorizontalLine(0,subwindow_number,
                            prefix+"level_0"+(string)(i+1)+"",
                            CorrectValueBySymbolDigits(indicator_levels[i]*_Point),
                            1,STYLE_DOT,clrLightSteelBlue,false,false,false,"\n");
  }
//+------------------------------------------------------------------------+
//| Adjusting the value based on the number of digits in the price (double)|
//+------------------------------------------------------------------------+
double CorrectValueBySymbolDigits(double value)
  {
   return(_Digits==3 || _Digits==5) ? value*=10 : value;
  }
特定のプロパティにて水平レベルを設定するためのCreateHorizontalLine()関数コードは以下の通りです:
//+------------------------------------------------------------------+
//| Creating a horizontal line at the price level specified          |
//+------------------------------------------------------------------+
void CreateHorizontalLine(long            chart_id,      // chart id
                          int             window_number, // window number
                          string          object_name,   // object name
                          double          price,         // price level
                          int             line_width,    // line width
                          ENUM_LINE_STYLE line_style,    // line style
                          color           line_color,    // line color
                          bool            selectable,    // cannot select the object if FALSE
                          bool            selected,      // line is selected
                          bool            back,          // background position
                          string          tooltip)       // no tooltip if "\n"
  {
//--- If the object has been created successfully
   if(ObjectCreate(chart_id,object_name,OBJ_HLINE,window_number,0,price))
     {
      //--- set its properties
      ObjectSetInteger(chart_id,object_name,OBJPROP_SELECTABLE,selectable);
      ObjectSetInteger(chart_id,object_name,OBJPROP_SELECTED,selected);
      ObjectSetInteger(chart_id,object_name,OBJPROP_BACK,back);
      ObjectSetInteger(chart_id,object_name,OBJPROP_STYLE,line_style);
      ObjectSetInteger(chart_id,object_name,OBJPROP_WIDTH,line_width);
      ObjectSetInteger(chart_id,object_name,OBJPROP_COLOR,line_color);
      ObjectSetString(chart_id,object_name,OBJPROP_TOOLTIP,tooltip);
     }
  }
グラフィカルオブジェクト削除のための関数::
//+------------------------------------------------------------------+
//| Deleting levels                                                  |
//+------------------------------------------------------------------+
void DeleteLevels()
  {
   for(int i=0; i<LEVELS_COUNT; i++)
      DeleteObjectByName(prefix+"level_0"+(string)(i+1)+"");
  }
//+------------------------------------------------------------------+
//| Deleting vertical lines of the beginning of the series           |
//+------------------------------------------------------------------+
void DeleteVerticalLines()
  {
   for(int s=0; s<SYMBOLS_COUNT; s++)
      DeleteObjectByName(prefix+symbol_names[s]+": begin time series");
  }
//+------------------------------------------------------------------+
//| Deleting the object by name                                      |
//+------------------------------------------------------------------+
void DeleteObjectByName(string object_name)
  {
//--- If such object exists
   if(ObjectFind(0,object_name)>=0)
     {
      //--- If an error occurred when deleting, print the relevant message
      if(!ObjectDelete(0,object_name))
         Print("Error ("+IntegerToString(GetLastError())+") when deleting the object!");
     }
  }
以下のコードがOnDeinit()関数に追加されます;
すべて準備が整い、やっとテストできますね。ウィンドウのバーの最大数がターミナル設定のChartsタブにて設定できます。インジケーターの稼働のために準備する速さはウィンドウのバー数に基づいています。

図1. ターミナル設定のバーの最大数の設定
チャートにインジケーターをロードする際に、すべてのシンボルにおけるデータの準備の進行をご覧になれます。

図2. データ準備中のキャンバスにおけるメッセージ
20分間のタイムフレームにおけるインジケーターを表示しているスクリーンショットを以下で見ることができます。

図3. 20分間のタイムフレームにおける、マルチシンボルATRインジケーター
「本当の」バーのはじめが、垂直の線にてマークされています。 NZDUSDにおけるバーが2000年(MEtaQuotes-Demoサーバー)から開始し、一方その他の現在の通貨ペアにおけるバーは1999年はじめに現れていることを以下のスクリーンショットが示しています。このため、一つの線のみ表示されています。期間の区切りが1999年以前小さいインターバルであり、もしバーの時間を分析すると、これらが日ごとのバーであることがわかると思います。
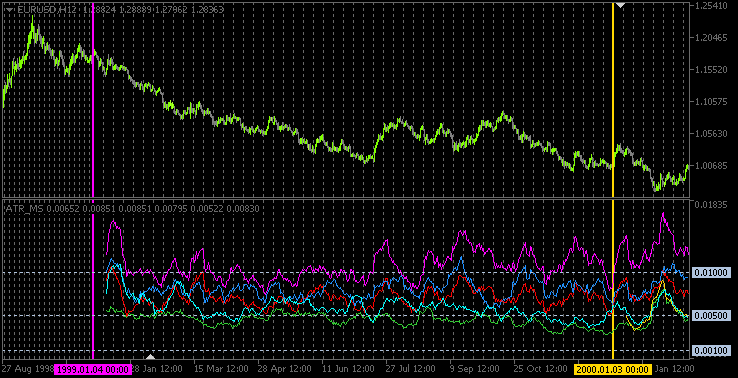
図4. 垂直線がそれぞれのシンボルごとのバーの初めをマークしています。
結論
ここでこの記事を終わりにしたいと思います。紹介したソースコードは記事に添付されており、ダウンロードできます。今後の記事にて、ボラティリティを分析するトレーディングシステムを実装したいと思います。
MetaQuotes Ltdによってロシア語から翻訳されました。
元の記事: https://www.mql5.com/ru/articles/752
警告: これらの資料についてのすべての権利はMetaQuotes Ltd.が保有しています。これらの資料の全部または一部の複製や再プリントは禁じられています。
この記事はサイトのユーザーによって執筆されたものであり、著者の個人的な見解を反映しています。MetaQuotes Ltdは、提示された情報の正確性や、記載されているソリューション、戦略、または推奨事項の使用によって生じたいかなる結果についても責任を負いません。

 マルチ通貨システム エキスパートアドバイザーの作成
- 無料取引アプリ
- 8千を超えるシグナルをコピー
- 金融ニュースで金融マーケットを探索
素晴らしい、しかし、私はshiftbarsが手動で設定され、インジケータがPRICE_CLOSEで計算するように変更された後でも、テスターとリアルでこの画像を持っている、あなたの下:
私は最近MTを使用していて1つネガティブなことがあります。それは、マルチシステムで標準インジケータを使用する際の不具合です。私は、これが曲がった手のせいではないことを理解するのにあまりにも多くの時間を費やしてきました。最新のアップデートでは、ますます悪化している。おそらくマスターたちは、自暴自棄になった愚か者たちが、この奇跡に2、3のマシュカを使い、何もすることがないところから合併することを期待しているのだろう。
でも、シフトバーが手動で設定された後でも、テスターにこの画像がある:
...
最近MTを使用していて一つマイナスなことがあります。それは、マルチシステムで標準インジケータを使用する際の不具合です。最新のアップデートで、それはますます悪化しています。おそらく、マスターたちは、バカが何もすることがないところから合併するために、必死になってこの奇跡に2、3のマシュカを使うという事実を当てにしているのだろう。
私はこのインジケーターをテスターで テストしたことすらない。テスターには不必要なものがたくさんある。記事にも何も書かれていない。
他のシンボルやタイムフレームからテスターでインジケーターを使用する際、Expert Advisorからデータを取得するのであれば、特に問題はないと思います。
それを把握することが必要です。私はまだ答えを持っていません。
...ボラティリティ ...真のバー ...
...それは(いくつかのキーバーによって)異なるTFからボラティリティの測定値(ATR)についてです - 現在のTF(?)
そして、"True bars "の下には、おそらく(私の理解が正しければ)、異なるTFのオープニング・バーを意味します(?
例えば: TF m15のTrue Bar、オープニング・タイムxx:15分、xx:30分(?)