SmartTrader Drawdown Tracker

SmartTrader Drawdown Tracker

Know How Far Your Account Has Fallen From Its High-Water Mark.

Most traders watch their account balance.

But balance alone does not always tell you how much ground your account has lost from its previous peak.

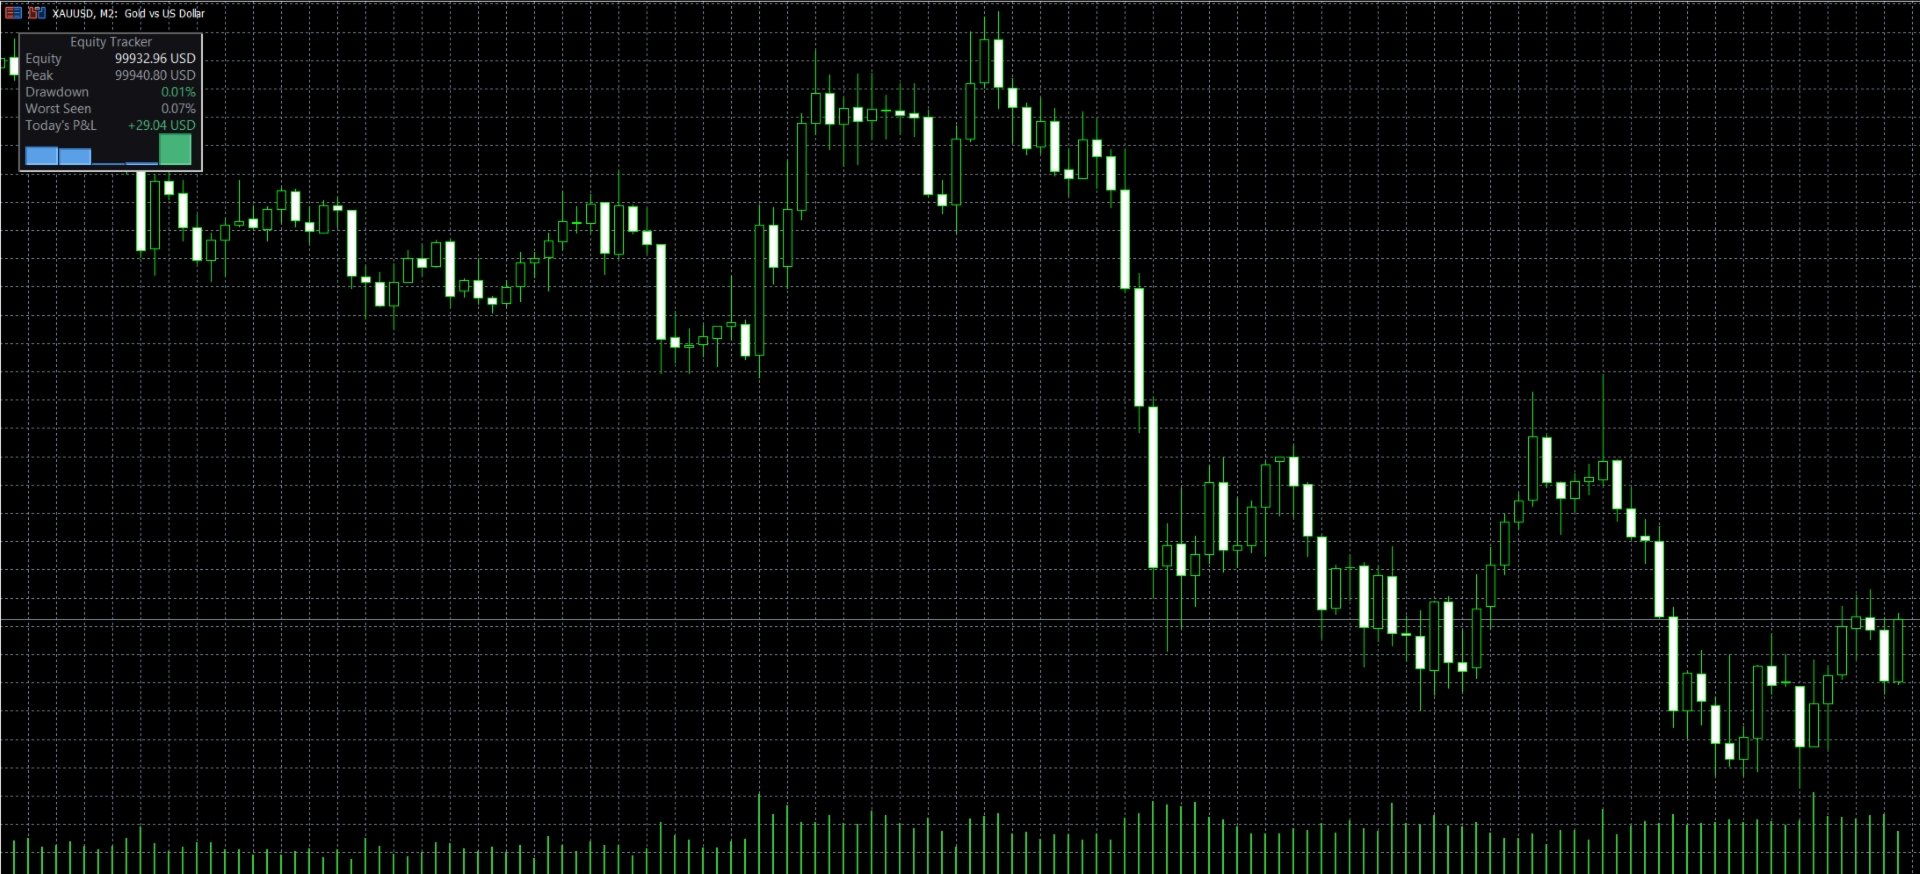
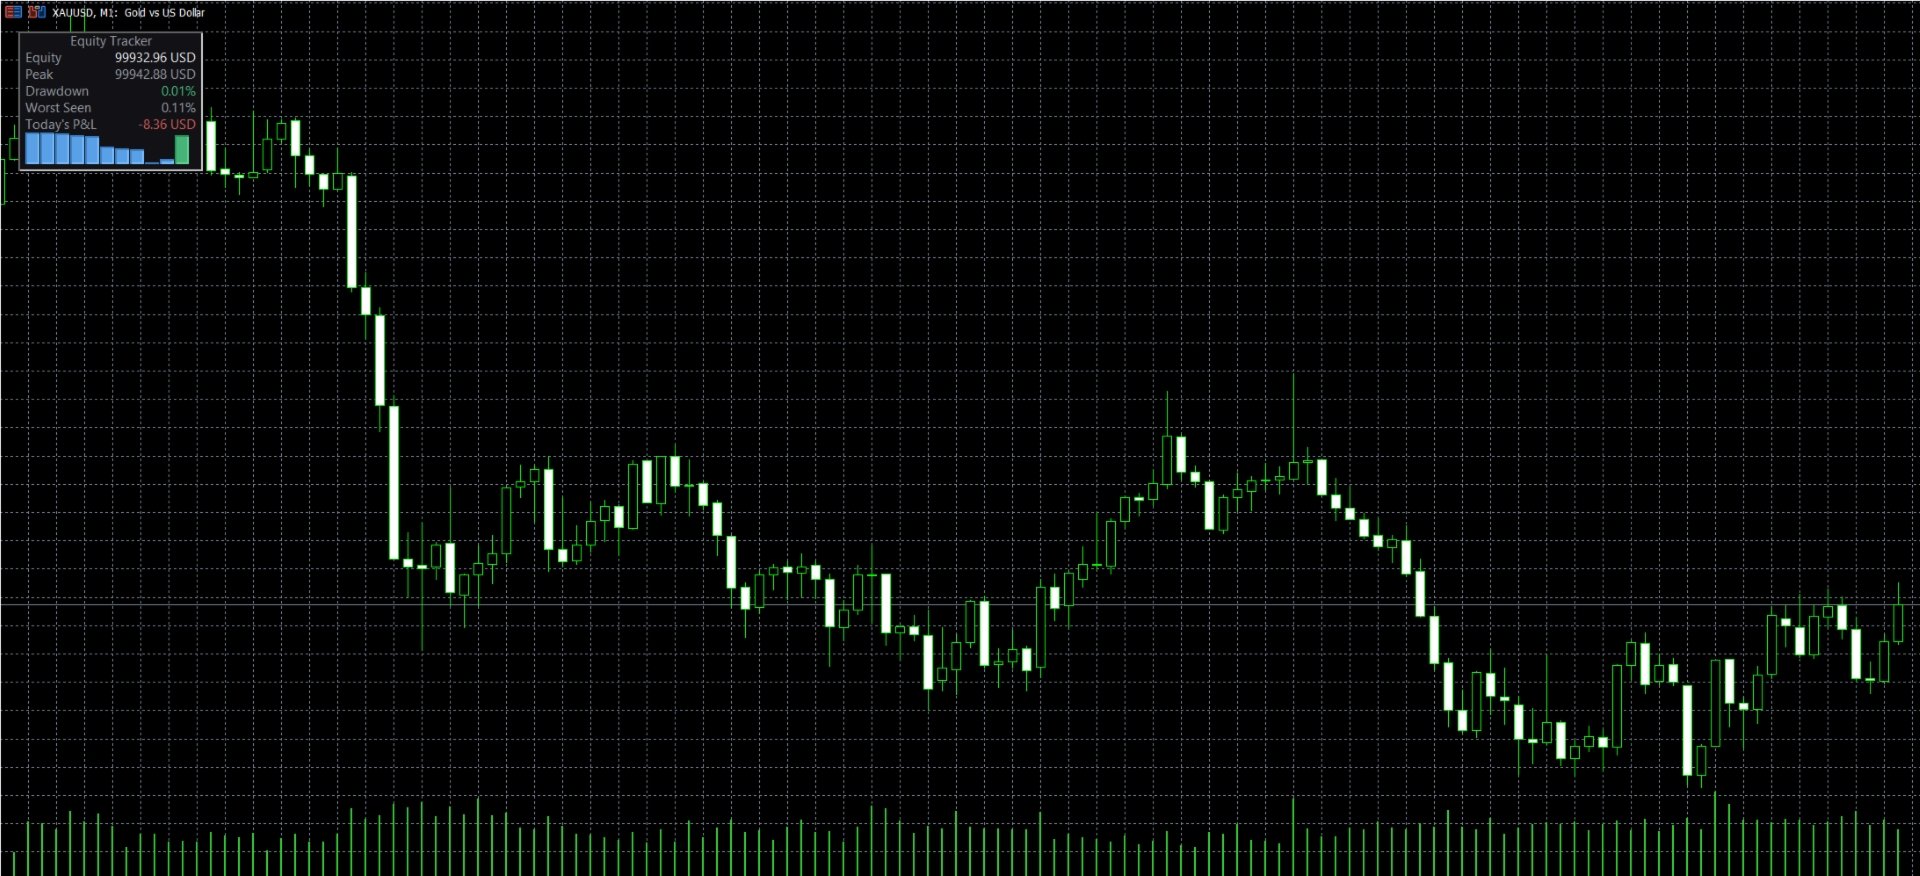
SmartTrader Drawdown Tracker monitors your account's high-water mark and shows your current drawdown in real time.

It helps you answer a simple but important question:

How far am I currently from my best account equity or balance?

What the Tracker Shows

Current Equity or Balance

Choose whether you want to monitor:

  • Current Equity
  • Current Balance

Use the measurement that best fits your trading and risk-management process.

High-Water Mark

The tracker records the highest equity or balance reached since tracking began.

This becomes your current high-water mark for drawdown monitoring.

Current Drawdown

See the current percentage distance from your high-water mark.

The drawdown status is color-coded according to configurable thresholds, helping you quickly identify different levels of account stress.

Worst Drawdown Seen

Current drawdown is only part of the picture.

The tracker also records the maximum drawdown reached since tracking started.

This allows you to review how severe the worst drawdown period became, even after the account begins recovering.

Today's P&L

Monitor the current day's profit or loss.

The daily result resets automatically at the day rollover.

Mini Equity Curve

View a live mini equity curve showing the development of your tracked account value over time.

The sampling interval can be configured according to your preferred monitoring frequency.

Why Drawdown Matters

A loss from your account's high-water mark is not always easy to understand by looking only at the current balance.

For example, an account that has fallen significantly from its previous peak may require a much larger percentage gain to recover the lost ground.

Tracking drawdown helps you understand the current condition of your account in relation to its own previous performance.

Profit tells you where you are. Drawdown tells you how far you have fallen from where you were.

How to Use SmartTrader Drawdown Tracker

  1. Attach the indicator to any MetaTrader 5 chart.
  2. Choose whether to monitor Equity or Balance.
  3. Configure your preferred drawdown thresholds.
  4. Monitor your current drawdown in real time.
  5. Review the worst drawdown recorded since tracking began.
  6. Use the information as part of your broader risk-management process.

Monitor your account. Recognize drawdown early. Make better risk decisions.

What This Product Is — and Is Not

It is:

  • An account drawdown monitoring tool
  • A high-water-mark tracker
  • A current drawdown monitor
  • A worst-drawdown tracker
  • A daily P&L monitor
  • A lightweight equity-curve display

It is not:

  • An Expert Advisor
  • An automated trading system
  • A trading signal generator
  • A profitability system
  • A guarantee against trading losses

SmartTrader Drawdown Tracker monitors your account. It does not place, modify, or close trades.

Validated Drawdown Measurement

The peak-tracking and drawdown-percentage calculation used by this indicator is based on the same drawdown measurement methodology used in the SmartTrader AI Pro risk-management system.

The calculation is designed to measure the percentage distance between the current tracked account value and the recorded high-water mark.

The purpose of this tool is to make that measurement available as a dedicated monitoring tool for any MetaTrader 5 account, symbol, or trading strategy.

This indicator does not claim that monitoring drawdown prevents losses or guarantees improved trading results.

Configuration

Tracking Mode

Choose whether the tracker monitors:

  • Account Equity
  • Account Balance

Drawdown Thresholds

Configure the drawdown levels used for the visual status indication.

The color-coded status helps you quickly identify when the current drawdown reaches your chosen monitoring thresholds.

Equity Curve Sampling

Configure the interval used to sample account values for the mini equity curve.

A shorter interval provides more frequent updates, while a longer interval creates a more lightweight tracking history.

Panel Display

Configure the position and visual presentation of the on-chart monitoring panel.

These settings affect the display only and do not change the drawdown calculation.

Important About Tracking History

The high-water mark and worst drawdown are measured from the time the tracker begins recording the selected account value.

If the indicator is removed, reset, or its tracking data is otherwise cleared, the tracking history may begin again from a new starting point.

For accurate long-term monitoring, allow the tracker to maintain its tracking data continuously.

Requirements

  • MetaTrader 5
  • Any trading symbol
  • Available account equity or balance data

The indicator monitors account-level information and is not limited to a specific trading symbol or strategy.

Transparency First

Drawdown monitoring does not eliminate trading risk.

It does not predict future losses, prevent losing trades, or guarantee that an account will recover from a drawdown.

It simply provides a clearer view of the account's current distance from its own high-water mark.

Understand your current drawdown. Remember your worst drawdown. Manage your trading risk with better information.
Рекомендуем также
MA Flow No.2 See the Flow of Bulls & Bears at a Glance, and Keep the Rhythm of the Market in Your Hands Tired of staring at dozens of moving averages until your eyes blur? Unsure when to enter, or where to place your stop? MA Flow No.2 upgrades the humble moving average into a complete trend-trading system. No more scattered lines on your chart — instead, a living "river of bulls and bears". Up to 100 moving averages roll together in real time. On every single bar, you can see at a glance w
Divergence Matrix Pro for MetaTrader 5 Divergence Matrix Pro is a confirmed multi-oscillator divergence indicator for MetaTrader 5. It detects regular and hidden divergence between price and selected oscillators, then presents the confirmed structure through divergence lines, pivot labels, action markers, an optional current-timeframe Matrix Panel and optional alerts. The indicator is an analysis and confirmation tool. It does not open or close trades, and the signal score is not a win rate or a
Индикатор Ichimoku Kinko Hyo, предназначенный для торговли по тренду, успешно используется практически на всех рынках. Данный индикатор уникален во многих отношениях, однако его главное преимущество заключается в предоставлении трейдерам множества ориентиров, позволяющих составить более глубокое и полное представление о движении цены. Эта глубина анализа и исключительная наглядность индикатора позволяет трейдерам быстро увидеть торговые возможности и выделить среди них наиболее перспективные. Пр
Price Alerts Advanced Suite for MetaTrader 5 Take control of your trading execution with the Price Alerts Advanced Suite , a professional-grade technical analysis tool built exclusively for MetaTrader 5. This suite goes far beyond simple horizontal lines; it is a complete analytical ecosystem designed to identify key market levels, monitor price action in real-time, and deliver instant notifications across multiple channels. Whether you are a day trader, swing trader, or algorithmic develope
Size Bars – индикатор отображает на графике максимальный, минимальный, текущий и средний размер баров (свечей) за выбранный период. Отображаемые параметры индикатора Size Bars: 1)       Текущий размер бара в писах (по максимум/минимум, тело бара). 2)       Максимальный, минимальный и средний размер свечей BUY . 3)       Максимальный, минимальный, средний размер свечей SELL . 4)       Количество свечей BUY и количество свечей SELL . 5)       Среднее количество свечей подряд BUY и SELL . 6)     
Volumatic VIDYA [RaysFX]   è un indicatore tecnico avanzato per MetaTrader 5 progettato per identificare con precisione la direzione del trend, la volatilità del mercato e le aree chiave di liquidità istituzionale basate sui volumi. L'indicatore si basa sul celebre algoritmo   VIDYA   ( Variable Index Dynamic Average ), una media mobile esponenziale dinamica che adatta automaticamente il proprio fattore di smoothing alla volatilità corrente del mercato calcolata tramite il CMO ( Chande Momentum
Индикатор Crypto_Forex "WPR с 2 скользящими средними" для MT5, без перерисовки. - Сам по себе WPR является одним из лучших осцилляторов для скальпинга. - Индикатор "WPR и 2 скользящие средние" позволяет видеть быстрые и медленные скользящие средние осциллятора WPR. - Индикатор дает возможность увидеть коррекцию цены на очень ранней стадии. - Этот индикатор очень легко настроить через параметры, его можно использовать на любом таймфрейме. - Условия входа на покупку и продажу показаны на изображ
Order Blocks and Fair Value Gaps marks the two most-used Smart Money zones on your chart automatically, so you can see at a glance where price may react. What it draws Bullish and bearish order blocks: the last opposite candle before a strong impulse candle (body larger than a set multiple of ATR) that closes beyond that candle's range. Bullish and bearish fair value gaps (FVG): the three-candle imbalance, the gap between the first and third candle, with a minimum size in ATR to filter noise. Ev
FREE
Индикатор Kijun-Sen Envelope   – это мощный трендовый инструмент, основанный на линии   Kijun-Sen   из системы Ichimoku Kinko Hyo. Он создает динамические верхние и нижние границы вокруг Kijun-Sen, формируя конверт, который помогает трейдерам выявлять тренды, потенциальные развороты и перекупленность/перепроданность рынка. Основные функции: •   Подтверждение тренда   – помогает определить силу и направление тренда. •   Зоны поддержки и сопротивления   – конверт служит динамическими уровнями дл
FREE
Complete SMC/ICT Indicator MT5 — Smart Money Concepts Tool  Complete SMC/ICT Indicator — это автономный инструмент анализа Smart Money Concepts, который работает непосредственно в окне графика. Он обеспечивает институциональный уровень обнаружения рыночных структур, дисбалансов и зон ликвидности, с полной настройкой и системой оповещений.   Функции   Индикатор определяет десять основных элементов SMC: swing‑high и swing‑low, fair value gaps, order blocks, пробои структуры, изменения характера,
TCT BB PANEL - Bollinger Bands Dashboard MASTER VOLATILITY WITH BOLLINGER BANDS The TCT BB PANEL monitors Bollinger Bands, identifying volatility squeezes and price extremes. WHAT YOUR DASHBOARD DISPLAYS Account: Balance, Equity, Profit, Drawdown Positions: Buys, Sells, Total BB: Upper, Middle, and Lower Bands Milestones: Detection, Last Touched, Next
SlopeChannelB – инструмент технического анализа, который строит наклонный канал движения цены, предоставляя уникальные возможности для оценки текущего состояния рынка и поиска торговых сигналов. Основные особенности индикатора: Наклонный канал движения цены : Индикатор помогает визуализировать уровни поддержки и сопротивления, которые могут указывать на возможные точки разворота или продолжения тренда. Различные цвета линий и фоновое выделение : Наклонные уровни поддержки и сопротивления от
Heiken_Ashi_Bars - Усовершенствованный визуализатор тренда для MT5 Обзор Heiken_Ashi_Bars — это мощный, визуально интуитивный пользовательский индикатор, разработанный для фильтрации рыночного шума и выделения истинного базового тренда. Традиционные свечные графики часто бывают хаотичными, что приводит к ложным сигналам и преждевременным выходам. Усредняя ценовые данные, этот индикатор сглаживает движение цены, что значительно облегчает обнаружение продолжения тренда, разворотов и прибыльных зо
RED ZONE Monitor Loss-Cut & Break-Even Risk Monitor for Averaging Traders (MT5) RED ZONE Monitor is a risk management indicator for traders who use averaging, scaling-in, or multiple open positions . It visually displays: The loss-cut (liquidation) risk zone The break-even price Based on current open positions, lots, and margin conditions This indicator does not provide entry signals. It does not promise profits. It shows where your account actually fails if price moves against you. What RED ZO
Что такое CCI FIXED DUAL CCI FIXED DUAL это профессиональный Trend Direction Filter, разработанный для точного определения: доминирующего направления рынка структурного качества движения согласованности между основным трендом и фазами ускорения Это не индикатор прямого входа. Это не классический осциллятор. Это инструмент контекста, созданный для того, чтобы помочь трейдеру решать, когда торговать, а когда НЕ торговать, резко снижая рыночный шум и ошибки интерпретации. Базовая философия CCI FIXE
Индикатор определяет и отображает на графике паттерн М. Гартли "Бабочка". Выделение паттерна производится по вершинам индикатора ZigZag (включен в ресурсы, не требует допопнительной установки). В момент распознавания паттерна выводится сообщение во всплывающем окне, отправляются оповещения на мобильное устройство и электронный почтовый ящик. Схема паттерна и параметры волн приведены на скриншоте. Параметры, заданные в индикаторе по умолчанию, являются демонстрационными для увеличения количества
Quantum Trade Signals — Advanced Trading Indicator All-in-One Professional Trading Indicator! Quantum Trade Signals combines multiple trading strategies, Smart Money Concepts (SMC), and advanced technical analysis to identify potential trading opportunities. Key Features: Advanced BUY & SELL Signals Intelligent Signal Scoring System Multiple Trading Strategies BOS, CHoCH & Liquidity Sweeps Trend & Market Structure Analysis Breakout & Retest Detection Suggested Stop Loss & Ta
Meridia Session Suite собирает в одной аккуратной панели на графике инструменты, которые сессионный трейдер использует каждый день. Каждый инструмент включается и выключается одним щелчком, а панель запоминает ваш выбор. Свечи старших таймфреймов Свечи M15, M30, H1, H4, D1 и W1 рисуются прямо на текущем графике, до 500 на каждый таймфрейм. Текущая свеча H1 показывает обратный отсчёт до закрытия. При открытии новой свечи самая старая удаляется, поэтому график остаётся лёгким. Торговые сессии с ав
Elite Harmony Signals Pro Panoramica Elite Harmony Signals è un indicatore sofisticato di analisi tecnica che visualizza rettangoli dinamici che forniscono zone di trading chiare e segnali di conferma per decisioni migliorate. Caratteristiche Principali Zone Rettangolo Dinamiche Estensione in Tempo Reale : I rettangoli si estendono automaticamente all'azione corrente del prezzo Chiusura Intelligente : I rettangoli si chiudono solo quando appaiono segnali opposti Conferma Visiva : Zone di trading
SPIKE DETECTOR RADAR ALERT – Surgical Precision in Explosive Market Movements Master market spikes with early alerts and high probability accuracy. Spike Detector Radar Alert is an advanced indicator for MetaTrader 5, developed to identify sudden price movements (spikes) in advance with enhanced precision. By combining volatility analysis, momentum strength, and price acceleration, the algorithm delivers clear signals at key market moments. Why traders choose Spike Detector Radar Alert: Mul
TheRealPrice v3.0 | Ultimate Spread & Ask Visualizer TheRealPrice is a high-precision utility for MetaTrader 5 designed to expose the hidden cost of every trade: The Spread . While standard charts only display the Bid price, professional traders know that buy orders and short-exits happen at the Ask price. TheRealPrice bridges this gap by drawing a dynamic, real-time horizontal line that tracks the exact Ask level, providing a clear visual representation of the current market spread. Why do you
Non-Repainting. Non-Redrawing. Non-Lagging. Signals appear only on confirmed bars. What you see on history is exactly what appeared in real time. Built specifically for Gold (XAUUSD) traders. Gold ML Supertrend MT5 is the only Supertrend indicator on MQL5 that learns. Instead of using a fixed multiplier, it runs a K-means clustering algorithm on recent price data to find the optimal band width. Then it adapts that width per trading session (Asia/London/NY) based on what actually worked. The resu
Gino Renko
Stephane, Andr Valette
1 (1)
Another renko-based indicator. It returns different usable values ​​for an EA, and is directly displayed on the main chart. Its setting is very simple: The size of the renko The number of bars taken into account The falling color The color on the rise Returned values: Buffer 0 : Value of the middle Buffer 1 : Value of the Top Buffer 2 : Value of the Bottom Buffer 3 : Direction of renko (0.0 for top ; 1.0 for bottom) Buffer 4 : Ratio of the renko, for example, if it is twice, 3 times, ro more of
HTF Filtered Momentum Band is a trend indicator with three layers that each answer one question. The background says which way the H4 trend points. The band says whether momentum on your own chart agrees. The arrows say when a short-term trend has just turned. And out of the box, the arrows stay quiet whenever they disagree with H4. That last part is why it exists. Most multi-timeframe tools paint the higher timeframe's colour on your chart and then print arrows that ignore it completely. So you
HAS RSI Signal — Профессиональный трендовый индикатор с расчетом SL/TP HAS RSI Signal — это мощный торговый инструмент, объединяющий проверенную классику и современные алгоритмы фильтрации шума. Индикатор анализирует рынок через призму сглаженных свечей Heiken Ashi и осциллятора RSI, предоставляя трейдеру четкие сигналы на вход в моменты разворота тренда или выхода из зон перекупленности/перепроданности. Основные преимущества: Двойная фильтрация: Использование Heiken Ashi Smoothed позволяет искл
The   Trendlines Oscillator   helps traders identify trends and momentum based on the normalized distances between the current price and the most recently detected bullish and bearish trend lines. The indicator features bullish and bearish momentum, a signal line with crossings, and multiple smoothing options. USAGE The   Trendlines Oscillator   works by systematically: Identifying pivot highs and lows. Connecting pivots to form bullish (support) and bearish (resistance) trendlines. Measuring
Основная информация. Для выполнения своей работы индикатор берет данные об объемах с младшего таймфрейма, строит Профили Рынка для старшего и гистограмму для текущего таймфреймов. Старт индикатора происходит в несколько этапов. При этом в лог выводятся сообщения вида: "Build Source & Target TF. Step: …" . Процесс можно ускорить, изменяя входной параметр Milliseconds between steps - скорость инициализации. Конечное значение этого параметра всегда индивидуально и устанавливается трейдером. Индикат
Swing Failure Pattern MT5 Systematic Structural Reversal and Liquidity Sweep Identification Engine The Swing Failure Pattern indicator for MetaTrader 5 provides an objective analytical framework designed to identify high-probability structural reversals resulting from liquidity sweeps. Intraday traders frequently enter breakout positions as price reaches a new swing extreme, only for the market to fail acceptance and abruptly reverse, triggering stop losses on false expansions. This software alg
Antabod Multiplier
Rev Anthony Olusegun Aboderin
Antabod Multiplier , the ultimate trading indicator designed to simplify your decision-making process and maximize your trading potential. Built with a robust combination of moving averages and stochastic oscillators, this tool provides clear, actionable signals for both buy and sell opportunities. The Antabod Multiplier stands out with its dynamic trend detection and precision filtering, giving you real-time visual signals to catch trend reversals and optimal entry/exit points with ease. Whethe
С этим продуктом покупают
Trend Sniper X
Sarvarbek Abduvoxobov
4.86 (42)
Trend Sniper X — это трендовый индикатор для MetaTrader 5, работающий на нескольких таймфреймах, который помогает трейдерам точно и ясно определять направление тренда и потенциальные точки разворота. для MT4: https://www.mql5.com/en/market/product/193245 Информация о цене: Текущая цена является промо-ценой и может измениться по мере выхода предстоящих обновлений и новых функций. Бонусное предложение: Чтобы получить БЕСПЛАТНЫЙ авто-трейд советник Assistant EA для этого индикатора, пожалуйста, на
Smart Trend Trading System — MetaTrader 5 После покупки напишите мне на MQL5, чтобы БЕСПЛАТНО получить Smart Universal Expert Advisor, а также доступ к онлайн-курсу, руководство в формате PDF и доступ к закрытой группе. STTS объединяет направление тренда, сигналы входа и выхода, зоны разворота и важные ценовые уровни прямо на графике. Торгуйте по системе вручную или подключите отдельный совместимый советник для автоматического исполнения с выбранными вами настройками. ОДНА СИСТЕМА. ЧЕТЫРЕ ТОРГОВ
Zoryk Gold
Reda El Koutbane
4.78 (18)
Скидка заканчивается через 24 часа — следующая цена $ 69 ZORYK — продвинутая сигнальная система для XAUUSD в MetaTrader 5 Вам знакомо это чувство. Вы долго анализируете золото. Ждёте подходящего момента для входа. Наконец открываете сделку — и цена сразу начинает двигаться против вас. Вы закрываете позицию слишком рано, передвигаете Stop Loss или сомневаетесь всего несколько секунд. После этого рынок достигает именно той цели, которую вы ожидали изначально, но уже без вас. Проблема не всегда за
SuperScalp Pro
Van Minh Nguyen
4.56 (36)
SuperScalp Pro - Professional Multi-Layer Confluence Scalping System SuperScalp Pro — это продвинутый индикатор для скальпинга, который улучшает классический Supertrend с помощью нескольких интеллектуальных фильтров подтверждения. Он помогает определять торговые возможности Buy/Sell с более высокой вероятностью, значительно сокращая количество ложных сигналов. Чёткие стрелки Buy и Sell отображаются непосредственно на графике, а уровни Stop Loss и Take Profit на основе ATR автоматически рассчитыв
Получите своё торговое преимущество в поле зрения! M5 Sniper — это новый индикатор от MeanFX. Он сочетает точные торговые сигналы с адаптивными уровнями TP/SL — в результате создавая лучшие возможные статистические сделки! Цена увеличивается каждые 5 покупок, следующая цена — 69$ Напишите мне после покупки, чтобы получить советы/руководство и бонусного EA Что выделяет его среди других? Проверенная статистическая эффективность на Gold XAUUSD ( работает практически на каждом активе , с акцентом н
Новый король в городе — Индикатор + управление ордерами (TP1 + TP2 + TP3) + опциональный Telegram-сигнал-сендер ВКЛЮЧЁН (БЕСПЛАТНО) (ПОЛНОЦЕННАЯ ТОРГОВАЯ И СИГНАЛЬНАЯ СИСТЕМА) Gold Slayer EA Этот индикатор включает в себя продвинутую стратегию, торговую систему с настраиваемым управлением ордерами и систему mean reversion, которая сочетает расширения Envelope и поддерживается несколькими интеллектуальными фильтрами подтверждения, такими как RSI, для поиска высоковероятных точек разворота с сигн
SMC Intraday Formula
VividMind Digital Solutions
5 (26)
Давайте сначала будем честны. Ни один индикатор сам по себе не сделает вас прибыльным. Если кто-то говорит вам обратное — он продаёт вам мечту. Любой индикатор, который показывает идеальные стрелки покупки/продажи, можно сделать безупречным — просто увеличьте нужный участок истории и сделайте скриншот успешных сделок. Мы так делать не будем. SMC Intraday Formula — это инструмент. Он считывает структуру рынка за вас, определяет зоны с наивысшей вероятностью движения цены и точно показывает, как
Boba Analysis Suite
Trade Ready Solutions LLC
5 (1)
Boba Analysis Suite Boba Analysis Suite — аналитический индикатор для MetaTrader 5. Он объединяет структуру рынка, значимые ценовые зоны и общий рыночный контекст в одном представлении на графике. Индикатор разработан на основе практического опыта трейдера и наставника по трейдингу. Он помогает выстроить последовательный процесс анализа: оценивать направление рынка, определять важные уровни и рассматривать несколько таймфреймов в совокупности. Анализ с учётом контекста Значение отдельных сигнало
Auto Optimized SpeedAngle — это система векторизации импульса институционального уровня, которая исключает подгонку под исторические данные (curve-fitting) за счет непрерывной форвард-оптимизации (Walk-Forward Optimization, WFO). Вместо того чтобы полагаться на статические входные параметры, которые теряют эффективность при смене рыночных режимов, индикатор динамически перекалибрует свои настройки, используя валидацию на вневыборочных данных (Out-of-Sample, OOS). Это гарантирует, что отображаемы
GoldenX Entry MT5
VividMind Digital Solutions
5 (17)
GoldenX Entry — это индикатор для MT5 с адаптивным алгоритмом Smart Entry Trend, системой оценки сигналов, детектором рыночных режимов и фильтром волатильности. Каждый сигнал включает рассчитанный уровень входа, три уровня Take-Profit (TP1, TP2, TP3) и уровень Stop-Loss. Он построен на нескольких аналитических слоях, предназначенных для адаптации к различным рыночным условиям, объединяя многоуровневую аналитическую систему со встроенным оптимизатором и системой статистического отслеживания. Инди
Entry Points Pro — топ-1 индикатор по количеству отзывов (600 отзывов и 31 000 скачиваний обеих версий). Индикатор даёт самые перспективные точки входа в сделки без перерисовки на любых инструментах. Индикатор покажет заранее стрелкой точку входа в сделку, укажет цену входа и нарисует на графике уровень входа и стопа, а так же рассчитает рабочий лот под твой депозит и риск, а панель статистики поможет выбрать самый перспективный инструмент и таймфрейм .  Тебе остаётся поставить отложенный ордер
ARIPoint
Temirlan Kdyrkhan
1 (4)
ARIBot is a powerful trading companion designed to generate high-probability entry signals with dynamic TP/SL/DP levels based on volatility. Built-in performance tracking shows win/loss stats, PP1/PP2 hits, and success rates — all updated live. Key Features: Buy/Sell signals with adaptive volatility bands Real-time TP/SL/DP levels based on ATR Built-in MA Filter with optional ATR/StdDev volatility Performance stats panel (Success, Profit/Loss, PP1/PP2) Alerts via popup, sound, push, or email Cus
Gann Made Easy   - это профессиональная, но при этом очень простая в применении Форекс система, основанная на лучших принципах торговли по методам господина У.Д. Ганна. Индикатор дает точные BUY/SELL сигналы, включающие в себя уровни Stop Loss и Take Profit. ПОЖАЛУЙСТА, СВЯЖИТЕСЬ СО МНОЙ ПОСЛЕ ПОКУПКИ, ЧТОБЫ ПОЛУЧИТЬ ТОРГОВЫЕ ИНСТРУКЦИИ И ОТЛИЧНЫЕ ДОПОЛНИТЕЛЬНЫЕ ИНДИКАТОРЫ БЕСПЛАТНО! Вероятно вы уже не раз слышали о торговли по методам Ганна. Как правило теория Ганна отпугивает от себя не только
M1 SNIPER   — это простая в использовании торговая система. Это стрелочный индикатор, разработанный для тайм фрейма M1. Индикатор можно использовать как отдельную систему для скальпинга на тайм фрейме M1, а также как часть вашей существующей торговой системы. Хотя эта торговая система была разработана специально для торговли на M1, ее можно использовать и с другими тайм фреймами. Первоначально я разработал этот метод для торговли XAUUSD и BTCUSD. Но я считаю этот метод полезным и для торговли на
Adaptive Price Action Engine Купи индикатор — получи советник (EA) к нему бесплатно Самооптимизирующийся мульти-таймфреймовый анализ тренда и свечных моделей Рынок постоянно меняется — и не каждая модель Price Action имеет одинаковую ценность в разных рыночных режимах. Adaptive Price Action Engine создан для адаптации к изменяющимся рыночным условиям, объединяя трендовую структуру, мульти-таймфреймовый анализ, свечные модели и статистическую оптимизацию в единой аналитической системе. Два адапти
FiboSniper Pro – Multi-Filter Fibonacci System with Auto SL/TP and Control Panel FiboSniper Pro — это технический индикатор, который объединяет динамические Fibonacci Envelopes с несколькими фильтрами подтверждения для формирования отборных сигналов Buy и Sell. Уровни Fibonacci рассчитываются на основе Moving Average и ATR, а затем фильтруются с помощью ADX, EMA, RSI, ATR, Volume, Time и структуры свечи. Индикатор отображает на графике автоматические уровни Stop Loss и Take Profit на основе ATR,
Break and Retest Hunter is a powerful MetaTrader 5 indicator designed to automatically identify support and resistance levels, breakout structures, and potential retest opportunities in real time. Bonus Indicator: After purchasing Break and Retest Hunter , contact me to receive Trade Indicator Assistant EA completely free as a bonus utility. $65 for the next 10 copies . Next price is $120.  Combining adaptive market analysis, clear BUY/SELL signals, Fibonacci-based profit targets, and a premiu
Neuro Poseidon - новый индикатор от Дарьи Резуевой. Он сочетает точные торговые сигналы с адаптивными уровнями TP/SL , в результате создавая максимально выгодные сделки! TO SWITCH TO   ENG   PLEASE CHOOSE IT IN THE UPPER-RIGHT CORNER OF THE WEBSITE Напишите мне и получите  Neuro Poseidon Assistant  в подарок для автоматизации вашей торговли! Что отличает его от других индикаторов? 1. Доказанная прибыльность на всех активах и таймфреймах 2. На графике присутствуют только подтвержденные сигналы н
Apex Patterns PRO Купите индикатор — получите Expert Advisor на его основе БЕСПЛАТНО. Самооптимизирующаяся система анализа графических паттернов и пробоев Традиционные сканеры паттернов полагаются на фиксированные входные параметры, что часто приводит к снижению их эффективности при изменении рыночной волатильности и структуры. Apex Patterns PRO разработан для адаптации к меняющимся рыночным условиям, объединяя распознавание структурных графических паттернов, фильтрацию по моментуму и статистич
Gold Trend Coach MT5
Cristhian Alexander Gaibor Cuasquer
5 (2)
Gold Trend Coach — трендовый индикатор по золоту (XAUUSD) для MetaTrader 5 с сигналами на покупку и продажу, стоп-лоссом и тремя целями тейк-профита, подтверждёнными на закрытии бара, мультитаймфреймовой панелью коуча и оповещениями на телефон и в Telegram. Создан для скальпинга на M5 и интрадея на M15 в лондонскую и нью-йоркскую сессии. Gold Trend Coach: трендовые сигналы по золоту XAUUSD с входом, стопом и тремя целями. Стартовая цена $39 за первые 20 копий, далее $59. Напишите мне после поку
Entry In The Zone and SMC Multi Timeframe is a real-time market analysis tool based on Smart Money Concepts (SMC), designed to analyze market structure, price direction, and key trading zones. It supports both Single-Timeframe and Multi-Timeframe Analysis, providing a clearer view of overall market structure across multiple timeframes, with real-time BUY / SELL signals designed with a strict focus on No-Repaint principles. The signals are designed to help filter unclear setups and evaluate tradi
Trend Catcher   анализирует движения рыночных цен, используя комбинацию собственных и индивидуально разработанных адаптивных индикаторов анализа тренда. Он определяет истинное направление рынка, отфильтровывая краткосрочные шумы и фокусируясь на силе импульса, расширении волатильности и поведении ценовой структуры. Он также использует комбинацию сглаживающих и фильтрующих тренд индикаторов, таких как скользящие средние, RSI и фильтры волатильности. Мониторинг реальных операций, а также другие
Unix Scalper — MetaTrader 5 После покупки напишите мне на MQL5, чтобы БЕСПЛАТНО получить Smart Universal Expert Advisor, а также доступ к онлайн-курсу, руководство в формате PDF и доступ к закрытой группе. Найдите торговую ситуацию. Оцените план. Выберите способ торговли. UNIX Scalper объединяет анализ рынка, решения BUY/SELL/WAIT и уровни Entry, Stop Loss, TP1 и TP2 в одной удобной панели. УВИДЬТЕ СИГНАЛ И ТОРГОВЫЙ ПЛАН • Понятные решения: BUY, SELL или WAIT. • Определённые уровни: Entry, Stop
FX Trend NG: Следующее поколение интеллектуального анализа трендов на разных рынках Обзор FX Trend NG — это профессиональный инструмент анализа трендов и мониторинга рынка с поддержкой нескольких таймфреймов. Он позволяет за секунды получить полное структурное понимание текущего состояния рынка. Вместо переключения между десятками графиков вы мгновенно видите, какие инструменты находятся в тренде, где импульс ослабевает и где наблюдается сильная синхронизация между таймфреймами. Специальное пр
Этот индикатор является уникальным, качественным и доступным инструментом для торговли, включающим в себя наши собственные разработки и новую формулу. В обновленной версии появилась возможность отображать зоны двух таймфреймов. Это означает, что вам будут доступны зоны не только на старшем ТФ, а сразу с двух таймфреймов - таймфрейма графика и старшего: отображение вложенных зон. Обновление обязательно понравится всем трейдерам, торгующим по зонам спроса и предложения. Важная информация Для макс
Smart Price Action Concepts — MetaTrader 5 После покупки напишите мне на MQL5, чтобы БЕСПЛАТНО получить Smart Universal Expert Advisor, а также доступ к онлайн-курсу, руководство в формате PDF и доступ к закрытой группе. Изучайте структуру. Определяйте зоны. Создавайте торговый план. Объедините Smart Money Concepts (SMC), анализ в стиле ICT и Price Action на одном упорядоченном графике. Определяйте структуру рынка, ордер-блоки, ориентиры ликвидности и дисбалансы, а затем выбирайте отображаемые э
Представляем       Quantum Breakout PRO   , новаторский индикатор MQL5, который меняет ваш способ торговли в зонах прорыва! Разработан командой опытных трейдеров со стажем торговли более 13 лет,       Квантовый прорыв PRO       разработан, чтобы поднять ваше торговое путешествие к новым высотам с его инновационной и динамичной стратегией зоны прорыва. Quantum Breakout Indicator покажет вам сигнальные стрелки на зонах прорыва с 5 целевыми зонами прибыли и предложением стоп-лосса на основе поля
Atomic Analyst — MetaTrader 5 После покупки напишите мне на MQL5, чтобы БЕСПЛАТНО получить Smart Universal Expert Advisor, а также доступ к онлайн-курсу, руководство в формате PDF и доступ к закрытой группе. Atomic Analyst объединяет анализ ценового движения, направление тренда, сигналы входа и выхода, уровни Stop Loss и несколько уровней Take Profit прямо на графике. УВИДЬТЕ СИГНАЛ. ОЦЕНИТЕ ТОРГОВУЮ СИТУАЦИЮ. Atomic Analyst представляет результаты анализа в понятном визуальном виде: • Стрелки п
Scalper Vault — это мощная, полноценная торговая система, созданная для трейдеров, которые стремятся к стабильным результатам в внутридневной торговле. Этот высокоточный индикатор представляет собой комплексное, самостоятельное торговое решение, обеспечивающее аналитику профессионального (институционального) уровня как для торговли на рынке Forex, так и для работы с бинарными опционами. Пожалуйста, свяжитесь со мной после покупки, чтобы получить мои торговые советы, а также отличный бонус! Исклю
SR Liquidity   — это торговый индикатор, предназначенный для выявления скрытых зон, где концентрируется рыночная ликвидность и наблюдается наиболее сильная реакция цены. Эти особые зоны ликвидности выступают в качестве мощных уровней поддержки и сопротивления, предоставляя вам четкую картину того, где с наибольшей вероятностью произойдет разворот рынка. Вместо построения стандартных линий поддержки и сопротивления, индикатор SR Liquidity анализирует реальное поведение цены, выявляя зоны концентр
Другие продукты этого автора
Session Clock is a small, free indicator that answers one question at a glance: what trading session is active right now, and how long until it changes? The panel shows: - The current session (Asian, London, London/NY Overlap, New York, or Sydney/Late), color-coded - A live countdown to the next session change - What the next session will be Optionally, it also draws labeled vertical lines directly on your chart at each session boundary - so you can see exactly where the Asian session ended a
FREE
SmartTrader MTF Trend Bias is a small, free indicator that answers one question: what's the trend doing across six timeframes at once? The panel shows: - Bullish / Bearish / Neutral for M1, M5, M15, M30, H1, and H4 - spelled out in full, color-coded, no symbols to decode - Hover any row for the exact reasoning (which EMAs, which direction) - Read only from each timeframe's last CLOSED bar, never the still-forming one - the most common cause of an MTF indicator "flipping its answer with no pric
FREE
SmartTrader Pip Value Display answers a question that trips up more traders than you'd expect: what is a pip actually worth, right now, on this symbol, at this lot size? Why the textbook answer is often wrong "$10 per pip on a standard lot" is a rule of thumb for a handful of major USD pairs - it is not a universal fact. Gold, indices, JPY pairs, and plenty of other symbols have real pip values that differ from that number, sometimes significantly, and it depends on your specific broker's contra
FREE
SmartTrader Volatility Monitor shows two things that matter before you take a trade: is the spread reasonable right now, and is volatility behaving normally? What it shows Spread - current spread in points, color-coded Good / Elevated / Wide against thresholds you set Volatility - current ATR compared to its recent average, shown as a ratio (e.g. "1.8x") and a state: Low, Normal, or High Why "Low" volatility gets flagged too, not just "High" Most volatility tools only warn about high volatility.
FREE
SmartTrader AI Pro Structured XAUUSD Market Analysis Based on Documented Historical Calibration Most technical indicators ask traders to trust unverifiable claims. SmartTrader AI Pro takes a different approach. The scoring weights and thresholds used by the indicator were calibrated against historical XAUUSD data using a documented and repeatable backtesting methodology. The results—including where the model demonstrated a measurable relationship with subsequent price movement and where it did n
SmartTrader Position Calculator Calculate Your Position Size Before You Place the Trade. Choosing a lot size by guesswork can make a small trading mistake much larger than expected. SmartTrader Position Calculator helps you calculate position size based on your account risk, Entry, Stop Loss, and Take Profit levels. Simply define your trade levels and see the estimated lot size, monetary risk, and risk-to-reward relationship directly on your MetaTrader 5 chart. What the Calculator Shows Risk-Bas
SmartTrader Watchlist Scanner Scan Multiple Markets. Find What Deserves Your Attention. Opening charts one by one can waste valuable time before your analysis even begins. SmartTrader Watchlist Scanner gives you a quick directional overview of multiple instruments from one panel. Instead of manually checking every chart, scan your selected watchlist and quickly identify markets showing stronger bullish, bearish, or neutral technical conditions. This is a market-discovery tool designed to help yo
SmartTrader Portfolio Risk Manager How Much Risk Is Your Entire Portfolio Really Carrying? Many traders analyze risk one position at a time. But five separate trades do not always mean five separate risks. If multiple positions are exposed to similar market movements, your portfolio may be carrying significantly more concentrated risk than it appears. SmartTrader Portfolio Risk Manager gives you a portfolio-level view of your open trading exposure directly inside MetaTrader 5. Understand Your To
Overview SmartTrader Pro Gold Trend and Reversal EA executes the SmartTrader AI Pro scoring model, with the option to place trades semi-automatically (a confirmation prompt by default) or fully automatically. It's built on one core principle: every claim below is something we actually tested, not something we're asking you to take on faith. Key Features Semi-automatic or fully automatic execution modes M1 Counter-Trend mode (primary, evidence-backed) and H1 Trend-Following mode (secondary) Long-
Фильтр:
Нет отзывов
Ответ на отзыв