SmartTrader Drawdown Tracker
- Indicadores
- Versão: 1.0
- Ativações: 5

SmartTrader Drawdown Tracker
Know How Far Your Account Has Fallen From Its High-Water Mark.
Most traders watch their account balance.
But balance alone does not always tell you how much ground your account has lost from its previous peak.
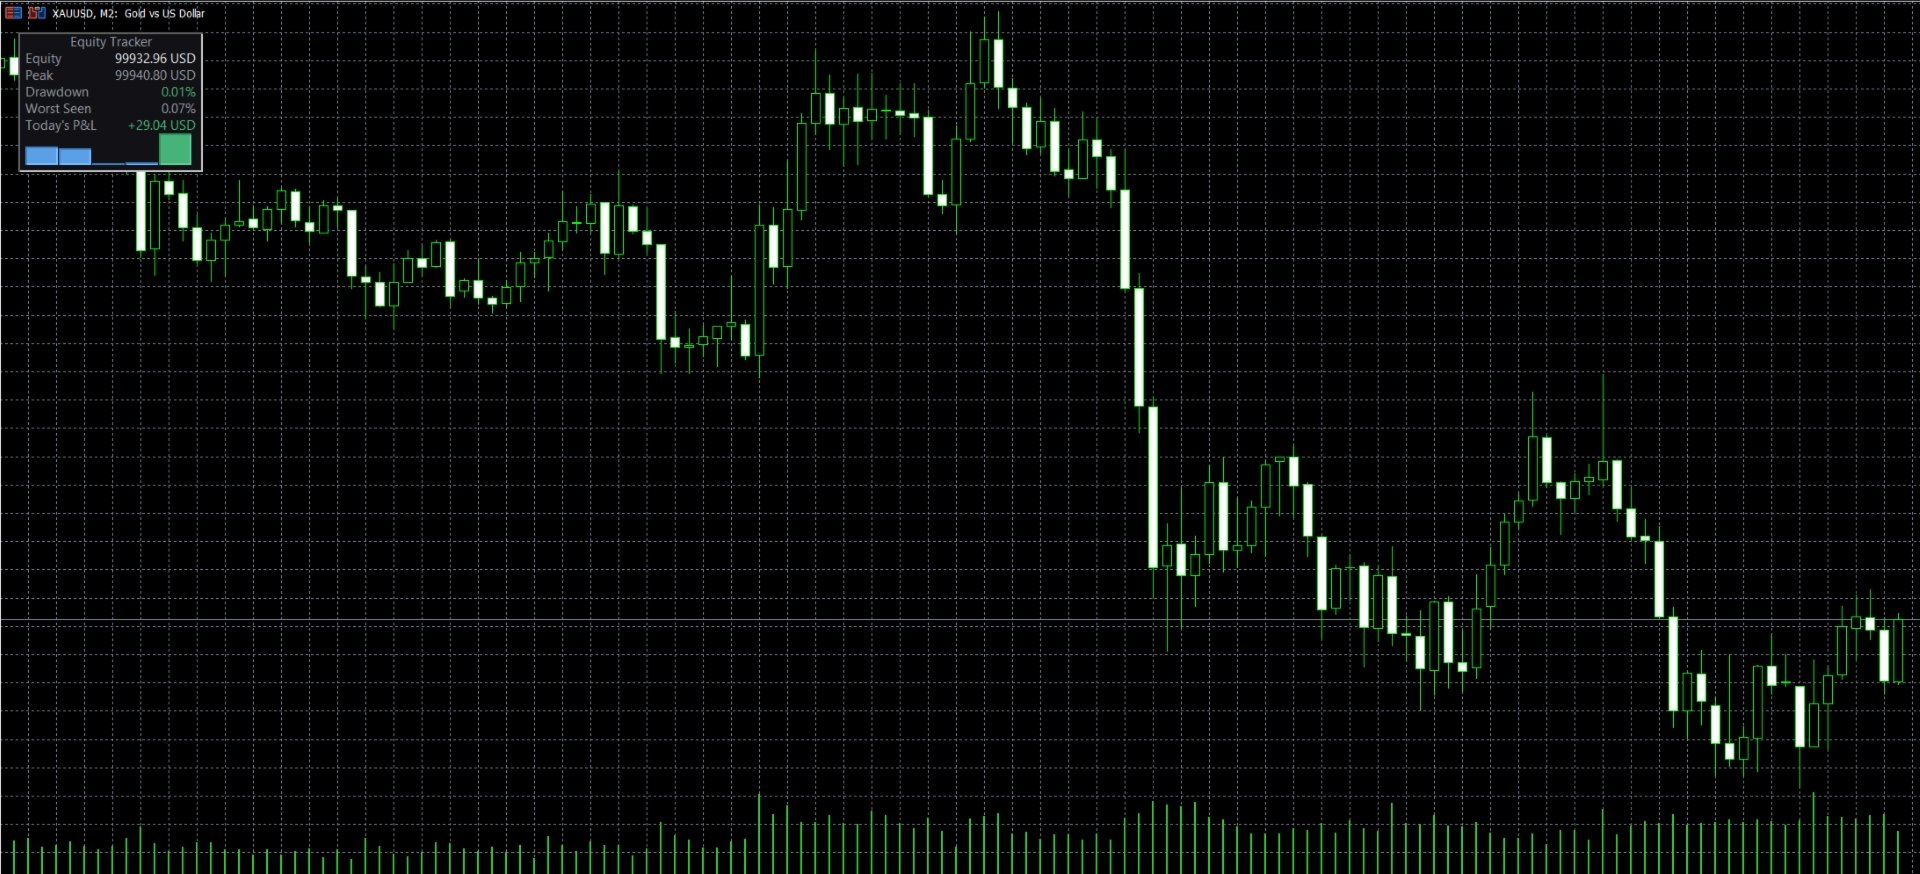
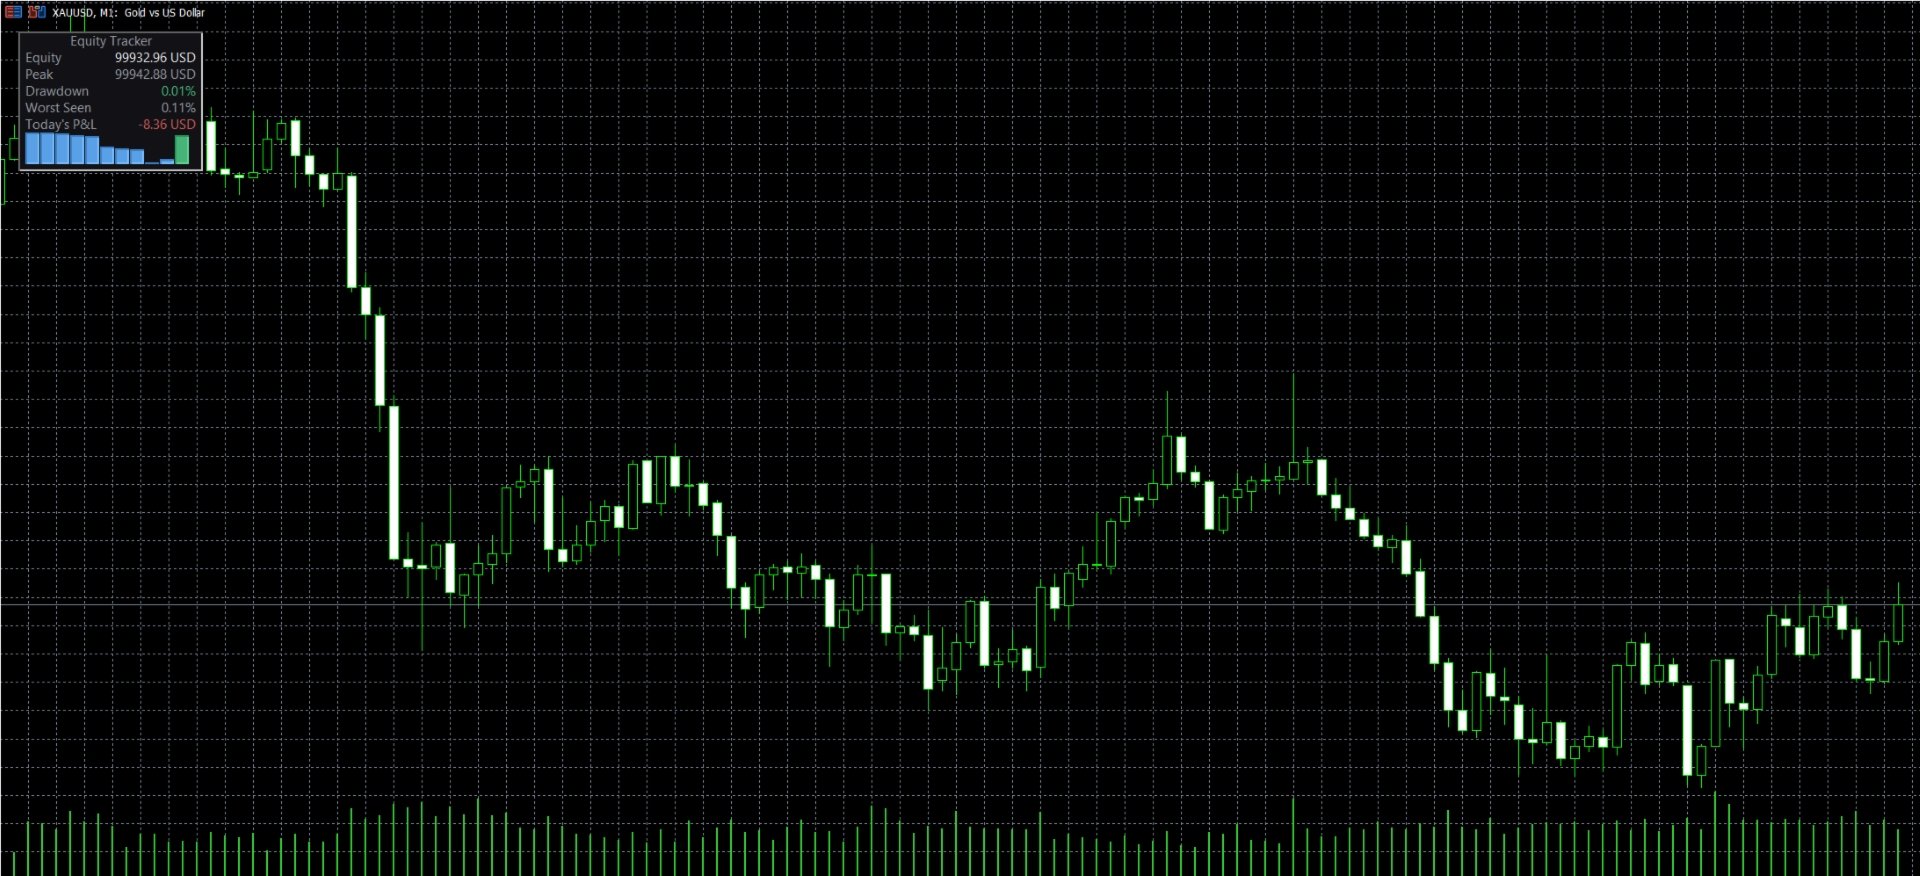
SmartTrader Drawdown Tracker monitors your account's high-water mark and shows your current drawdown in real time.
It helps you answer a simple but important question:
How far am I currently from my best account equity or balance?
What the Tracker Shows
Current Equity or Balance
Choose whether you want to monitor:
- Current Equity
- Current Balance
Use the measurement that best fits your trading and risk-management process.
High-Water Mark
The tracker records the highest equity or balance reached since tracking began.
This becomes your current high-water mark for drawdown monitoring.
Current Drawdown
See the current percentage distance from your high-water mark.
The drawdown status is color-coded according to configurable thresholds, helping you quickly identify different levels of account stress.
Worst Drawdown Seen
Current drawdown is only part of the picture.
The tracker also records the maximum drawdown reached since tracking started.
This allows you to review how severe the worst drawdown period became, even after the account begins recovering.
Today's P&L
Monitor the current day's profit or loss.
The daily result resets automatically at the day rollover.
Mini Equity Curve
View a live mini equity curve showing the development of your tracked account value over time.
The sampling interval can be configured according to your preferred monitoring frequency.
Why Drawdown Matters
A loss from your account's high-water mark is not always easy to understand by looking only at the current balance.
For example, an account that has fallen significantly from its previous peak may require a much larger percentage gain to recover the lost ground.
Tracking drawdown helps you understand the current condition of your account in relation to its own previous performance.
Profit tells you where you are. Drawdown tells you how far you have fallen from where you were.
How to Use SmartTrader Drawdown Tracker
- Attach the indicator to any MetaTrader 5 chart.
- Choose whether to monitor Equity or Balance.
- Configure your preferred drawdown thresholds.
- Monitor your current drawdown in real time.
- Review the worst drawdown recorded since tracking began.
- Use the information as part of your broader risk-management process.
Monitor your account. Recognize drawdown early. Make better risk decisions.
What This Product Is — and Is Not
It is:
- An account drawdown monitoring tool
- A high-water-mark tracker
- A current drawdown monitor
- A worst-drawdown tracker
- A daily P&L monitor
- A lightweight equity-curve display
It is not:
- An Expert Advisor
- An automated trading system
- A trading signal generator
- A profitability system
- A guarantee against trading losses
SmartTrader Drawdown Tracker monitors your account. It does not place, modify, or close trades.
Validated Drawdown Measurement
The peak-tracking and drawdown-percentage calculation used by this indicator is based on the same drawdown measurement methodology used in the SmartTrader AI Pro risk-management system.
The calculation is designed to measure the percentage distance between the current tracked account value and the recorded high-water mark.
The purpose of this tool is to make that measurement available as a dedicated monitoring tool for any MetaTrader 5 account, symbol, or trading strategy.
This indicator does not claim that monitoring drawdown prevents losses or guarantees improved trading results.
Configuration
Tracking Mode
Choose whether the tracker monitors:
- Account Equity
- Account Balance
Drawdown Thresholds
Configure the drawdown levels used for the visual status indication.
The color-coded status helps you quickly identify when the current drawdown reaches your chosen monitoring thresholds.
Equity Curve Sampling
Configure the interval used to sample account values for the mini equity curve.
A shorter interval provides more frequent updates, while a longer interval creates a more lightweight tracking history.
Panel Display
Configure the position and visual presentation of the on-chart monitoring panel.
These settings affect the display only and do not change the drawdown calculation.
Important About Tracking History
The high-water mark and worst drawdown are measured from the time the tracker begins recording the selected account value.
If the indicator is removed, reset, or its tracking data is otherwise cleared, the tracking history may begin again from a new starting point.
For accurate long-term monitoring, allow the tracker to maintain its tracking data continuously.
Requirements
- MetaTrader 5
- Any trading symbol
- Available account equity or balance data
The indicator monitors account-level information and is not limited to a specific trading symbol or strategy.
Transparency First
Drawdown monitoring does not eliminate trading risk.
It does not predict future losses, prevent losing trades, or guarantee that an account will recover from a drawdown.
It simply provides a clearer view of the account's current distance from its own high-water mark.
Understand your current drawdown. Remember your worst drawdown. Manage your trading risk with better information.