Gartley Projections D
- インディケータ
- バージョン: 3.55
- アップデート済み: 8 12月 2025
- アクティベーション: 20

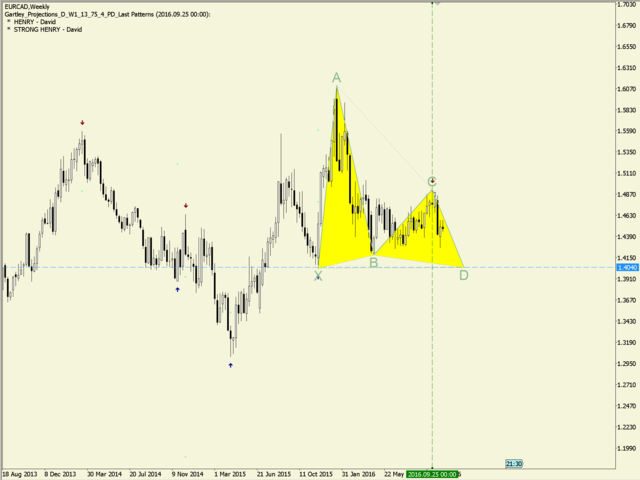
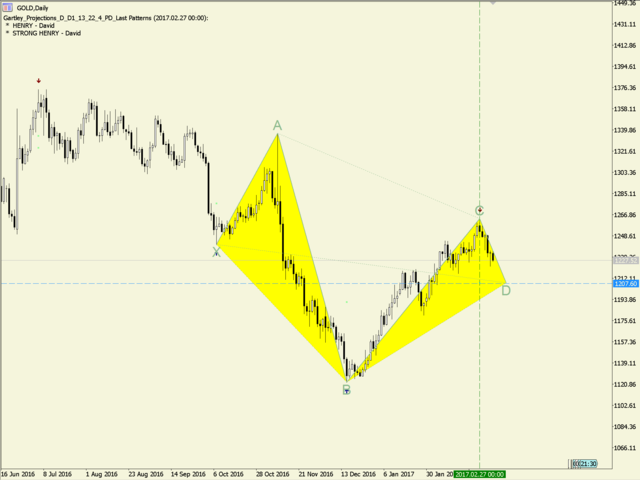
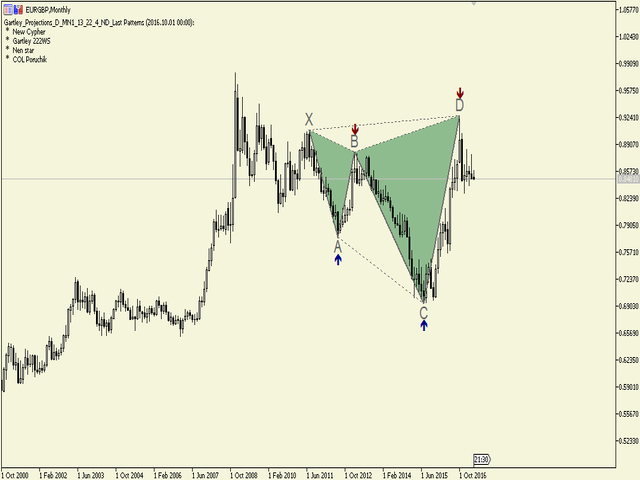
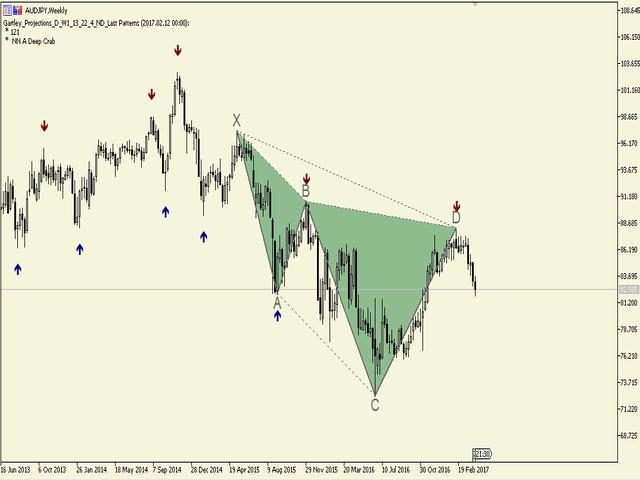
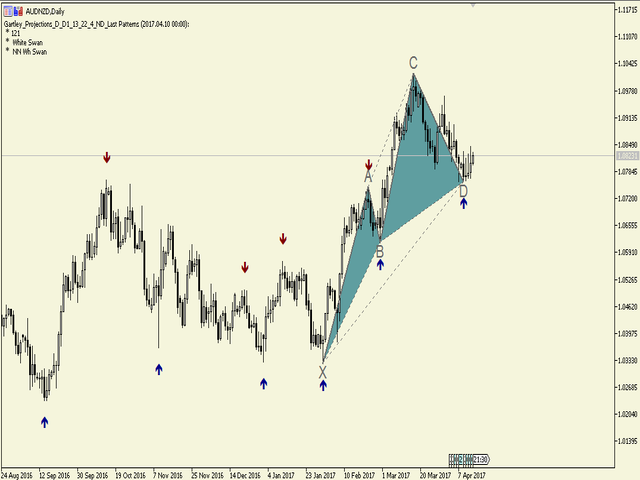
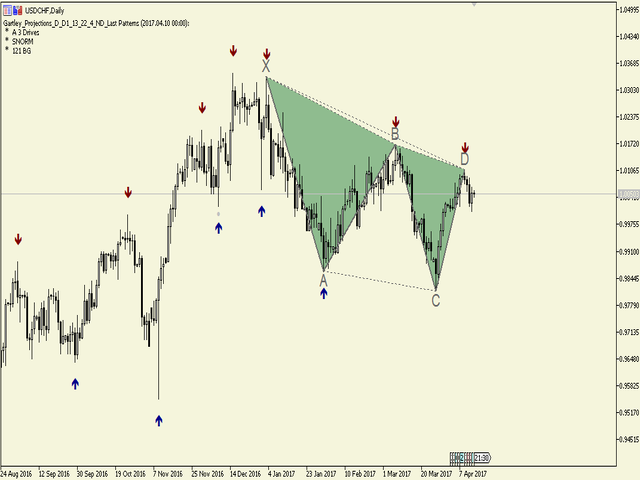
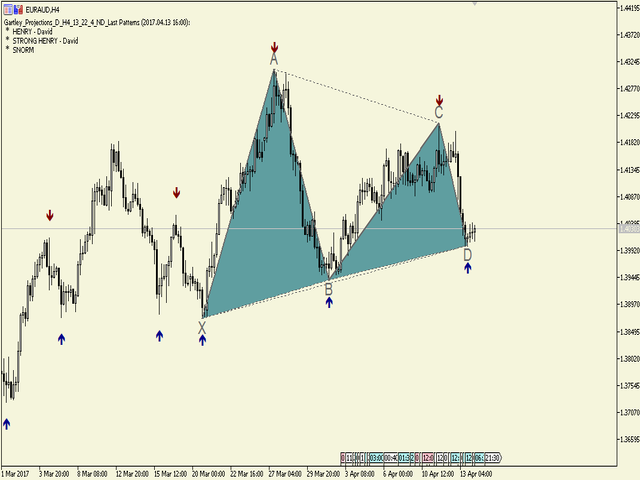
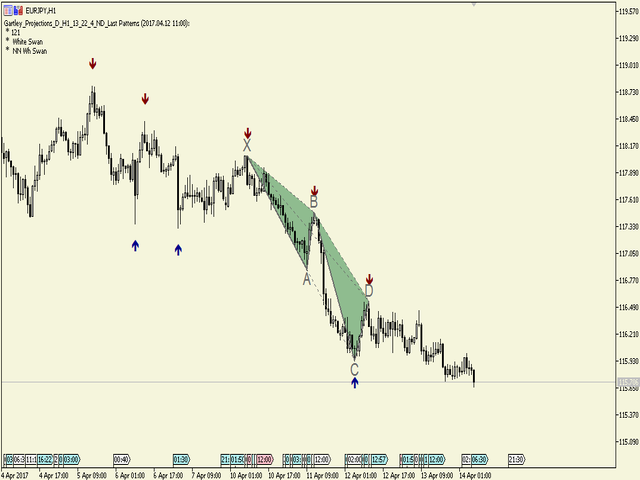
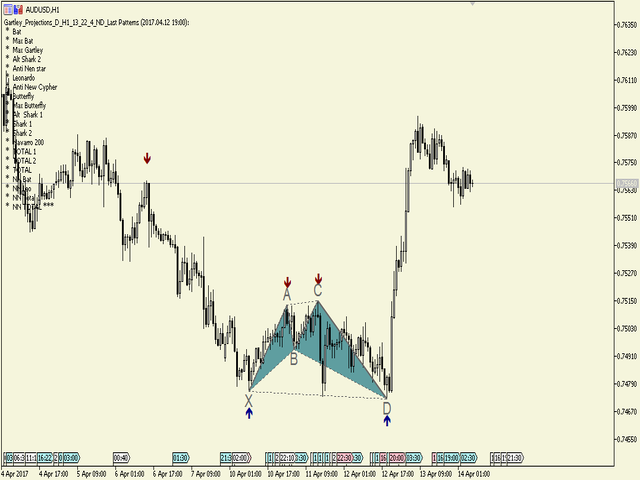
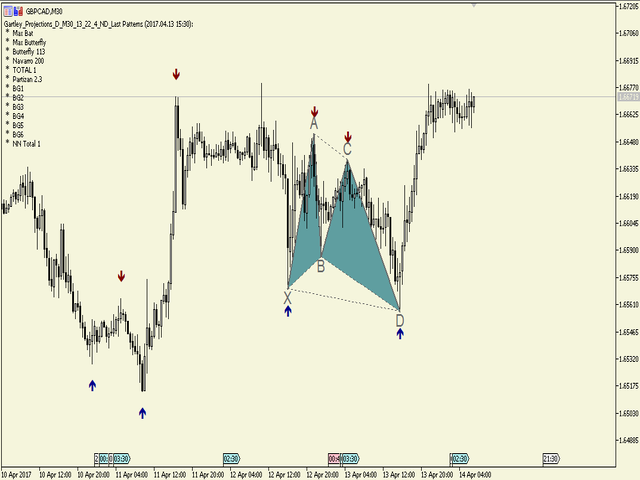
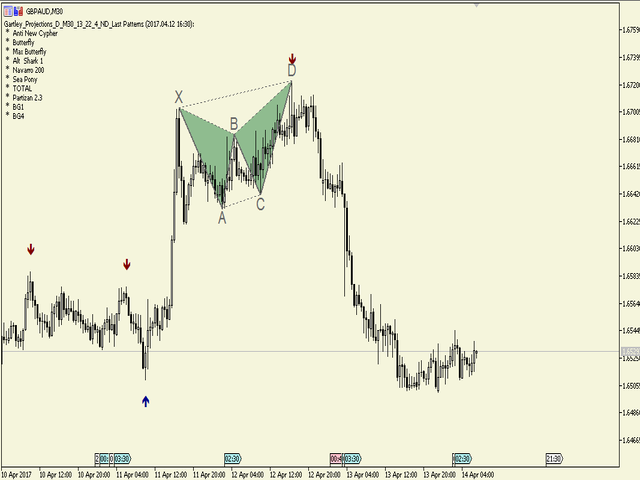
このインジケーターは、H.M.Gartley (「株式市場の利益」、1935 年) の開発に従って調和パターン (XABCD) を識別します。
D 点を透視投影の点として投影します (設定で ProjectionD_Mode = true を指定します)。
再描画はしません。 作業時間枠のバーが閉じるとき、特定されたパターン ポイントが Patterns_Fractal_Bars バーの間に移動していない場合、チャート上に (予想される価格変動の方向に) 矢印が表示されます。 この瞬間から、矢印はチャート上に永久に残ります。
連続した 2 ~ 3 つ以上の矢印 - これは市場状況の変化であり、再描画/再描画ではありません (時間枠を前後に切り替えてはなりません)。
注: 2 ~ 3 つ以上の矢印が連続している場合 - これは市況の変化であり、再描画ではありません。
パターンの総数は 85 です (Gartley-222 と Gartley-222WS を含む。完全なリストはコメント セクションにあります)。 識別されたすべてのパターンのうち、最後に識別されたパターンのみがベタ色で塗りつぶされます。
パラメーター
DrawPatterns (true/false) - 単色でパターンを描画します
ProjectionD_Mode (true/false) - D ポイントを遠近法の投影として定義するためのモード
Patterns_Fractal_Bars - 作業タイムフレーム バーの数。その間、形成されたフラクタルと見なされるためには、最後に識別されたパターン ポイントが固定されたままでなければなりません (チャート上に矢印が表示されます)。
Patterns_Deviation - パターン内の側面比率の基準値からの許容偏差パーセンテージ (許容値範囲)
Patterns_XA_MinLength_Bars - 初期セグメント XA のバーの最小許容数
Patterns_XA_MinHeight_Points - 初期セグメント XA の最小許容サイズ (ポイント単位)
ZigZag_Depth - ジグザグインジケーターのパラメーター
ZigZag_Deviation - ZigZag インジケーターのパラメーター
ZigZag_Backstep - ZigZag インジケーターのパラメーター
ShowInfo (true/false) - チャートの左側に識別されたパターンのリストを表示します。
PrintInfo (true/false) - 情報をログに出力します。


Also a verry good indicator