FFx 4 Patterns Alerter MT5
- インディケータ
-
Eric Venturi-Bloxs
 Below some of my FFx trading tools available on MQL:
For MT5 platform:
- FFx Pivot SR Suite: https://www.mql5.com/en/market/product/25794 - バージョン: 1.2
- アップデート済み: 8 4月 2020
- アクティベーション: 20
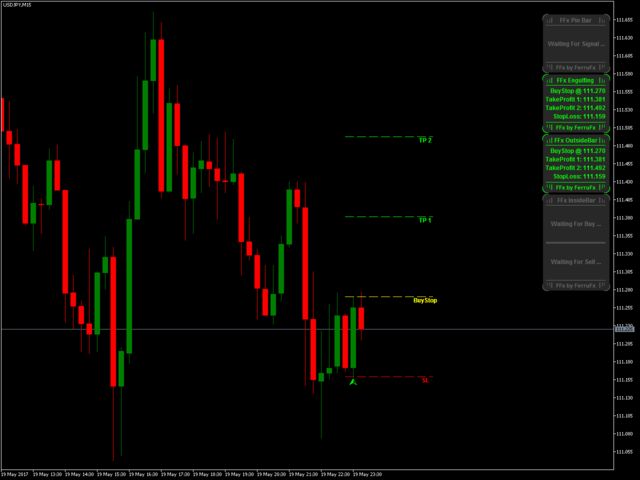
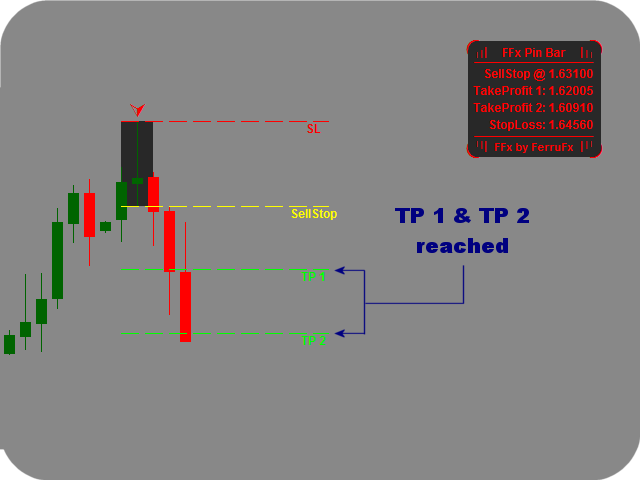
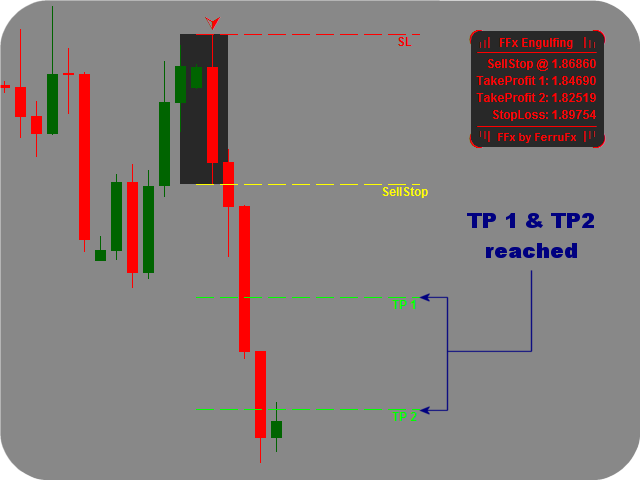
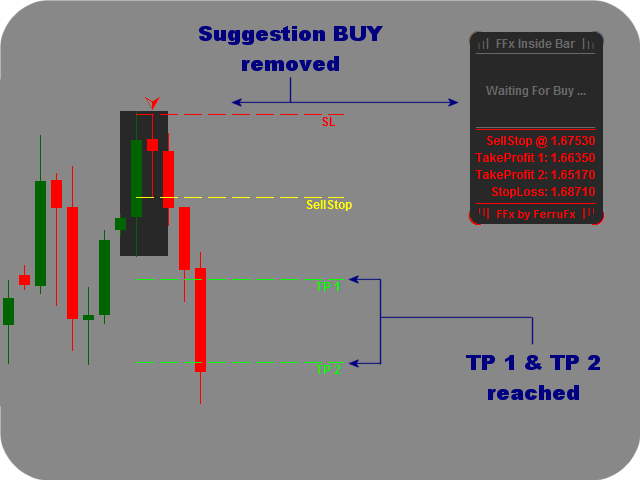
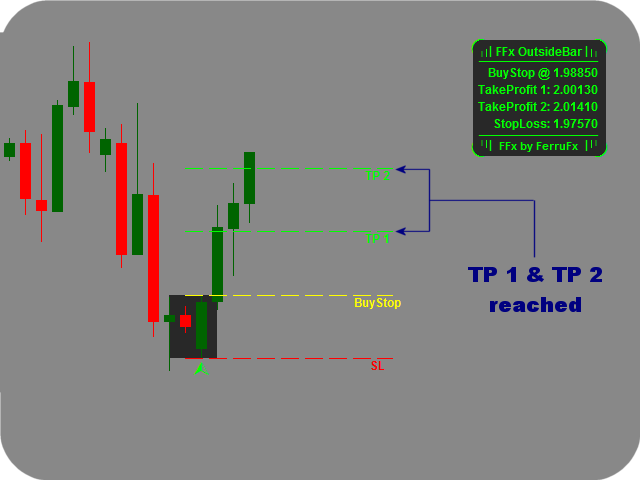
FFx Patterns Alerter gives trade suggestions with Entry, Target 1, Target 2 and StopLoss .... for any of the selected patterns (PinBar, Engulfing, InsideBar, OutsideBar)
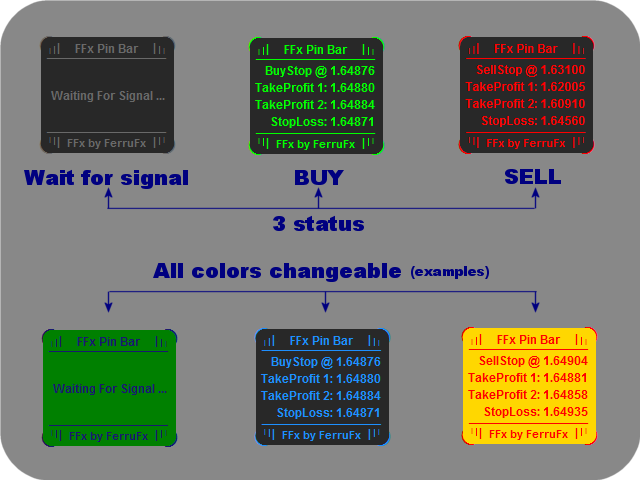
Below are the different options available:
- Multiple instances can be applied on the same chart to monitor different patterns
- Entry suggestion - pips to be added over the break for the entry
- 3 different options to calculate the SL - by pips, by ATR multiplier or at the pattern High/Low
- 3 different options to calculate the 2 TPs - by pips, by ATR multiplier or at Risk/Reward
- Offset the dashboard - any place on the chart
- Remove the suggestion once the price reached the SL line
- Lines extension away from the current candle
- All colors changeable - Background, text, Buy/Sell, entry and TP/SL
- Alert when a setup is found - sound / popup / email / push notification
Once a suggestion is given, you can confirm it with your own chart analysis. Generally the best setups to be traded are the ones occurring around important support/resistance, round numbers, supply and demand zones, etc.
Wish you all the best in your trading. Thank you for your confidence ... FerruFx
User Inputs
- Pattern Mode: select here the pattern to be monitored
- PinBar Minimum Size Pips: minimum size of the bar
- InsideBar Minimum Size Pips: minimum size of the bar
- Entry Break Plus Pips: number of pips away from the pattern where the entry is valid
- Use SL Pips: select here to enable the SL pips option
- SL Pips: number of pips for the stop loss
- Use SL ATR: select here to enable the SL ATR option
- SL ATR Multiplier: set here the multiplier to be applied to the ATR value
- SL ATR Period: ATR period
- Use SL HighLow: select here to enable the SL HighLow option
- SL HighLow Plus Pips: number of pips to be added to the high/low value
- Use TP Pips: select here to enable the TP pips option
- TP 1 Pips: number of pips for the take profit #1
- TP 2 Pips: number of pips for the take profit #2
- Use TP ATR: select here to enable the TP ATR option
- TP 1 ATR Multiplier: set here the multiplier to be applied to the ATR value
- TP 2 ATR Multiplier: set here the multiplier to be applied to the ATR value
- TP ATR Period: ATR period
- Use TP Reward: select here to enable the TP Reward option
- TP 1 Reward: set here the reward for the TP against the SL (Risk:Reward)
- TP 2 Reward: set here the reward for the TP against the SL (Risk:Reward)
- Dashboard X shift: you can set here any number to place the dashboard anywhere on the chart
- Dashboard Y shift: you can set here any number to place the dashboard anywhere on the chart
- Lines Extension: number of bars ahead of the current bar to extend the lines
- Delete Suggestion at SL: select here if you allow the suggestion to be removed if price reach SL level
- BUY/SELL Color: select here the color for buy/sell signals
- Background Color: select here the color for the panel background
- Corners Color: select here the color for the panel corners
- Text Color: select here the color for the text
- Entry Color: select here the color for the entry line
- TP Color: select here the color for the TP lines
- SL Color: select here the color for the SL line
- Sound Alert: select here to enable the sound alert option
- Sound File: set here the sound file for the alert
- Popup Alert: select here to enable the popupalert option
- Email Alert: select here to enable the emailalert option
- Push Alert: select here to enable the push notification option
ユーザーは評価に対して何もコメントを残しませんでした