Trend Forecaster
- インディケータ
-
Alexey Minkov
 💡 My name is Alexey, but my friends call me Alex. I have extensive experience in coding and trading since 2004. I am an active trader, IT developer and have a successful experience as a financial trustee, but my main passion, job, and hobby are programming. I am the author and developer of many
 - バージョン: 2.53
- アップデート済み: 27 4月 2026
- アクティベーション: 10
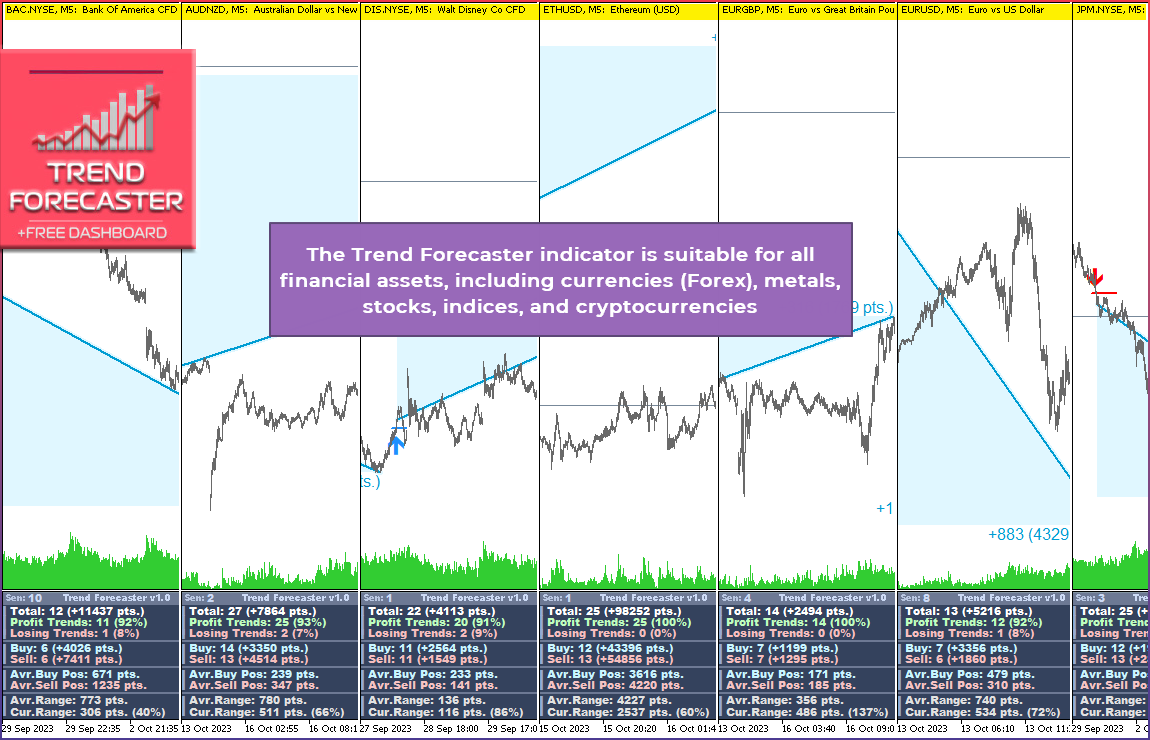
The Trend Forecaster indicator utilizes a unique proprietary algorithm to determine entry points for a breakout trading strategy. The indicator identifies price clusters, analyzes price movement near levels, and provides a signal when the price breaks through a level. The Trend Forecaster indicator is suitable for all financial assets, including currencies (Forex), metals, stocks, indices, and cryptocurrencies. You can also adjust the indicator to work on any time frames, although it is recommended to use M5 as the working time frame.
The indicator is extremely easy to set up – multiple internal algorithms are combined into a single essential variable! Add this powerful professional tool to your arsenal for identifying entry points, the current trend, and the maximum potential of any trading instrument. If you are a day trader, you can determine in advance whether it's worth opening a position or if the financial asset is already weak and you should wait for new signals.
Trend Forecaster Manual: https://www.mql5.com/en/blogs/post/754607
The Trend Forecaster indicator is a powerful professional tool that allows both novice and experienced traders to swiftly assess the current situation of a financial instrument. This indicator is built upon another of my indicators, Reversal Master for MT4, which has received numerous positive reviews. The MT5 version has been fundamentally re-worked to take advantage of the new features offered by MT5 for code analysis and optimization. Therefore, the MT5 version represents a fundamentally new product, with fresh capabilities and enhanced functionality.
Benefits of the Trend Forecaster Indicator
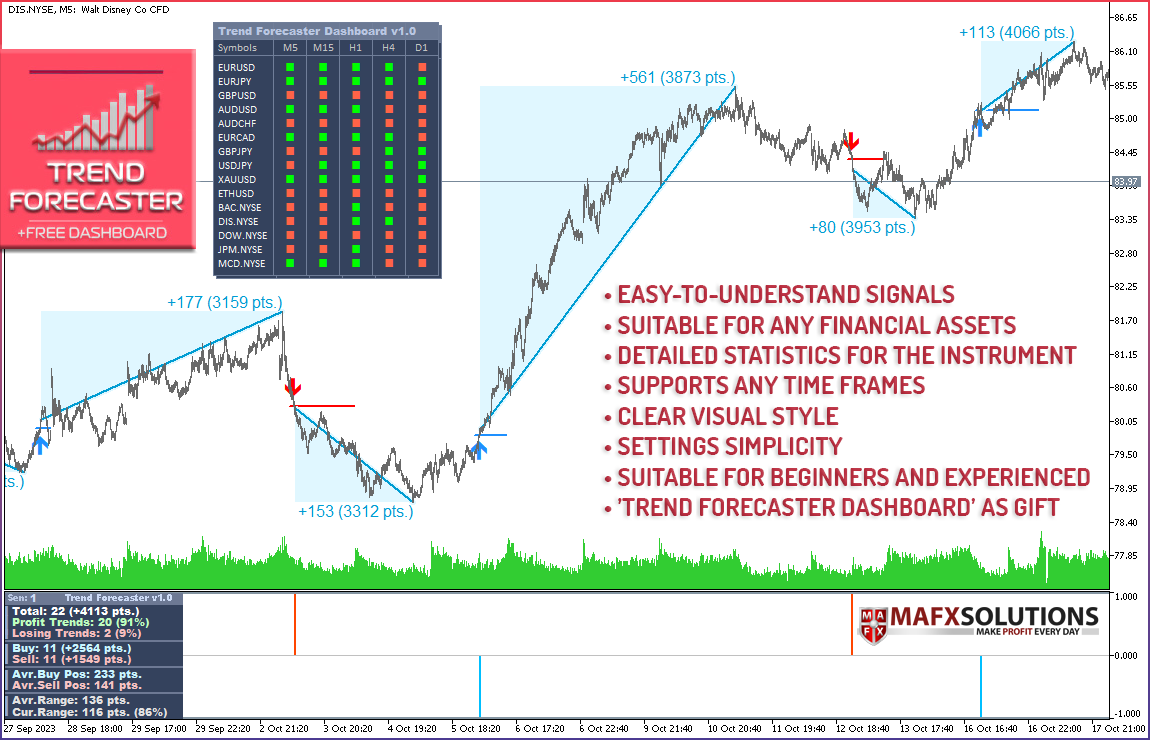
- Simple and Easy-to-Understand Signals
- Suitable for Any Financial Assets
- Detailed Statistics for the Financial Instrument
- Clear Visual Presentation of Information
- The indicator supports operation on any time frames
- Simplicity of Configuration
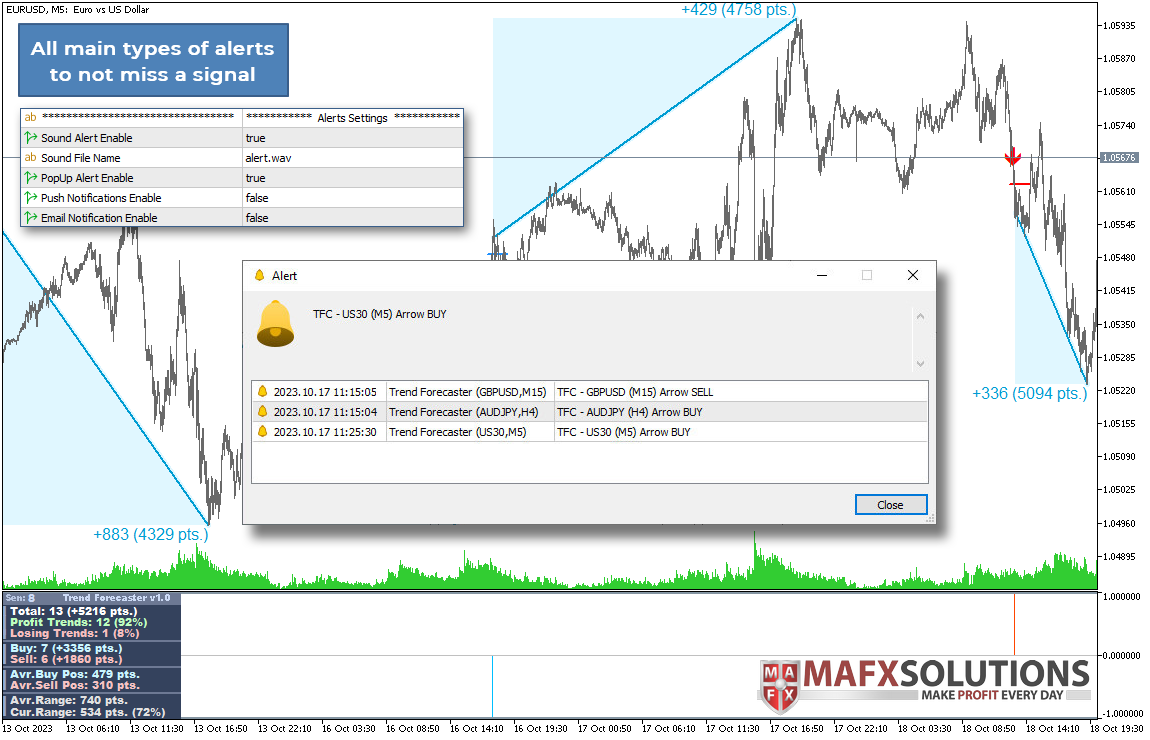
- Availability of Various Alert Types
You don't need to be a financial analyst to utilize Trend Forecaster signals. You receive a product that is easy to use, yet complex in terms of internal calculations and filters, which will elevate your trading to a new level.
Whether you trade in currencies, stocks, futures, or perhaps cryptocurrencies, all markets are at your disposal with the Trend Forecaster indicator.
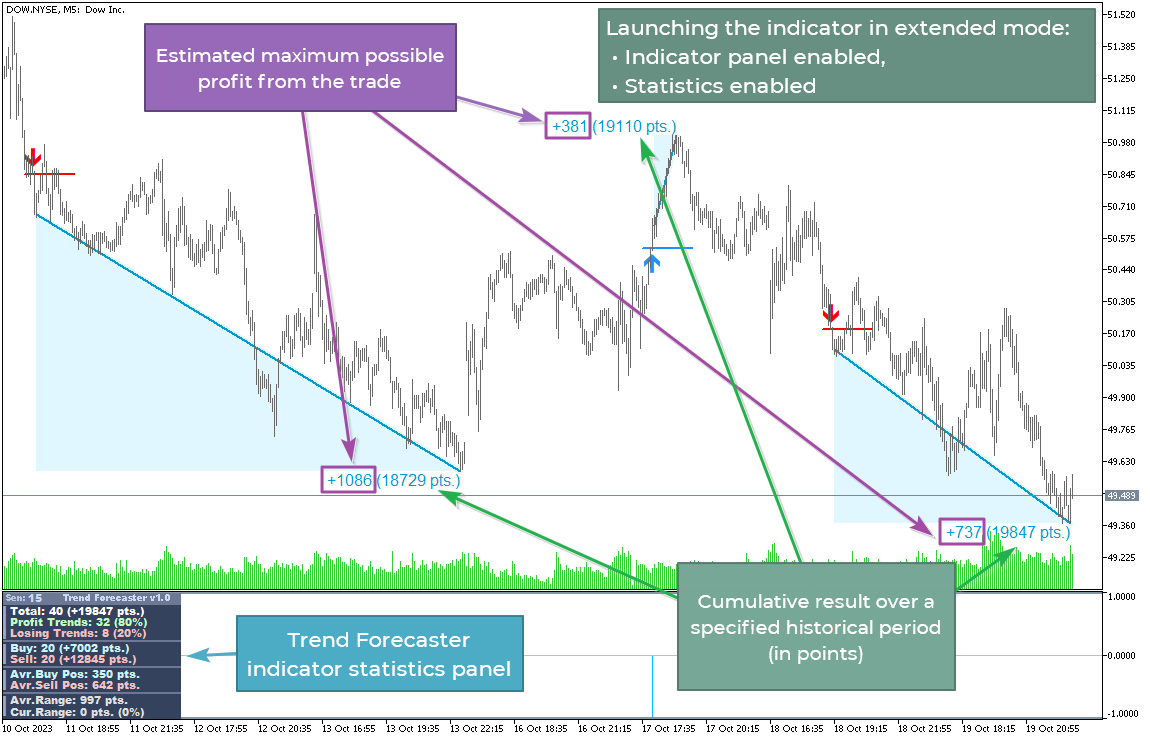
The Trend Forecaster indicator provides comprehensive analytics for the financial instrument. With this feature, you can quickly assess the total profit of the instrument over a specific time period, the profit potential of the instrument, and the expected profit from a trade. You can also determine whether it's worth opening a position at the moment or if the financial instrument has exhausted its potential.
Through collaboration with a focus group, we identified the optimal visual solutions to make the analysis process easier than ever before. Additionally, the ability to disable or toggle various modules has been preserved, allowing you to customize the visual representation of the indicator to your liking.
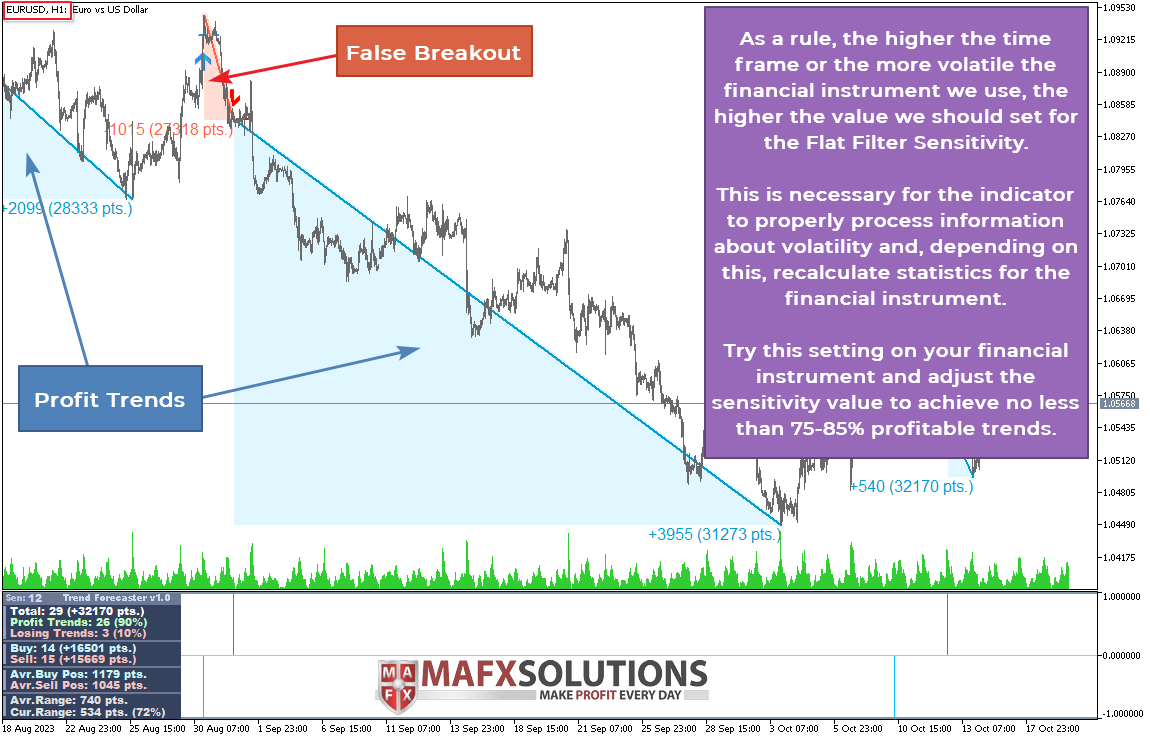
Do you trade on M1 or Daily timeframes? Or perhaps you use non-standard timeframes like M2 or H3? It doesn't matter – you can use any timeframe you prefer, easily adjusting the flat filter sensitivity with just one setting.
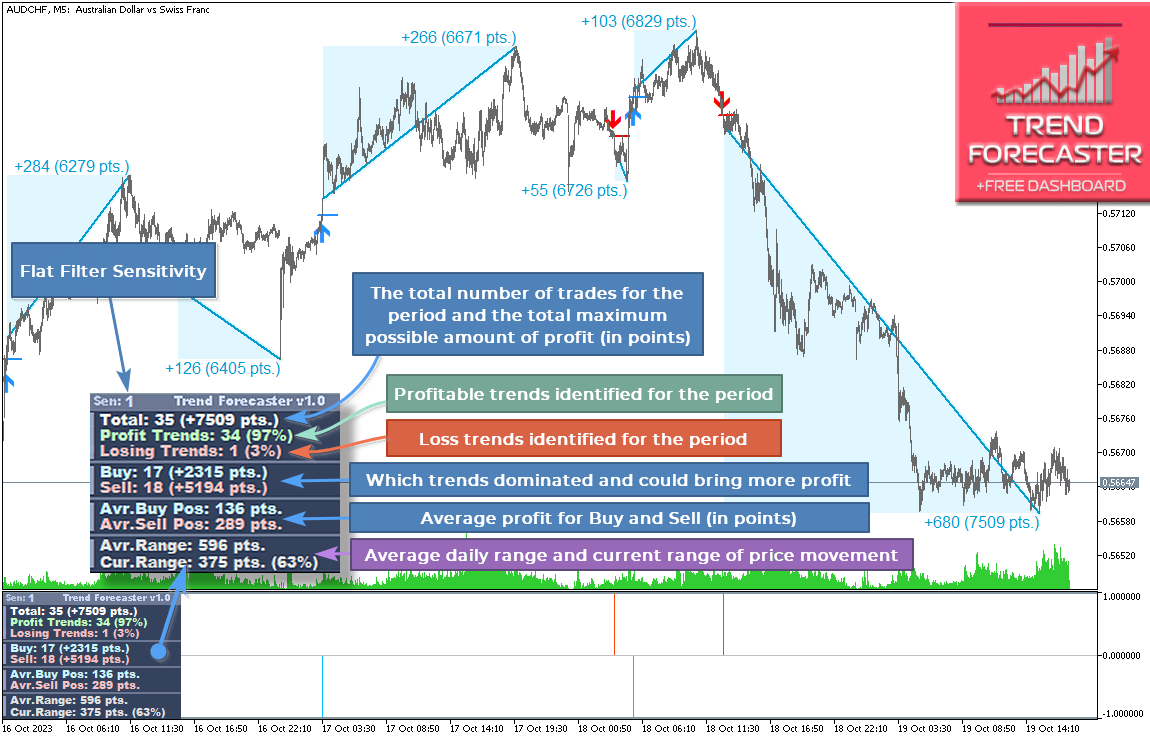
This is an indisputable breakthrough in the field of indicator development – numerous complex calculations and functions for continuous market analysis are all concealed behind a single significant setting, the Flat Filter Sensitivity adjustment. All other settings pertain solely to the visual aspects of the indicator.
In practice, it's not always enough for the indicator to display the signal only on the financial instrument's chart. It's important for the trader to receive information about it, even when they are not at the monitor at that moment. In the Trend Forecaster indicator, all major types of alerts are present: sound notifications, pop-up alerts, Push notifications, and Email messages.
- The indicator is suitable for both beginners and experienced traders
- Special Bonus for Trend Forecaster Indicator Buyers
It doesn't matter what level of experience you have. You can start your journey with the Trend Forecaster indicator if you are a beginner trader. Furthermore, you can streamline and enhance your trading performance, even if you already have another trading system, as the Trend Forecaster indicator can be used as a standalone product or as an addition to develop your own trading strategy.
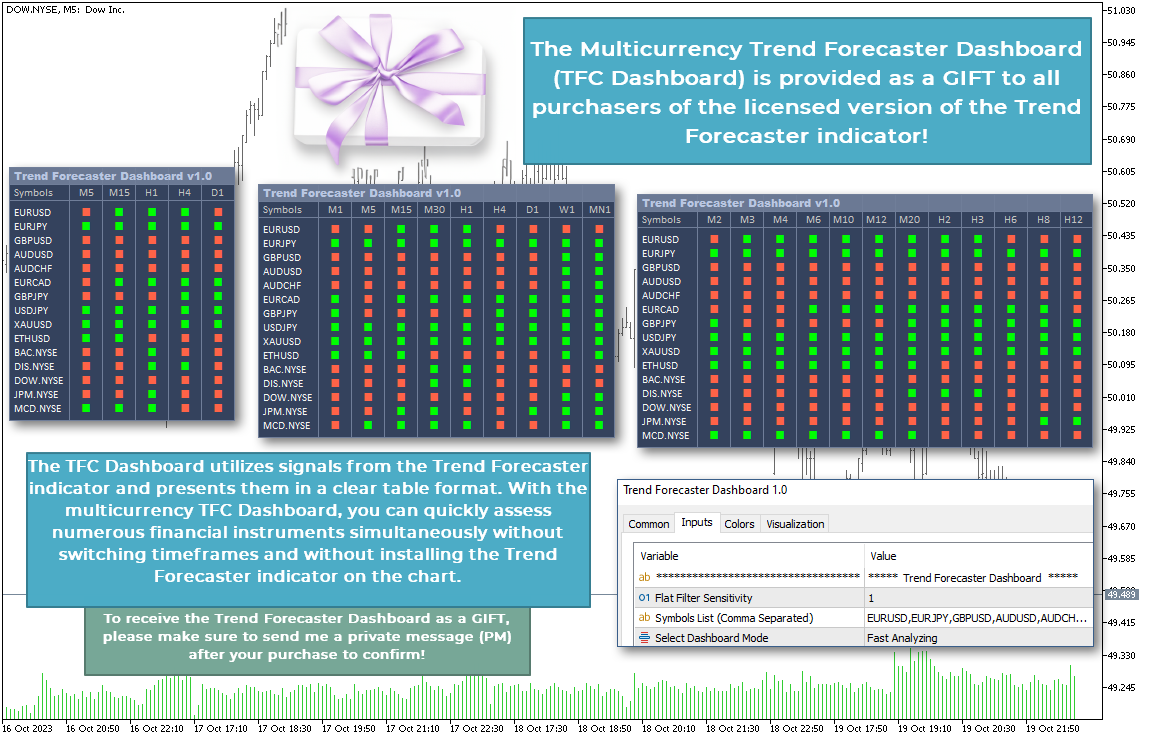
I want to express my gratitude to all my colleagues, friends, and buyers for their support, and as a token of my appreciation, I am offering you the Trend Forecaster Dashboard, a multi-currency panel, as a gift. By simply installing the panel on any price chart, you gain the ability to view current signals across a multitude of financial instruments and timeframes that you configure in the settings. This significantly streamlines and expedites market analysis. You can then proceed to select a specific financial instrument for more precise analysis and trade execution.
Basic Functional Concepts of the Trend Forecaster Indicator
The main purpose of the indicator is to display the maximum potential profit for the current financial instrument, as well as the average profit per trade and the buying or selling advantage for the instrument. Additionally, it safeguards the trader from opening a position when the current market range for the instrument reaches the average market range, which can lead to trend exhaustion and a subsequent reversal.
As long as the current position remains open, the indicator continues to monitor price movements and updates data on the maximum potential profit in line with the price. When a counter signal appears, the indicator records the profit value and includes it in the instrument's statistics, then proceeds to monitor the new signal. Signal arrows do not repaint after appearing.
Indicator Settings
Main Settings:
| Flat Filter Sensitivity | The Flat Filter Sensitivity – the main indicator setting |
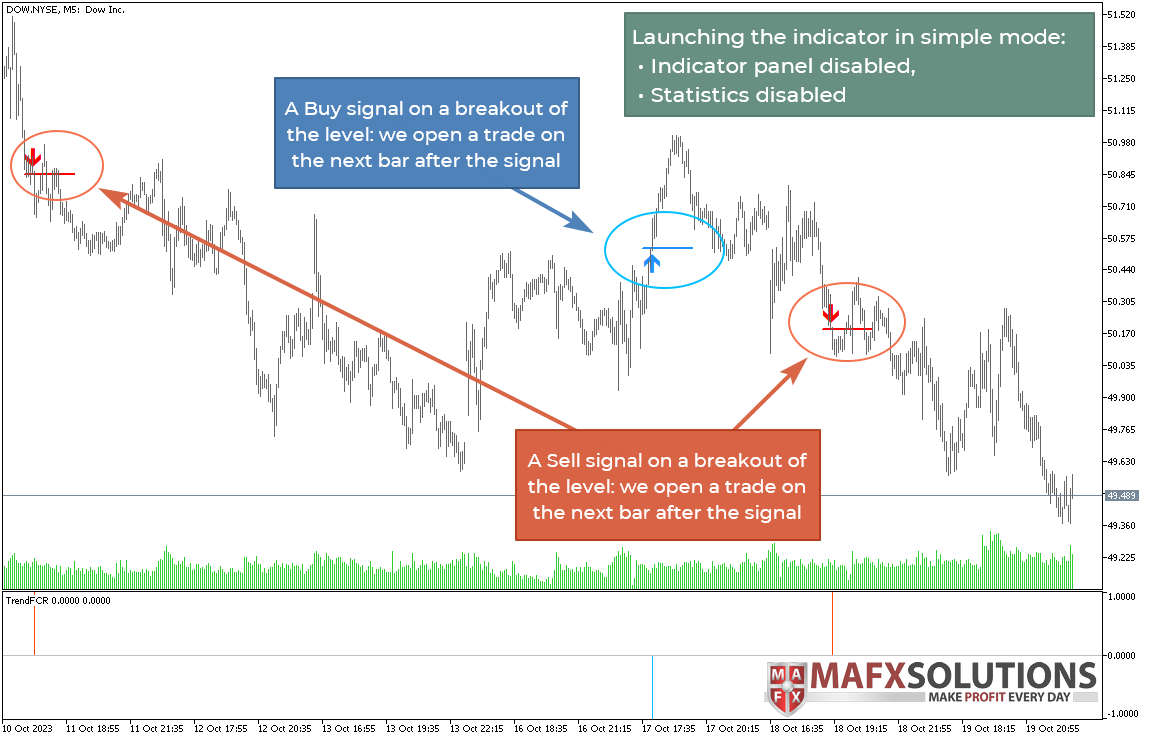
| Show Expected Profit/Loss | Display of expected Profit/Loss statistics on the price chart and on the indicator panel in the subwindow of the chart. When this option is turned off, the indicator panel in the subwindow is automatically disabled |
| Show Info Panel | Display of the indicator panel in the subwindow of the chart. When this option is turned off, financial instrument statistics are only displayed on the price chart |
| Panel Mode | Indicator panel display mode for saving space on the chart: Compact Mode – only the key statistics Normal Mode – normal operating mode Extended Mode – extended mode with full info set |
| Show Summary Profit at Chart | Displaying the cumulative profit on a price chart |
| Number of Bars to Analyze | The number of bars to analyze to adjust the depth of historical data analysis |
Signal Settings:
| Sound Alert Enable | Sound signal for a buy or sell signal alert |
| Sound File Name | The name of the sound file to be played for the sound signal (the sound file should be located in the 'Sounds' folder of the terminal) |
| PopUp Alert Enable | Pop-up notification |
| Push Notifications Enable | Sending a Push-notification |
| Email Notification Enable | Sending an email message |
Visual Settings:
| Select Color Theme | Selecting a color scheme: Off – the color scheme is disabled. In this case, custom color settings are used (as described below) Light Theme – light theme Dark Theme – dark theme |
| Buy Arrow Color | The color of the 'Buy' arrow |
| Sell Arrow Color | The color of the 'Sell' arrow |
| Profit Line Color | The color of the line connecting the open price and the maximum profit point |
| Loss Line Color | The color of the line for a losing position if the price does not move in the direction of the signal |
| Profit Line Background Color | The color of the glow around the profit line for better visibility on the chart |
| Loss Line Background Color | The color of the glow around the loss line for better visibility on the chart |
| Draw Profit/Loss Triangle Zones | Display/hide the profit/loss zone as a triangle |
Tips for Using the Trend Forecaster Indicator and the Additional Trend Forecaster Dashboard Panel
- Opening trades when gaps occur
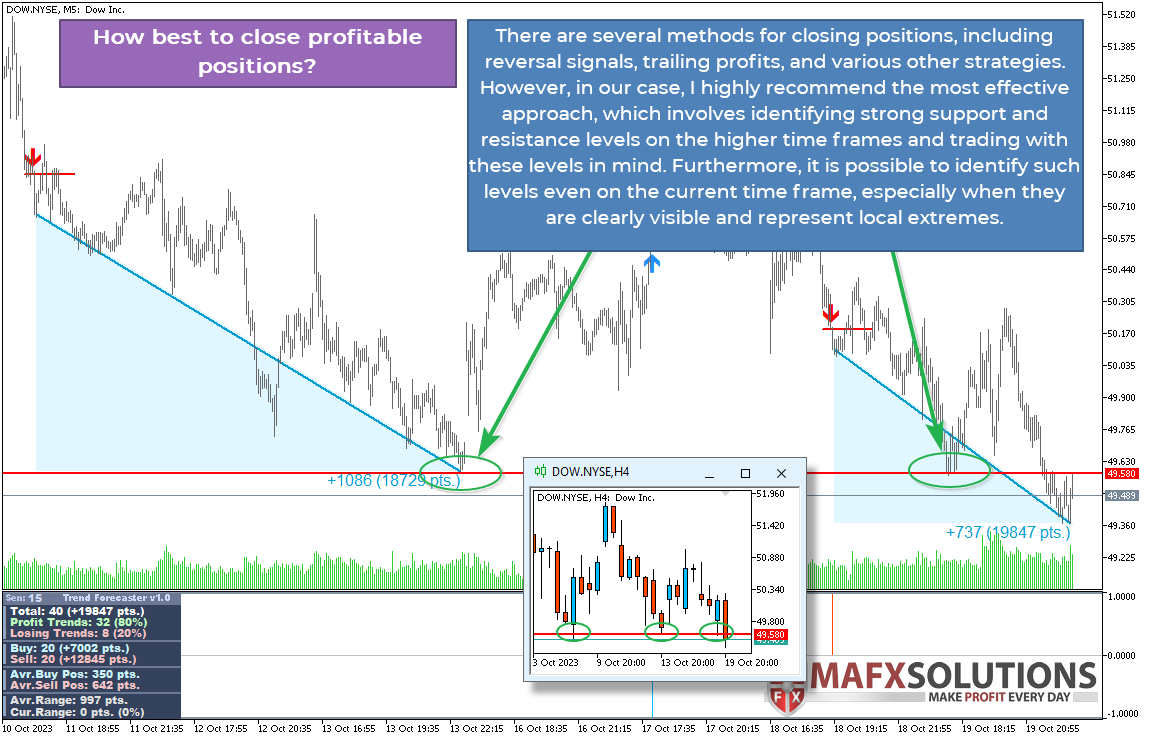
- How best to close profitable positions?
- How is it best to close losing positions?
- How can Average Range (Avr.Range) and Current Range (Cur.Range) help avoid a flat market with the risk of a reversal movement?
- How can Trend Forecaster Dashboard improve our results?
A trade entry signal occurs when a significant level is breached. I recommend avoiding trades where the level is breached on a gap.
The simplest and, in my opinion, not the most effective method is to close positions based on the opposite signal. However, such an approach can be quite effective in volatile financial instruments. The next method is using various types of trailing stops, such as moving the stop based on fractals. In this case, it's better to use a larger fractal size than the standard one. The most effective method, which I recommend, is to identify strong levels on the daily time frame and trade with consideration of these levels.
Along with closing positions based on the opposite signal, you can also consider the following option. If, after breaking through a level, the price doesn't continue its movement in the desired direction for a relatively long time, consolidates near the level, or retraces back below the level, you can contemplate closing positions without waiting for the opposite signal. As an example for determining a failed breakout, you can use a simplified count of bars during which the price didn't settle in the profit zone.
In trading, there is a simple truth - no one can ever accurately predict how far the price will go and when it will reverse. Fortunately, there are tools and possibilities that can significantly reduce the risk of opening positions in an exhausted market. The Average Range parameter shows us the average intraday volatility of a financial instrument. This is the value that the instrument typically moves within a day. Like all averages, it does not take into account extremely large or extremely small price movements. However, as such extreme movements are more the exception than the rule, this parameter allows us to estimate the average profit we can expect within a day on the analyzed financial instrument.
The Current Range parameter shows us how much the price has already moved within the day. Consequently, the higher the value of the Current Range relative to the Average Range, the less profit potential remains for us. In other words, if you see that the price has already covered 80% (for example) according to the Current Range, then you have approximately 20% of the Average Range left for potential profit. It's worth giving it some thought before entering such a trade. Keep in mind that with such a small price range, there is an increased risk of the market going flat and experiencing a subsequent reversal.
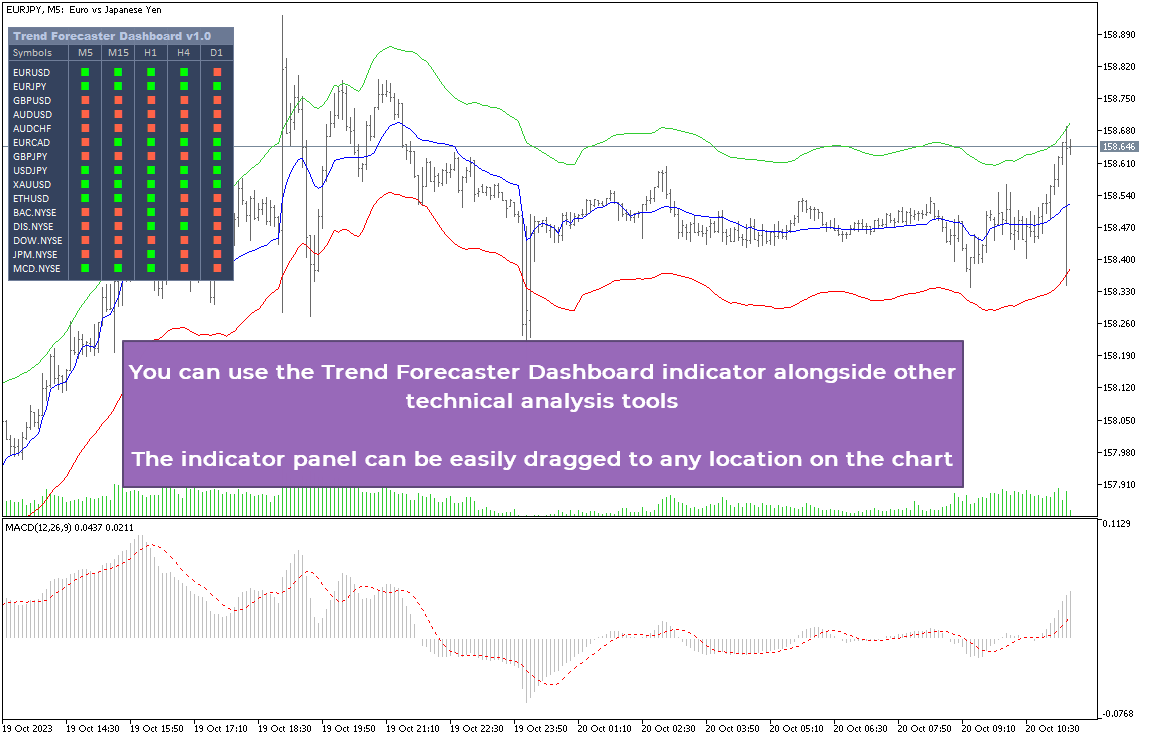
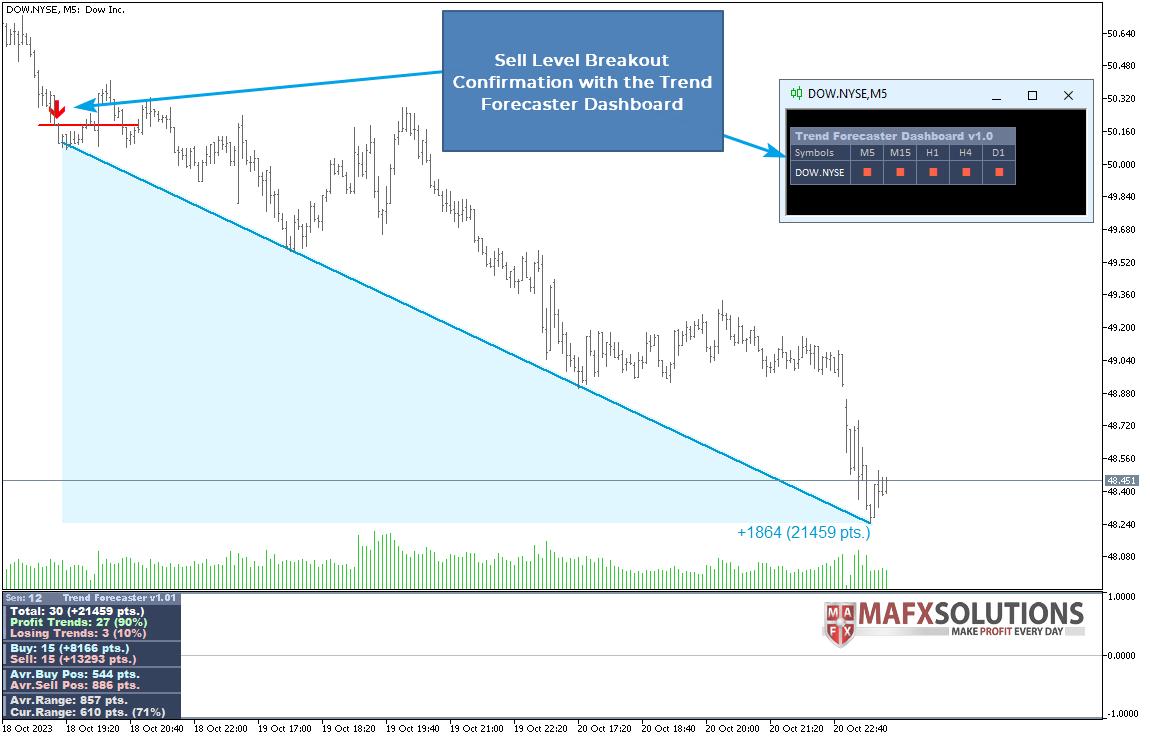
The well-known fundamental rule in trading tells us that the trend is our friend. While trading against the trend is possible, aligning your position with the trend makes the trading process significantly calmer and more effective. The additional indicator, Trend Forecaster Dashboard (TFC Dashboard), provides us with an extra advantage in our trading process. For instance, let's consider a scenario where we are trading EURUSD on an M5 time frame (which, by the way, happens to be my preferred time frame for more precise entry and exit points). Suppose we receive a Sell signal. However, we observe that the TFC Dashboard is indicating Buy signals on the H1 and H4 time frames. If we were to enter Sell positions on M5 at this point, our position would be contrary to the trend on the higher time frames, which is not favorable. To avoid this, we simply wait for a new buy signal on M5 that aligns with the trend on the higher time frames.
Another scenario could occur where the higher time frames have reversed and are now indicating Sells. In this case, on M5, we would also wait for a Sell signal in the direction of the trends on the higher time frames. As for the signal on the Daily chart, it's good if it also confirms the direction. However, if the TFC Dashboard signals that all time frames from M5 to H4 are in the Buy zone while the Daily is in the Sell zone, in such a case, I often disregard the Daily time frame information if I'm trading on M5. I can close my Buy positions a few times before feeling the impact of the Daily time frame. However, if H1 or H4 start to turn against your direction, it's better not to take risks or use additional confirming signals and set closer profit targets.
And one more important rule that I want to share with you in this short manual:
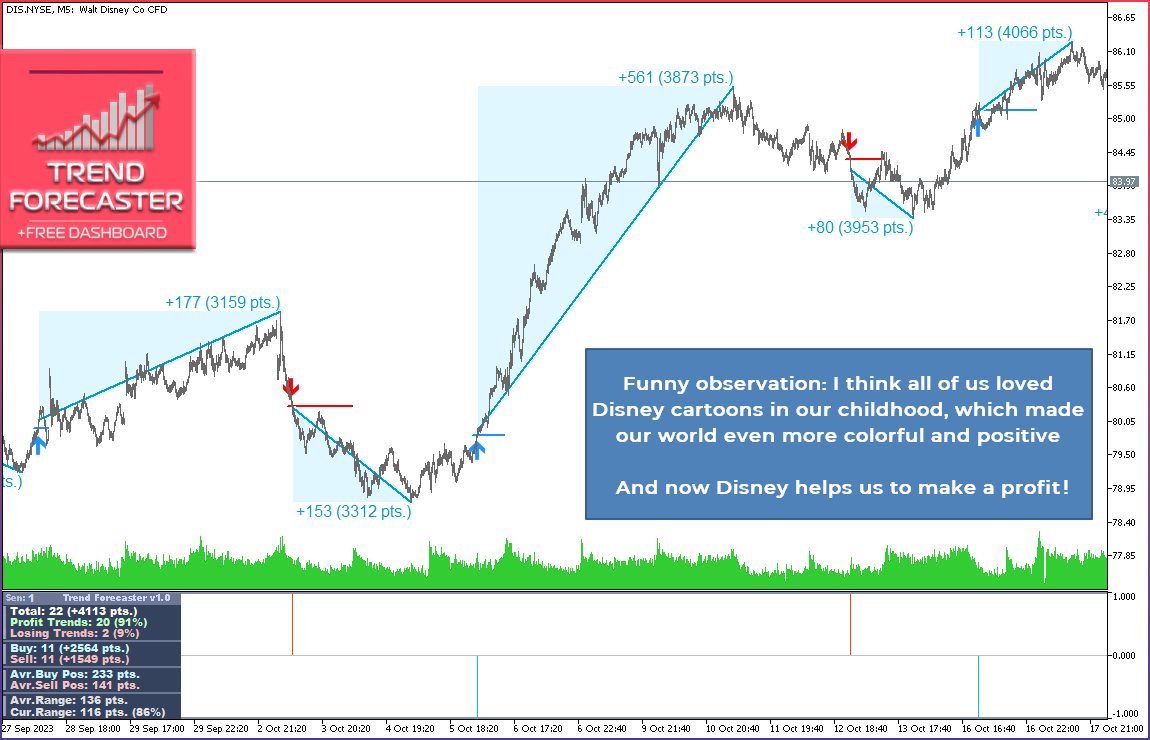
The indicator shows the maximum possible profit we can obtain from a trade, but you should understand that technically, achieving such profits pip by pip is impossible every time. Strong support and resistance levels, as mentioned earlier, can be very helpful in this regard. Additionally, use the following important rule when searching for suitable financial assets for trading. Try to select instruments for trading where the Profit Trends to Losing Trends ratio is better than 75% to 25%. In other words, anything better than that is a suitable option. For example, 96% to 4%, as I see at the time of writing this description on the charts of Disney and Dow.
You can find more detailed information on the practical application of the Trend Forecaster indicator in the indicator's manual.
Please take note! All my products can be purchased exclusively here, on the official MQL5 website. Beware of scammers and counterfeit copies of my products! When you buy licensed versions, you receive support and my trading advice along with practical guidance on using my products. And, of course, you'll get free updates for my products, which include various enhancements and additional functionality. All of this is forfeited when you acquire a questionable copy from third-party sources. I cannot be held responsible for the quality and functionality of code bought from third parties!
For all matters related to purchasing, installation, and usage of the indicator, please write in private messages (PM)!
About the reviews
Dear friends, I sincerely hope you are enjoying my developments. I would greatly appreciate it if you could share your valuable feedback on my products! As a trader and programmer, it is essential for me that my products are beneficial and assist you in trading. Your feedback directly influences future enhancements and inspires me to make my products even better for you. Thank you for your support and loyalty!


I find the indicator useful, particularly the bonus dashboard which I'm using to select which pairs to trade. Mr Alexey has been very helpful in replying to my questions on the use of the indicaotr. Many thanks.