Frontier Pivots
- インディケータ
-
Nestor Jose Mendez Boza
 定量トレーディングシステム設計者 & 時系列分析研究者
私は、アルゴリズム取引システムの研究開発に過去7年間専念してきた、多分野にわたる個人です。高度な数学、データサイエンス、市場分析への革新的な視点を融合し、国際的な競技環境で具体的な実績を残してきました。
主な実績:
Robotrader 2023(Interactive Brokers):Python戦略で 第3位
Robotrader 2025(Darwinex):MQL5と適応的リスク管理で 第3位 - バージョン: 2.0
- アップデート済み: 11 9月 2025
- アクティベーション: 5
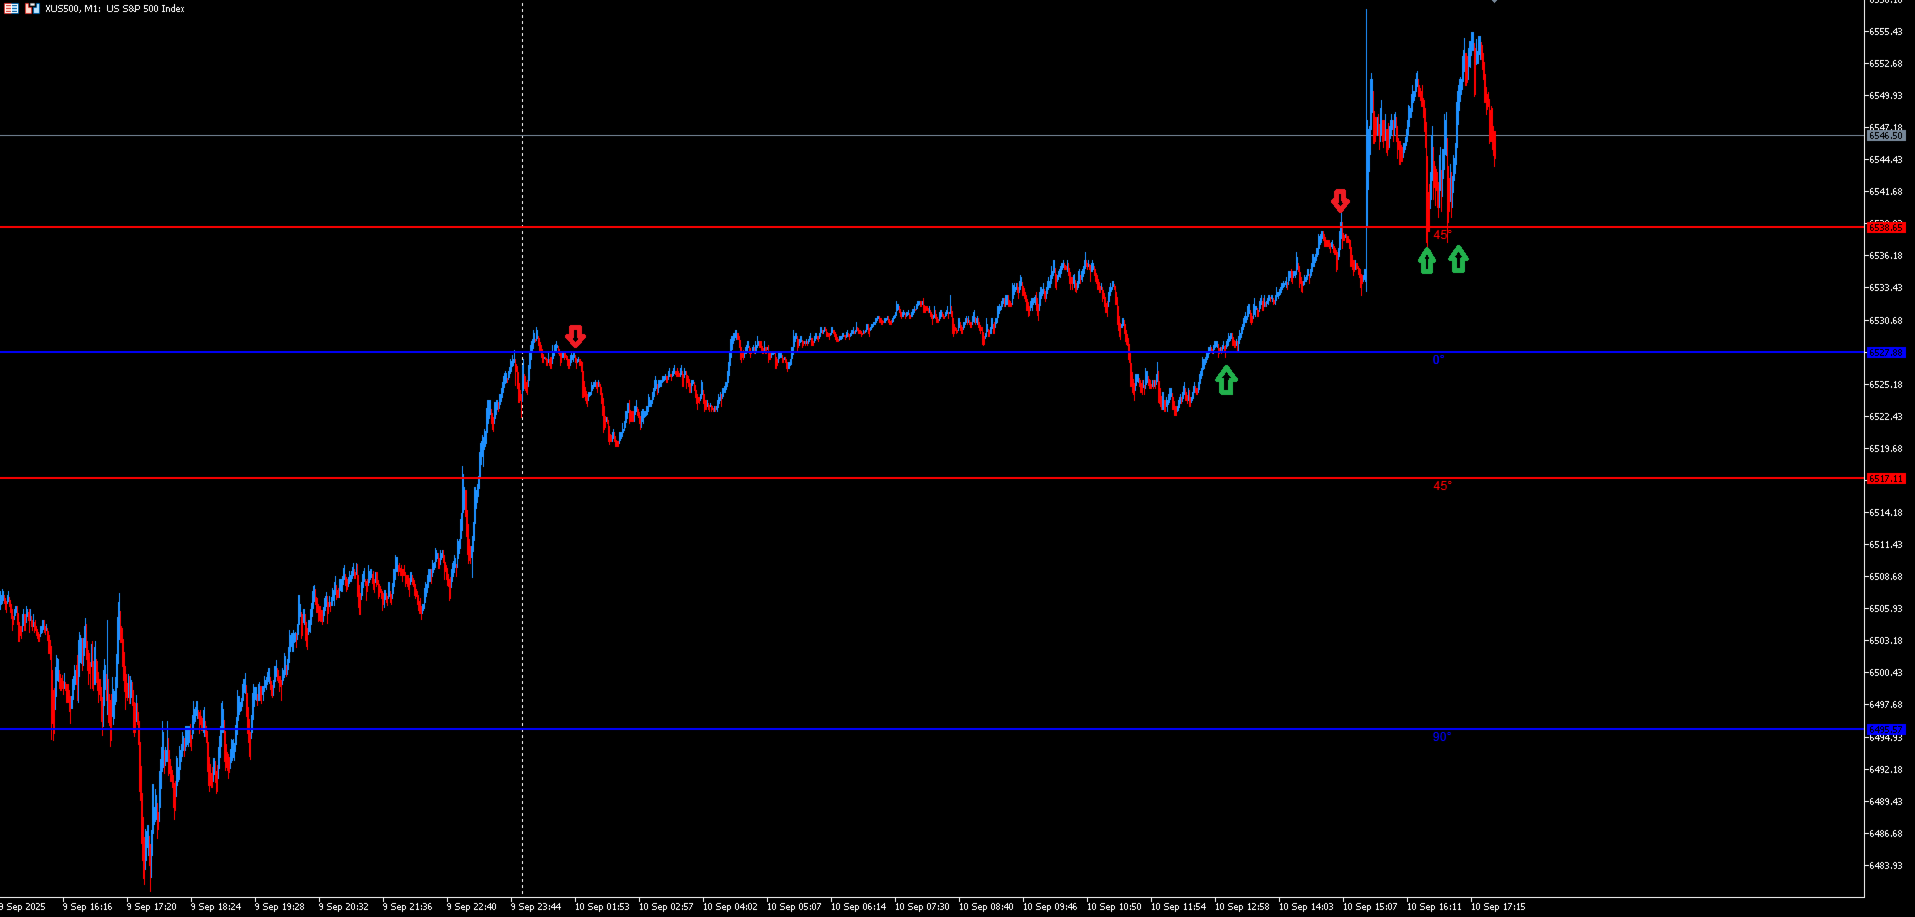
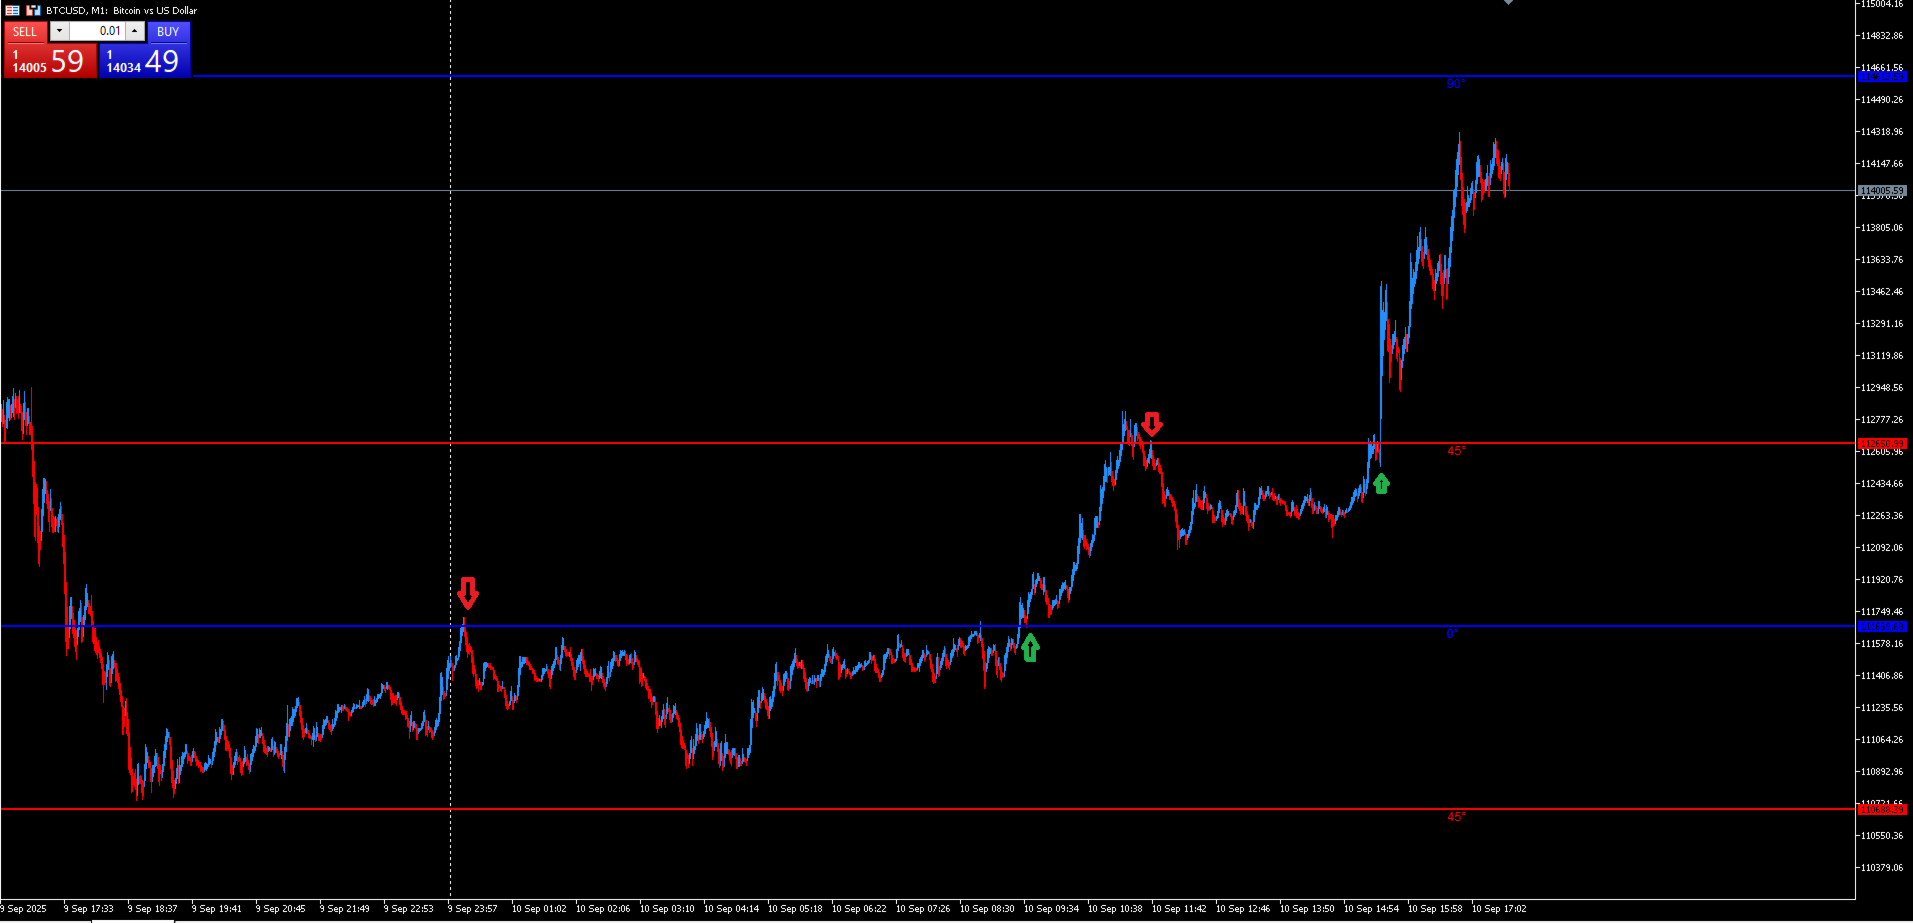
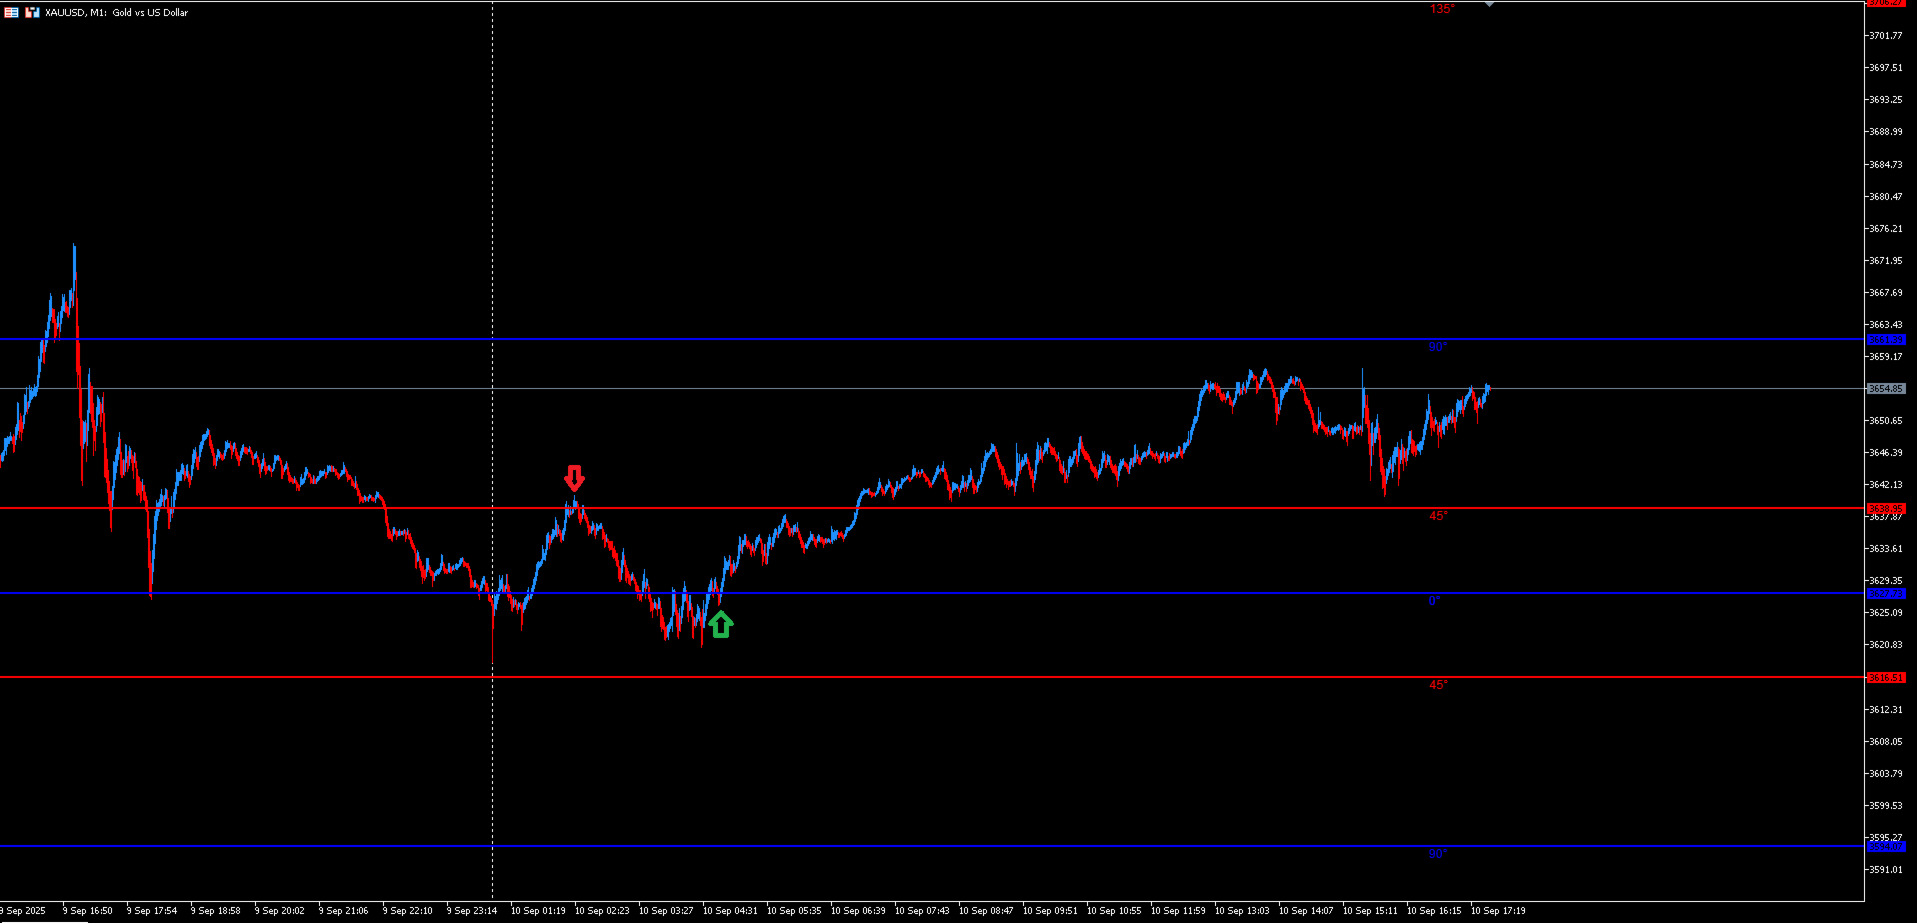
FRONTIER PIVOTS - Geometric Levels Indicator
This indicator plots support and resistance levels/ranges on the chart using mathematical calculations. It helps traders identify potential price reaction zones based on geometric patterns.
Main Features:
-
Automatically calculates and displays key price levels
-
Plots both support and resistance lines
-
Uses daily price data for level calculation
-
Clean visual presentation with different colors for different level types
-
No repainting - levels remain static once calculated
Input Parameters:
-
Trading Timeframe: Timeframe for level calculation (recommended: M1 or M5)
-
Level Colors: Customize colors for different angle types
-
Line Style: Adjust line thickness and style for better visibility
Advantages:
-
Provides visual reference points for potential support and resistance
-
Helps identify price zones where market may react
-
Works on any financial instrument
-
Easy to use with minimal configuration required
-
Lightweight and doesn't slow down the trading platform
How to Use:
-
Apply the indicator to any chart
-
Levels will automatically calculate and display
-
Observe price behavior around the plotted levels
-
Use in conjunction with other analysis techniques