 MetaTrader 5
 エキスパート
 インディケータ
 ライブラリ
ライブラリ
 ユーティリティ
 ウィジェット
 ルール
ルール
YouTubeにあるマーケットチュートリアルビデオをご覧ください
ロボットや指標を購入する
仮想ホスティングで
EAを実行
EAを実行
ロボットや指標を購入前にテストする
マーケットで収入を得る
販売のためにプロダクトをプレゼンテーションする方法
MetaTrader 4のためのテクニカル指標
 以下にリストされているテクニカル指標からのシグナルは、MetaTrader4プラットフォームで取引を開始および終了する際に重要な役割を果たします。
指標の本質は、価格変動の予測を目的とした金融銘柄価格の数学的変換です。
以下にリストされているテクニカル指標からのシグナルは、MetaTrader4プラットフォームで取引を開始および終了する際に重要な役割を果たします。
指標の本質は、価格変動の予測を目的とした金融銘柄価格の数学的変換です。 
Trend Sniper X は、トレーダーがトレンドの方向性と潜在的な反転ポイントを明確かつ正確に特定できるように設計された、MetaTrader 5 用のマルチタイムフレーム・トレンドフォロー指標です。 MT5版はこちら: https://www.mql5.com/en/market/product/181101 価格情報: 現在の価格はプロモーション価格であり、今後のアップデートや新機能の追加に伴い変更される場合があります。 Code2Profit チャンネル マルチタイムフレーム分析で市場をマスターしよう! Trend Sniper Xで勝率を最大化する方法:ルールとセッションのコツ 技術仕様 プラットフォーム MetaTrader 5 インジケータータイプ マルチタイムフレーム・トレンドインジケーター 動作タイムフレーム すべてのチャート時間足(上位足M1~MN1を独立して選択可能) 主要対象銘柄 為替(Forex)、ゴールド(XAUUSD)、その他のCFD 推奨口座 すべての口座タイプ ビジュアル表示 トレンドカラーローソク足(買い/売り/弱い/変化)+ 買い/売りシグナル

割引は 24 時間後に終了します — 次の価格は$ 69 ZORYK — MetaTrader 4専用 XAUUSDシグナル・トレードプランニングシステム
このような経験はありませんか。
ゴールドを分析し、エントリーを待ち、ようやくポジションを持った直後に価格が逆方向へ動く。
早すぎる決済をしてしまったり、Stop Lossを動かしたり、数秒迷っている間にチャンスを逃したりする。
その後、相場は自分が最初に予想していた方向へ進み、目標へ到達する。
問題は常に方向判断ではありません。
本当の問題は、明確な計画がなかったことです。
どこでエントリーすべきか。
どこでトレードの前提が無効になるのか。
近い利益を確保すべきか、より大きな値動きを待つべきか。
現在のsetupが本当に強いのか、それとも無理にトレードを探しているだけなのか。
ゴールドは非常に速く動きます。
正しい分析でも、明確なプランがなければ数秒で悪い判断に変わることがあります。
ZORYKは、その問題を解決するために開発されました。
ZORYKとは
ZORYKは、MetaTrader 4とXAU

Tokyo Indicatorは、トレンドの方向性、潜在的な取引シグナル、および市場状況を視覚的に分かりやすく表示します。 色分けされた階段状のトレンドラインにより、強気局面(青色)と弱気局面(マゼンタ色)が明確に区別されます。トレンドの変化に合わせて表示される方向矢印は、売買の好機を強調します。 統合されたダッシュボードには、現在のシグナル、市場のバイアス(傾向)、モメンタム、ボラティリティ、シグナルの品質がひと目で分かるようにまとめられています。これにより、トレーダーはパネルを切り替えることなく、価格変動(プライスアクション)とインジケーターの数値を照らし合わせて分析を行うことができます。 すっきりとしたチャート表示と簡潔な市場概要により、Tokyo Indicatorはトレンド分析や取引判断における体系的なアプローチをサポートします。 あらゆる時間足や銘柄に対応しており、特に金(ゴールド)の取引に適しています。 トレンド スキャナーの強力なサポートを利用して、無料のインジケーターを入手し、プライバシーを守ります。あーみー!
設定
ShowHUD - チャート上のパネ

SR Liquidity は、市場の流動性が集中し、価格が最も強く反応する「隠れたゾーン」を可視化するために設計されたトレーディング指標です。こうした流動性の高いエリアは強力なサポート(支持)およびレジスタンス(抵抗)レベルとして機能し、市場が反転する可能性が最も高いポイントを明確に示してくれます。 単なる一般的なサポートラインやレジスタンスラインを描画するのではなく、「SR Liquidity」は実際の価格変動を分析し、売りと買いの圧力が集中するゾーンを特定します。これらは、市場の真の動きを牽引する「流動性のプール(溜まり場)」そのものです。それらをチャート上に直接可視化することで、価格が実際に反応する前に、その動きを予測することが可能になります。つまり、このインジケーターは価格の方向性が変わる可能性を予測するのです。生のプライスアクションを、市場の重要な水準(転換点となり得るポイント)を示す、明確で実用的なロードマップへと変換してくれます。 このインジケーターは、FX、株価指数、貴金属、仮想通貨など、あらゆる銘柄や時間足で使用可能です。 ご購入後、取引手順や無料の優れた追加インジケ

PRO Renko Systemは、特別にRENKOチャートを取引するために設計された高精度の取引システムです。
これは、様々な取引商品に適用することができる普遍的なシステムです。 システムは効果的に正確な逆転信号へのアクセスを与えるいわゆる市場の騒音を中和する。
表示器は非常に使いやすく、信号の生成に責任がある1つの変数だけがあります。 あなたは簡単にお好みの任意の取引ツールとレンコバーのサイズにツールを適応させることができます。
私はいつもあなたが私のソフトウェアで収益性の高い取引を支援するために余分なサポートを提供する準備ができています!
私はあなたに幸せで収益性の高い取引をしたいです!
ご購入後にご連絡ください! 私はあなたに私のレンコチャートジェネレータを送信します。 私はまた、私の個人的な推奨事項やシステムの他のモジュールを無料で共有します!

ゴールドラッシュ・トレンド・アロー・シグナル
ゴールドラッシュ・トレンド・アロー・シグナル 指標は、XAU/USDにおける高速・短期スキャルパー向けに最適化された、正確でリアルタイムのトレンド分析を提供します。
1分足専用に設計されたこのツールは、明確なエントリーポイントを示す方向矢印を表示し、スキャルパーが変動の激しい市場状況でも自信を持って取引できるよう支援します。
この指標は、PRIMARY(主要)とSECONDARY(補助)のアラート矢印で構成されています。PRIMARYシグナルは、トレンドの方向転換を示す白と黒の方向矢印であり、SECONDARYシグナルは、PRIMARY矢印が示す方向を確認し、潜在的なエントリーポイントを示す青と赤の矢印です。
注意:トレンド方向の変化後にPRIMARYアラート矢印が1つだけ表示される場合、複数のSECONDARY青/赤矢印が表示される点に注意が必要です。SECONDARYシグナルは、シグナル基準を満たす任意のローソク足後に表示されます。したがって、長期的なトレンド移動の場合、画面に多くのSECONDARY矢印が表示されます(添付の

M1 SNIPER は使いやすいトレーディングインジケーターシステムです。M1時間足向けに設計された矢印インジケーターです。M1時間足でのスキャルピングのためのスタンドアロンシステムとして、また既存のトレーディングシステムの一部としても使用できます。このトレーディングシステムはM1時間足での取引に特化して設計されていますが、他の時間足でも使用できます。元々、この手法はXAUUSDとBTCUSDの取引用に設計しましたが、他の市場においても役立つと考えています。 インジケーターのシグナルは、トレンドの方向と逆方向に取引できます。インジケーターのシグナルを利用して両方向に取引するのに役立つ特別な取引テクニックをご紹介します。この手法は、特別な動的なサポートとレジスタンスの価格帯を利用することに基づいています。 ご購入後、M1 SNIPER矢印インジケーターをすぐにダウンロードできます。さらに、M1 SNIPERツールのすべてのユーザーに、以下のスクリーンショットに表示されているApollo Dynamic SRインジケーターを無料で提供しています。この2つのインジケーターを組み合わせることで

Atomic Analyst — MetaTrader 4 製品に関するご質問、設定方法、技術サポートについては、MQL5で直接メッセージをお送りください。 このインジケーターは、複雑な市場計算をシンプルな視覚シグナル、色分けされたローソク足、トレンド表示、ストップロスレベル、複数のテイクプロフィットゾーンに変換し、トレーダーが素早く理解して実際の市場環境で使用できるようにします。 主な取引用途: スキャルピングとイントラデイトレード:
素早い判断、明確な矢印、アラート、ローソク足カラー、構造化されたエントリー/エグジットゾーンのために設計されています。 デイトレードとスイングトレード:
トレンド方向、強さ、モメンタム、マルチタイムフレーム分析を使って、より大きな市場の動きを追うのに役立ちます。 主な機能: • Price Action、強さ、モメンタム分析
• マルチタイムフレームトレンドスキャナー
• 全体トレンド率の計算
• 買いと売りの矢印
• ストップロスと複数のテイクプロフィットレベル
• 最大5つのフィボナッチベースのテイクプロフィットレベル
• トレーリングストップ

Smart Trend Trading System は、トレンド情報、エントリー・決済シグナル、価格水準をひとつのチャートにまとめて表示する MetaTrader 4 用インジケーターです。 このシステムは、トレンド検出、反転ゾーン、Smart Cloud、トレーリングストップロジック、サポートとレジスタンス、ローソク足の色分け、アラート、マルチタイムフレーム分析など、 10 種類以上のトレーディングツール を 1 つに統合しています。 このシステムは、さまざまな市場環境での取引をサポートするように設計されています。 トレンド相場:
主要トレンドを特定し、押し目を検出し、モメンタムに従い、ストップロスガイドとトレーリングストップオプションを使って、より明確なエントリーを見つけます。 レンジ相場:
レンジ状態を検出し、反応ゾーンを特定し、価格が重要なレベルから反応したときに、より明確なシグナルを受け取ります。 スキャルピングとデイトレード:
短期売買の判断をサポートするために、高速シグナル、ローソク足の色、アラート、マルチタイムフレーム確認を使用します。 主な機能: • 10 種

Miraculous Indicator Binary & Forex v3 StrategySafe Miraculous Indicator Binary & Forex v3 StrategySafe は、明確なシグナル、強力な確認ツール、そして Binary と Forex 市場で使える体系的な取引アプローチを求めるトレーダー向けのプロフェッショナル指標です。 v3 では、MIR Dashboard、Miraculous Confirmation Dashboard、GANN Law、Square of 9 レベル、GANN 角度、そしてより高度な Forex モードが搭載されています。 主な特徴 Binary と Forex の両方に対応。 MIR Dashboard による素早い市場分析。 Miraculous Confirmation Dashboard によるエントリー確認。 Forex 分析用の GANN Law drawing lines。 Square of 9 のライン、レベル、方向表示。 1x1 GANN Angle によるトレンド圧力の確認。 Entry I

Liquidity Scalper System: インジケーター形式の流動性ベースのトレーディングシステムです。 多くのインジケーターは矢印を表示するだけで、ストップをどこに置くか、目標はどこか、そのシグナルを信頼してよいかはトレーダー自身が判断しなければなりません。Liquidity Scalper System はトレードの全サイクルをカバーします。流動性プールを見つけ、そのブレイク時にシグナルを出し、Entry、Stop Loss、3つのターゲットを即座に計算し、パネルに統計と新しいデータでの検証結果を表示します。設定はシステムが自動で選び、毎日更新します。 仕組み 1. システムが流動性プールを見つけます。市場参加者のストップ注文が集まっている価格水準です。 2. 価格がプールをブレイクし、そのブレイクが値動きの強さ(必要に応じて出来高)で確認されると、チャートに BUY または SELL の矢印が表示されます。 3. Entry、Stop Loss、TP1、TP2、TP3 の水準がゾーンの塗りつぶしとともに即座に描画されます。 4. 右側に流動性プロファイルが表示され、価

Top Bottom Tracker は、洗練されたアルゴリズムに基づき、市場のトレンドを分析し、トレンドの高値と安値を検出することができるインジケーターです / MT5バージョン 。
価格は500$に達するまで徐々に上昇します。次の価格 --> $99
特徴 リペイントなし このインジケーターは
新しいデータが到着してもその値を変更しません
取引ペア すべてのFXペア
時間枠 すべての時間枠
パラメーター ==== インジケータの設定
設定パラメータ // 40 (値が高いほど、シグナルは少なくなりますが、より正確です)
上レベル値 // 80 (上水平線の値)
下限値 // 20 (下限水平線の値)
インジケータ計算バー // 3000 (何本分のインジケータを計算するか。0を指定すると、全てのバーに対してインジケータを計算します)
==== アラーム設定
ポップアップアラート // true (端末にアラームを表示)
メールアラート // true (アラームをメールで通知)
アラート時間間隔 // 10 (アラーム間隔 (分))
警告

Gann Made Easy は、ミスター・ギャンの理論を使用した取引の最良の原則に基づいた、プロフェッショナルで使いやすい外国為替取引システムです。 W・D・ガン。このインジケーターは、ストップロスとテイクプロフィットレベルを含む正確な買いと売りのシグナルを提供します。 PUSH通知を利用して外出先でも取引可能です。 ご購入後、取引方法の説明と優れた追加インジケーターを無料で入手するには、私にご連絡ください! おそらく、ギャンの取引手法についてはすでに何度も聞いたことがあるでしょう。通常、ギャンの理論は初心者のトレーダーだけでなく、すでにある程度の取引経験がある人にとっても非常に複雑なものです。なぜなら、ギャンの取引手法は理論的にはそれほど簡単に適用できるものではないからです。私はその知識を磨き、最良の原則を私の外国為替インジケーターに組み込むために数年を費やしました。 このインジケーターは非常に簡単に適用できます。必要なのは、それをチャートに添付し、簡単な取引推奨事項に従うだけです。このインジケーターは常に市場分析の仕事を行い、取引の機会を探します。適切なエントリーポイントを検出す

Elliott Wave Trend was designed for the scientific wave counting. This tool focuses to get rid of the vagueness of the classic Elliott Wave Counting using the guideline from the template and pattern approach. In doing so, firstly Elliott Wave Trend offers the template for your wave counting. Secondly, it offers Wave Structural Score to assist to identify accurate wave formation. It offers both impulse wave Structural Score and corrective wave Structure Score. Structural Score is the rating to sh

Scalper Vault は、スキャルピングを成功させるために必要なすべてを提供するプロフェッショナルなスキャルピング システムです。このインジケーターは、外国為替およびバイナリー オプションのトレーダーが使用できる完全な取引システムです。推奨される時間枠は M5 です。 システムは、トレンドの方向に正確な矢印シグナルを提供します。また、トップとボトムのシグナルとギャン マーケット レベルも提供します。 インジケーターは、プッシュ通知を含むすべてのタイプのアラートを提供します。 インジケータの購入後にご連絡ください。私の個人的な取引の推奨事項と素晴らしいボーナス指標を無料で共有します! 幸せで有益な取引をお祈りします!

Introduction to Fractal Pattern Scanner Fractal Indicator refers to the technical indicator that makes use of the fractal geometry found in the financial market. Fractal Pattern Scanner is the advanced Fractal Indicator that brings the latest trading technology after the extensive research and development work in the fractal geometry in the financial market. The most important feature in Fractal Pattern Scanner is the ability to measure the turning point probability as well as the trend probabi

ボリューム ブレイク オシレーターは、オシレーターの形で価格変動とボリューム トレンドを一致させるインジケーターです。
私はボリューム分析を戦略に統合したいと思っていましたが、OBV、マネー フロー インデックス、A/D、ボリューム加重 Macd など、ほとんどのボリューム インジケーターにいつもがっかりしていました。
そのため、このインジケーターを自分で作成し、その有用性に満足したので、市場に公開することにしました。
主な機能:
ボリュームの増加 (ブレイク) によってサポートされる方向に価格が動くフェーズを強調します。 ボリュームの増加が止まり、市場が縮小するフェーズを強調します。 特に時間枠 (<=15 分) のデイトレードでは、価格もボリュームも動かないため、市場が将来の動きに備えられるフェーズを強調します。 ボリュームの増加によってサポートされていない場合、他のエキスパート アドバイザーからの誤ったシグナルをフィルターします。 トレンドとレンジ フェーズを非常に簡単に視覚化できます 入力パラメーター: 計算設定: 計算タイプ: FAST、NORMAL、SLOW。同じ

発見が困難で頻度が少ないため、分岐は最も信頼できる取引シナリオの1つです。このインジケーターは、お気に入りのオシレーターを使用して、通常の隠れた分岐点を自動的に見つけてスキャンします。 [ インストールガイド | 更新ガイド | トラブルシューティング | よくある質問 | すべての製品 ]
取引が簡単
通常の隠れた発散を見つけます 多くのよく知られている発振器をサポート ブレイクアウトに基づいて取引シグナルを実装します 適切なストップロスおよび利益レベルを表示します
設定可能なオシレーターパラメーター カスタマイズ可能な色とサイズ バー単位でサイズ別に分岐をフィルタリング パフォーマンス統計を実装します 電子メール/音声/視覚アラートを実装します 幅広い市場の見通しを提供するために、異なるオシレーターを使用して、干渉なしで同じチャートにインジケーターを何度もロードできます。このインジケーターは、次のオシレーターをサポートしています。 RSI CCI MACD オスマ 確率的 勢い 素晴らしい発振器 加速器発振器 ウィリアムズパーセントレンジ 相対活力指数 特に外国為替市場では、

現在30%オフ 初心者にもエキスパートトレーダーにも最適なソリューション このインジケーターは独自の機能と新しい公式を多数内蔵しており、ユニークで高品質かつ手頃な取引ツールです。このアップデートでは、2つの時間枠ゾーンを表示できるようになります。より長いTFだけでなく、チャートTFとより長いTF(ネストゾーンを表示)の両方を表示できます。すべてのSupply Demandトレーダーの皆さんのお気に召すはずです。:)
重要情報の公開 Advanced Supply Demandの可能性を最大化するには、 https://www.mql5.com/ja/blogs/post/720245 にアクセスしてください。 エントリーまたはターゲットの正確なトリガーポイントを正確に特定できれば取引がどのように改善されるか想像してみてください。新しい基盤となるアルゴリズムに基づいて構築されているため、買い手と売り手の間の潜在的な不均衡をさらに簡単に特定できます。これは、最も強い需要と供給のゾーンと、過去のパフォーマンス(古いゾーンを表示)がグラフィカルに表現されるためです。これらの機能は、最適な

The Super Arrow Indicator provides non-repainting buy and sell signals with exceptional accuracy. Key Features No repainting – confirmed signals remain fixed Clear visual arrows: green for buy, red for sell Real-time alerts via pop-up, sound, and optional email Clean chart view with no unnecessary clutter Works on all markets: Forex, gold, oil, indices, crypto Adjustable Parameters TimeFrame Default: "current time frame" Function: Sets the time frame for indicator calculation Options: Can be set

CRT Candle Range Theory HTF MT4 - Ultimate CRT Indicator: 高度なICTコンセプトとMalaysian SnRトレーディングシステム 最も先進的なCandle Range Theoryインジケーターでマーケットメーカーの足跡をマスターしましょう。Ultimate CRT Indicatorを使用して、Smart Money Concepts (SMC)の真の力を解き放ち、機関投資家のように正確にトレードします。真剣なトレーダー専用に構築されたこのインジケーターは、ICT Concepts (Inner Circle Trader)の核となる柱である、非常に効果的なCandle Range Theory (CRT)を自動化し、Malaysian Support and Resistance (SnR)エントリー手法とFVG (Imbalance)ゾーンの致命的な精度でそれを強化します。 MT4またはMT5でForex、Crypto、Indicesのいずれを取引している場合でも、このアルゴリズムは市場のノイズを取り除き、ダマシ(fak

Apollo SR Master は、サポート/レジスタンスゾーンを利用した取引をより容易かつ確実にする特別な機能を備えたサポート/レジスタンスインジケーターです。このインジケーターは、ローカル価格の高値と安値を検出することで、タイムラグなしでリアルタイムにサポート/レジスタンスゾーンを計算します。そして、新たに形成されたSRゾーンを確認するために、インジケーターは特別なシグナルを表示します。このシグナルは、SRゾーンを実際の売りまたは買いシグナルとして考慮して使用できることを示します。この場合、SRゾーンの強度が高まり、SRエリアからの取引が成功する確率も高まります。これがこのインジケーターの基本的な考え方です。 SRゾーンは、ストップロスとテイクプロフィットの設定を容易にします。シグナルの方向に応じて、SRゾーンの上または下のスペースをストップロスとして設定できます。さらに、反対側のSRゾーンは、潜在的なテイクプロフィットエリアとして設定できます。 また、Apollo SRマスターインジケーターをご利用のすべてのユーザーには、「Apollo Price Action System」

M1 Arrowは、ボラティリティとボリューム分析を含む市場の自然な取引原理に基づいたインジケーターです。このインジケーターは、あらゆる時間枠と通貨ペアで使用できます。インジケーターに搭載された使いやすいパラメーター1つで、取引したい通貨ペアと時間枠に合わせてシグナルを調整できます。 買いと売りのシグナルに基づくメインアルゴリズムに加え、入力欄で選択できる複数の追加戦略も内蔵されています。これらの戦略は設定不要で、インジケーターで選択した戦略モードに基づいて自動的に設定されます。 アルゴリズムは、追加フィルターを用いたボリュームと価格波動の分析に基づいています。このインテリジェントなアルゴリズムは、2つの市場要因が1つに組み合わさった場合にのみシグナルを発します。インジケーターは一定範囲の波動を計算し、ボリューム分析を用いて波動を確認します。 ご購入後、私の取引ヒントと素晴らしいボーナスインジケーターを無料で入手するには、ご連絡ください!

DayTrader PRO MT5: https://www.mql5.com/en/market/product/186222 DayTrader PROは、ジョン・エリュース(John Ehlers)のラグuerreフィルターと強力な自動最適化エンジンを組み合わせた、高度なトレーディング・インジケーターです。固定されたパラメーターを使用するのではなく、直近の市場状況に基づいて最適な設定を自動的に検索するため、手動による絶え間ない調整をすることなく、変化する市場のボラティリティに適応できます。 本インジケーターは、明確な「買い(BUY)」および「売り(SELL)」シグナルを生成し、現在の市場ボラティリティから算出された適応型のストップロス(Stop Loss)およびテイクプロフィット(Take Profit)レベルを表示します。トレンド、効率レシオ(Efficiency Ratio)、ボラティリティ、およびローソク足フィルターが内蔵されており、精度の低いセットアップを排除し、シグナルの精度を向上させます。 リアルタイム・パフォーマンスパネルには、現在最適化されている設定、プロフィッ

KURAMA GOLD SIGNAL PRO MT4版 ゴールドのサインに、目で見えるトレード計画を。 ゴールドのサインが出た。利確はどこか。損切りはどこか。エントリー前に何を確認すべきか。 KURAMA GOLD SIGNAL PROは、その判断材料をチャートに集約します。XAUUSDのM5、M15向けに、売買サイン、自動計算TP/SL、3段階のサイン評価、注意すべき相場条件を知らせるMARKETパネルを搭載。 セットアップ、決済目安、相場の注意点を一か所で確認。情報を集める手間を減らし、トレードの判断に集中できます。 買い切り購入者限定特典 AI Zone Radar MT5版と完全PDFマニュアルを無料プレゼント。 ご購入後にMQL5でメッセージをお送りください。買い切り購入が対象です。レンタルは対象外です。 AI Zone Radarを見る サインから、具体的なトレード計画へ SMA 13、21、75、100へのタッチを使ったセットアップを検出。各サインに売買方向と対象MAを表示するため、浅い押し目、戻りと深い調整を区別して確認できます。 チャートとパネルには、次の情報を表示し

現在40%オフ
初心者やエキスパートトレーダーに最適なソリューション!
このインジケーターは、独自の機能と新しい計算式を取り入れた、ユニークで高品質、かつ手頃な価格のトレーディングツールです。たった1枚のチャートで28の為替ペアの通貨強度を読み取ることができます。新しいトレンドやスキャルピングチャンスの引き金となるポイントを正確に特定することができるので、あなたのトレードがどのように改善されるか想像してみてください。
ユーザーマニュアルはこちら https://www.mql5.com/en/blogs/post/697384
これが最初の1本、オリジナルだ! 価値のないクローンを買わないでください。
特別な サブウィンドウの矢印で強い通貨の勢いを表示 GAPがあなたのトレードを導く! 基準通貨や気配値が売られすぎ・買われすぎのゾーン(外相フィボナッチレベル)にあるとき、個別チャートのメインウィンドウに警告表示。 通貨がレンジの外側から反落した場合、プルバック/リバーサルのアラート。 クロスパターンの特別なアラート
複数の時間枠を選択可能で、トレンドを素早く確認できます

This is a professional chart indicator designed for traders focused on stability and clear price action. It helps filter market noise and provides clear visual entry and exit zones for your trading decisions. Core Features: Strictly Non-Repainting: The system is built with strict non-repaint logic. What you see on the chart is the true historical performance. Confirmed Signals: Signals are triggered and confirmed only after the candle closes . Once a trading arrow appears on a closed candle, it

Quantum Naked SMC Prime is a streamlined Smart Money Concepts indicator designed for traders who prefer a clean chart, structured market analysis and clear visual trade setups without unnecessary complexity. The indicator combines market structure, liquidity behavior, institutional zones and confirmation logic into a compact analytical framework. Instead of flooding the chart with technical indicators, Quantum Naked SMC Prime focuses on the core elements of price action and Smart Money Concepts

Forex Breath System は、あらゆる市場で使用できるトレンドベースの取引システムです。このシステムは、通貨、金属、商品、指数、仮想通貨、さらには株式でも使用できます。任意の時間枠でも使用できます。システムは普遍的です。トレンドを示し、トレンドに伴う矢印シグナルを提供します。このインジケーターは、シグナルがトレンドの方向に現れたときに特別なタイプのアラートを提供することもできるため、トレンド取引が簡単になります。 このインジケーターは、理解しにくい設定に対処する必要がないため、非常に使いやすいです。 チャートに添付するだけで取引の準備が完了します。どのような取引スタイルを好む場合でも、このシステムは市場の方向性とトレンド方向への可能なエントリーポイントを確認するのに役立ちます。 このインジケーターは、PUSH 通知を含むあらゆる種類のアラートを提供します。 取引手順と素晴らしいボーナスを入手するには、購入後に私にご連絡ください。 幸せで収益性の高い取引をお祈りします!

Prop Firm Sniper MT4 is a professional market structure indicator that automatically identifies high-probability BUY and SELL opportunities using BOS and CHoCH analysis.
Recommended Timeframes: For backtesting, use the indicator on M5 or M15 for Gold (XAUUSD), and M15 or H1 for more volatile Forex pairs such as GBPUSD, USDJPY, EURGBP , and similar markets.
CONTACT ME AFTER PURCHASE TO CLAIM YOUR FREE BONUSES!
Prop Firm Sniper is a professional market structure indicator designed t

Scalping Points Pro is an indicator that shows possible price reversal points on the chart and does not redraw its signals. Also, the indicator sends signals to the trader via Email and Push. The accuracy of the signals of this indicator is approximately 92-94% on the M5 timeframe and more than 95% on the H1 timeframe. Thus, this indicator allows the trader to accurately open trades and predict further price movement.
The indicator does not redraw its signals. The indicator works on timeframe

このインディケーターは ウェッジを 見つけます。 ウェッジ は、価格統合期間を囲む収束トレンドラインによって識別される継続パターンです。フォーメーションブレイクアウトと一緒にドンチャンブレイクアウトを使用してトレードを通知します。 [ インストールガイド | 更新ガイド | トラブルシューティング | よくある質問 | すべての製品 ] 使いやすい カスタマイズ可能な色とサイズ ブレイクアウト信号を実装します あらゆる種類のアラートを実装します
最適な使用法 オーバーラップする可能性があるすべてのサイズのウェッジを表示するには、異なるサイズ(6、12、18、24など)でインジケーターをチャートに数回ロードします。
入力パラメータ サイズ:検出されるパターンのサイズ。代替ポイント間のバーとして表されます ブレイクアウト期間:取引を通知するドンチャン期間
最大履歴バー:チャートで調べる過去のバーの量 強気パターンの色:このパラメーターは一目瞭然です 弱気パターンの色:このパラメーターは一目瞭然です 切れ目のないパターンの色:このパラメーターは一目瞭然です 線幅:パターン線のサイズ 強

マトリックスアローインジケーターMT4は、すべてのシンボル/商品(外国為替、商品、暗号通貨、インデックス、株式)で使用できる100%再描画されていないマルチタイムフレームインジケーターに続くユニークな10in1トレンドです。マトリックスアローインジケーターMT4は、初期段階で現在のトレンドを判断し、最大10の標準インジケーターから情報とデータを収集します。
平均方向移動指数(ADX) 商品チャネルインデックス(CCI) クラシック平研アシキャンドル 移動平均 移動平均収束発散(MACD) 相対活力指数(RVI) 相対力指数(RSI) 放物線SAR ストキャスティクス ウィリアムズのパーセント範囲 すべてのインジケーターが有効な買いまたは売りシグナルを与えると、対応する矢印がチャートに印刷され、次のろうそく/バーの開始時に強い上昇トレンド/下降トレンドを示します。ユーザーは、使用するインジケーターを選択し、各インジケーターのパラメーターを個別に調整できます。マトリックスアローインジケーターMT4は選択されたインディケーターからのみ情報を収集し、それらのデータのみに基づいてアローを印刷

THE ONLY CURRENCY STRENGTH INDICATOR BUILT ON PRICE ACTION
Most currency strength meters average an oscillator, or measure how far price has travelled. But these are not accurate measures of trend, Currency Strength Matrix measures trend strength, not just if a currency price has gone up or down. Currency Strength Matrix reads market structure . For each of the 28 major pairs it finds the confirmed cycle highs and lows, and decides whether that pair is in an uptrend, a downtrend, or neither. A

MT4向けの究極のオープニングレンジ・ブレイクアウト(ORB)インジケーターで市場のオープンを制覇しよう! オープニングレンジ・ブレイクアウト(ORB) は、世界中のプロトレーダーに愛用されている最も強力で実績のあるデイトレード戦略の一つです。このインジケーターは、主要な3つのFXセッション(アジア、ロンドン、ニューヨーク)のオープニングレンジの特定、マッピング、追跡プロセスを完全に自動化し、一日の爆発的な値動きを捉える上で絶大な優位性をもたらします。 無料のEA ORBのダウンロードはこちら: https://www.mql5.com/en/market/product/187907 高い精度、洗練された視覚的美しさ、スマートなアラートシステムを備えて設計されたこのツールは、チャートをすっきりと保ちながら、高確率のブレイクアウトを絶対に逃さないようにします。 主な機能とメリット: マルチセッション対応: アジア、ロンドン、ニューヨーク各セッションのオープニングレンジを自動的にプロットします。 完全にカスタマイズ可能なタイミング: 固まったブローカーのサーバー時間に頼る必要はありません

Introduction Harmonic Patterns are best used to predict potential turning point. Traditionally, Harmonic Pattern was identified manually connecting peaks and troughs points in the chart. Manual harmonic pattern detection is painfully tedious and not suitable for everyone. You are often exposed under subjective pattern identification with manual pattern detection. To avoid these limitations, Harmonic Pattern Plus was designed to automate your harmonic pattern detection process. The functionality

現在40%オフ!
初心者やエキスパートトレーダーに最適なソリューション!
このインジケータは、独自の機能と秘密の数式を組み込んだ、ユニークで高品質かつ手頃な価格のトレーディングツールです。たった1枚のチャートで28の通貨ペアのアラートを表示します。新しいトレンドやスキャルピングチャンスの引き金となるポイントを正確に把握することができるので、あなたのトレードがどのように改善されるか想像してみてください!
新しい基本的なアルゴリズムに基づいて構築されているため、潜在的な取引の特定と確認がより簡単になります。これは、通貨の強さや弱さが加速しているかどうかをグラフィカルに表示し、その加速のスピードを測定するためです。加速すると物事は明らかに速く進みますが、これはFX市場でも同じです。つまり、反対方向に加速している通貨をペアにすれば、利益を生む可能性のある取引を特定することができるのです。
通貨の勢いを示す縦の線と矢印は、あなたの取引の指針となるでしょう。 ダイナミックマーケットフィボナッチ23レベルはアラートトリガーとして使用され、市場の動きに適応します。もしインパルスが黄色のトリガ

Scalper Inside PRO は日中トレンドの分析を助け、エントリー前にトレードを組み立てられるインジケーターです。中核となるのは、相場をより正確に読むための3つの専用ストラテジー。シグナルが出た瞬間に方向を自動で判断し、主要な価格帯を計算するので、想定エントリーポイント、予想ストップロス、複数の利確レベルを前もって確認できます。詳細なパフォーマンス統計が、各銘柄とストラテジーが過去にどう機能したかを示し、今の相場に合った資産選びを助けます。単体のスキャルピングツールとしても、あなたのシステムの一部としても、自作 EA のベースとしても使えます。MetaTrader 4 プラットフォームで動作します。 インジケーターはエントリー、3つの利確レベル - TP1、TP2、TP3、そして任意のストップロスをチャート上に直接表示します。自作の矢印インジケーターを接続し、その統計と収益性を検証することも可能です。 ご購入後は直接ご連絡ください。専用のボーナス add-ons、実トレードでの活用に関する追加情報、そしてご自身のトレードシステムや EA への正しい接続のサポートをお渡しします

Gold ZigZag - ローソク足の開始時にシグナルを提供する、実際には再描画や遅延のないジグザグである矢印インジケーターです。このインジケーターは、XAUUSD ペア (ゴールド) 用に特別に設計されています。このインジケーターは他のペアでも使用できますが、元々このインジケーターはゴールドでのみ使用されることを意図していました。このインジケーターはどの時間枠でも使用できますが、H4 や D1 などのより高い時間枠をお勧めします。 このインジケーターは使いやすく、トレーダーの特別なスキルや知識は必要ありません。このインジケーターには、「長さ」と「感度」という 2 つのオープンパラメーターしかありません。これら 2 つのパラメータを操作することで、個人の取引の好みに応じてシグナルを調整できます。 PUSH通知を利用して外出先でも取引可能です。 取引のヒントと素晴らしいボーナスを入手するには、購入後にご連絡ください。 幸せで有益な取引をお祈りします。
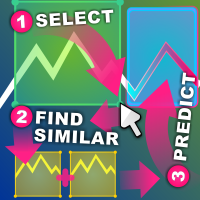
類似価格アクション インジケーター 類似価格アクションは、選択したチャートの領域に可能な限り類似するローソク足パターンの過去のシーケンスを検索します。
インジケーターは、選択した価格アクション領域の最初のローソク足の直前から、チャートの一番古い最初のバーまで検索を実行します。
2 つのシーケンス間の類似性を評価するための基準がいくつかあります: シーケンスの長さは同じである必要があります。選択した領域が 20 本のローソク足の幅である場合、一致する結果も 20 本のローソク足の幅である必要があります。ローソク足は好きなだけ選択できます。 シーケンスは、高値から安値までのサイズで視覚的に比較されます シーケンスは、始値から終値までのサイズと方向で視覚的に比較されます。ローソク足バーが一方のシーケンスでは強気で、もう一方のシーケンスでは弱気である場合、スコアは 0.0 に設定されます。 シーケンスには、デルタで比較される高速移動平均と低速移動平均のセットがあります。デルタは、その領域内で相対的に比較することも、資産全体で絶対的に比較することもできます (相対モードと絶対モード)。 シ

The Hydra Multi Trend Dashboard is an AI-Powered excellent market scanning tool designed for MetaTrader 4 and MetaTrader 5. It monitors up to 45 currency pairs or assets simultaneously across all 9 standard timeframes (M1 to Monthly). Using a proprietary Special Trend Formula, the dashboard filters out market noise and provides clear, visual Bullish or Bearish signals, allowing traders to identify trend alignments at a glance without switching charts. We don't offer free or bonus indicators in

トレンドキャッチャーインジケーター
トレンドキャッチャーインジケーターは、開発者独自の適応型トレンド分析指標を組み合わせることで、市場価格の動きを分析します。短期的なノイズを除去し、根底にあるモメンタムの強さ、ボラティリティの拡大、価格構造の挙動に焦点を当てることで、真の市場方向性を特定します。また、移動平均線、RSI、ボラティリティフィルターなどの平滑化およびトレンドフィルタリング機能を備えたカスタマイズ指標も使用します。
実際の運用状況のモニタリングやその他の製品については、こちらをご覧ください: https://www.mql5.com/en/users/mechanic/seller
ご注意ください。私はTelegramでEAや設定を販売していません。詐欺です。すべての設定はブログで無料で公開しています。
重要!ご購入後すぐにご連絡ください。手順とボーナスをお送りします!

FibStrike Rejection は、MT4用の強力なインジケーターで、高確率の買い/売りゾーンを フィボナッチリトレースメント と ヒゲ反発(wick rejection)シグナル を組み合わせて視覚化したいトレーダー向けに設計されています。 このインジケーターは、カスタマイズ可能な 過去バーの期間 に基づき、最近の高値と安値を自動的に特定し、 100%から40%まで のフィボナッチレベルを描画します。買いと売りのゾーンは、これらのレベル内で強調表示されます。 さらに、インジケーターはフィボナッチゾーンと当日の高値/安値での ヒゲ反発ローソク足 を検出し、 定義されたゾーン内のみで矢印を生成 します。これにより、ノイズや誤ったシグナルが減少します。アラートはオプションで、 音、モバイル通知、メール で受け取ることができます。 このインジケーターは、 プライスアクション(Price Action) やヒゲ反発、スマートマネーコンセプトを使ったエントリーに適しており、重要ゾーン内での 強力な反転ポイント を特定するのに役立ちます。 特徴: フィボナッチリトレースメント(100% →

Crypto_Forex MT4用インジケーター「インサイドバー&ピンバーパターン」。リペイント不要、遅延なし。
- インサイドバー&ピンバーパターンは、プライスアクショントレードに非常に効果的です。 - インジケーターはチャート上のインサイドバーとピンバーパターンを検出します。 - 強気パターン - チャート上の青い矢印シグナル(画像参照)。 - 弱気パターン - チャート上の赤い矢印シグナル(画像参照)。 - インサイドバー自体のR/R比(リワード/リスク)が高い。 - PC、モバイル、メールアラート機能付き。 - インサイドバー&ピンバーパターンは、サポート/レジスタンスレベルと組み合わせるのに最適です。
高品質のトレーディングロボットとインジケーターをご覧になるにはここをクリックしてください! これは、このMQL5ウェブサイトでのみ提供されるオリジナル製品です。

「ダイナミック・スキャルピング・オシレーター」は、MT4向けの高度なカスタムCrypto_Forexインジケーターです。効率的な取引ツールです! - 新世代のオシレーター - 使い方は画像をご覧ください。 - ダイナミック・スキャルピング・オシレーターは、適応型の売られ過ぎ/買われ過ぎゾーンを備えています。 - オシレーターは、動的な売られ過ぎ/買われ過ぎエリアから正確なエントリーポイントを見つけるための補助ツールです。 - 売られ過ぎ値:グリーンラインより下、買われ過ぎ値:オレンジラインより上。 - このインジケーターは、プライスアクションパターンと組み合わせるのに最適です。 - 標準的なオシレーターよりもはるかに正確です。 - PCとモバイルの両方でアラート機能付き。 高品質のトレーディングロボットとインジケーターをご覧になるにはここをクリックしてください! これは、このMQL5ウェブサイトでのみ提供されるオリジナル製品です。

only 12 free copies left VOLURIS — Volume Profile エンジン
あなたはすでにトレードのやり方を知っています。ただ、本来見るべきものが見えていないだけです。 その感覚を、あなたはすでに経験したことがあるはずです。
エントリーする。価格がすぐに逆行する。ストップにかかる。そしてその直後、価格は反転し、あなたが想定していた方向へ正確に進んでいく。あなたの判断は正しかった。ただ、早すぎた。あるいは遅すぎた。もしくはその両方だった。
後からチャートを見返すと、今なら分かります。エントリーのすぐ上に Naked POC があった。前回セッションの Value Area が、まさに価格が止まった場所にあった。VWAP がレジスタンスとして機能していたのに、あなたのチャートには表示されていなかった。コンテキストはすべてを教えていました。ただ、それを読み取るツールがなかっただけです。
これはトレードの問題ではありません。情報の問題です。
VOLURIS は、その問題を解決するために存在します。
VOLURIS とは
VOLURIS は単なる
FREE

ご紹介 Quantum Breakout PRO は 、ブレイクアウト ゾーンの取引方法を変革する画期的な MQL5 インジケーターです。 13年以上の取引経験を持つ経験豊富なトレーダーのチームによって開発された Quantum Breakout PROは 、革新的でダイナミックなブレイクアウトゾーン戦略により、あなたの取引の旅を新たな高みに押し上げるように設計されています。
クォンタム ブレイクアウト インジケーターは、5 つの利益ターゲット ゾーンを備えたブレイクアウト ゾーン上のシグナル矢印と、ブレイクアウト ボックスに基づいたストップロスの提案を提供します。
初心者トレーダーにもプロのトレーダーにも適しています。
量子EAチャネル: ここをクリック MT5バージョン: ここをクリック 重要!購入後、インストールマニュアルを受け取るためにプライベートメッセージを送ってください。 推奨事項:
時間枠: M15 通貨ペア: GBPJPY、EURJPY、USDJPY、NZDUSD、XAUUSD アカウントの種類: ECN、Raw、またはスプレッドが非

Titan Z-Score Pro Titan Z-Score Pro, MetaTrader 4 için tasarlanmış profesyonel düzeyde bir istatistiksel göstergedir. Bu, mevcut fiyatın tarihsel ortalama değerinden kaç standart sapma uzaklaştığını kesin olarak hesaplar. İstatistiksel varyans kullanarak, gösterge yatırımcıların duygusal önyargıdan ziyade matematiksel olasılıklara dayalı aşırı yayılmış piyasa koşullarını ve yüksek olasılıklı ortalama geri dönüş bölgelerini belirlemesine yardımcı olur. Temel Özellikler: Akıllı V-Reversal Mantığı

通貨強さウィザードは、取引を成功させるためのオールインワン ソリューションを提供する非常に強力な指標です。このインジケーターは、複数の時間枠のすべての通貨のデータを使用して、このまたはその外国為替ペアのパワーを計算します。このデータは、使いやすい通貨インデックスと通貨パワーラインの形式で表され、特定の通貨のパワーを確認するために使用できます。 必要なのは、取引したいチャートにインジケーターを接続することだけです。インジケーターは、取引する通貨の実際の強さを示します。このインジケーターは、トレンドに合わせて取引するときに有利に利用できる売買高の圧力の極値も示します。このインジケーターには、フィボナッチに基づく可能なターゲットも表示されます。 このインジケーターは、PUSH 通知を含むあらゆるタイプのアラートを提供します。 購入後ご連絡下さい。私の取引のヒントをあなたと共有し、素晴らしいボーナスインジケーターを無料で提供します! 幸せで有益な取引をお祈りします。

プレシジョン・インデックス・オシレーター(Pi-Osc)は、Precision Trading SystemsのRoger Medcalfによるものです。
バージョン2は、チャートにスーパーファストでロードされるように注意深く再コードされ、その他の技術的な改良も組み込まれて、エクスペリエンスを向上させています。
Pi-Oscは、市場が強制的に行かなければならない、すべての人のストップを取り除くためのポイントである、極限のエクソースト・ポイントを見つけるために設計された正確な取引タイミング信号を提供するために作成されました。
この製品は、極限のポイントがどこにあるかを知るという古代の問題を解決し、トレーダーの生活をはるかにシンプルにします。
これは、業界標準のオシレーターとは異なる強力な要素を持つ高度なコンセンサス・インジケーターです。
使用されている一部の機能には、需要指数、マネーフロー、RSI、スティリング、パターン認識、出来高分析、標準偏差の極値などがあり、異なる長さでこれらのバリエーションが多く含まれています。
初めて見ると、訓練されていない目には、他のオシレーター

Future Trend Channel は、トレンドの方向性を識別し、価格変動の可能性を予測するために設計されたダイナミックで視覚的に直感的なインジケーターです。もともとChartPrimeによってTradingView用に開発されたこのツールは、MetaTrader 4用に適応されており、トレーダーに同等の機能を提供します。スウィングトレーダー、デイトレーダー、長期投資家のいずれであっても、Future Trend Channelはトレンドの強さを可視化し、反転を予測し、エントリー/エグジットポイントを最適化するのに役立ちます。 主な特徴: マルチタイムフレーム対応 - 外国為替、株式、商品、暗号通貨を含む全ての時間軸と金融商品で動作 スマートトレンド検出 - SMA、ATR、HL2(高値-安値の平均)を組み合わせて強気・弱気のトレンドチャネルを動的にプロット 未来価格予測 - 現在のトレンド勾配に基づいて潜在的な将来価格レベルを投影し、取引計画を支援 明確な視覚的シグナル - 強気・弱気シグナルがトレンド確認を示し、色分けされたチャネルが市場状況に適応 カスタマイズ可能なパラメー
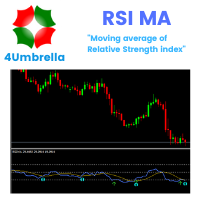
Indicator MT4 : RSI MA is Moving average of strength index
Objective : Find entry price for the good trade
How to set up indicators RSI MA : 1. RSI period 14. 2. MA you can set calculate price and method price. 3. MA period 9. 4. Arrow setting : 6 types. 5. Alert setting : Next bar or Instant bar. 6. Choose display for 1 or 2 calculation by formula.
How to trade for success : Entry point : Buy / Long position 1. When arrow up direction show 2. TP : RSI OVB
Entry point : Sell / Short position

このインジケーターや その他のインジケーターを無料で 入手: インジケーターを取引ロボットに変換(プログラミング不要) 特別オファー : ALL TOOLS 、各 $35 、 期間限定 ! 新しいツール になります 30ドル のために 最初の週 または 最初の3回の購入 ! MQL5 の取引ツール チャネル: 私の MQL5 チャネルに参加して最新の更新を受け取ります マルチタイムフレーム & マルチシンボルガイド: マルチタイムフレーム & スキャナ ユーザー ガイド - 12 か国語で利用可能 MT5 のバージョンは次の場所で確認できます。 Volume-Trend Order Block MT5 Multi-Timeframe Scanner MT4 のバージョンは次の場所で確認できます。 Volume-Trend Order Block MT4 Multi-Timeframe Scanner その他の製品については、次のサイトをご覧ください。 すべての製品 または 取引指標、特別オファー & 新しいリリース Volume-Trend

It predicts the most likely short-term price movement based on advanced mathematical calculations.
Features Estimation of immediate price movement; Calculation of the real market trend; Calculation of the most important support and resistance levels; Algorithms optimized for making complex mathematical calculations with a minimal drain of system resources; Self-adjusting for better performance, so it’s able to work properly at any symbol (no matter how exotic it is) and any timeframe; Compatibl

Scalping signals M1 を購入した方全員に、 本インジケーターのシグナルに基づいて自動売買を行う EAロボットを無料プレゼント します。 Scalping signals M1 — M1向けトレンドスキャルピング完全エントリーシステム Scalping signals M1 は、チャートをわかりやすい行動マップに変えるインジケーターです。
カラートレンドチャネルが市場の方向を示し、矢印がエントリーポイントを知らせます。
チャネルの方向と矢印に従うだけでよく、初心者でも簡単に扱えます。 インジケーターは特に M1 で優れた性能を発揮し、
XAUUSD(ゴールド)、ポンド、ドルの主要通貨ペア、クロスなど、ほぼすべての通貨ペアに対応しています。
アラートとメール通知を搭載しているため、シグナルを見逃しません。 基本コンセプト Scalping signals M1 は使いやすい外観とは対照的に、内部では高度なアルゴリズムが動作しています。
視覚的に表示されるのは以下の2つだけです。 – トレンド方向を示すチャネル
– トレンド継続が期待される位置での Buy/Sell 矢印

Multi Oscillator Divergence MT4 – RSI, CCI, MACD, OBV, Stochastic & AO
Multi Oscillator Divergence MT4 は、1つの強力なツールで6種類の人気テクニカルオシレーターを使用し、トレーダーが強気および弱気のダイバージェンスを識別できるように設計された、高度な Forex divergence indicator です。 複数のインジケーターを切り替える代わりに、この MT4 Divergence Indicator は RSI、CCI、MACD、OBV、Stochastic、Awesome Oscillator (AO) を分析し、潜在的なダイバージェンスと複数インジケーターによるコンファメーションをチャート上で直接、明確に確認できます。
Key Features 1. 1つのインジケーターに6つのオシレーター
1つのMT4インジケーターから RSI、CCI、MACD、OBV、Stochastic、AO を使用してダイバージェンスを検出します。 2. 個別オ

The Forex Master Pattern is an alternative form of technical analysis that provides a framework which will help you to find and follow the hidden price pattern that reveals the true intentions of financial markets. This algorithm here does a good job detecting the Phase 1 of the Forex Master Pattern cycle, which is the contraction point (or Value).
On Phase 2 we get higher timeframe activation (also called Expansion), which is where price oscillates above and below the average price defined

Neuro Athena is an absolutely new way to get precise entry and exit trading signals. It uses the Fibonacci sequence as the basis for the calculation of its levels. With Neuro Athena you will always know when to open and close your trades with confidence. Message me and get Neuro Athena Assistant as a gift to automize your trading process! Why should you choose Neuro Athena? 1. Reliable Algorithm. Fibonacci sequence is not a new-age marketing slop that feels the Internet nowadays - it is one of
FREE

Crystal Volume Profile Auto POC (MT4) — 自動POC付き出来高プロファイル 概要
Crystal Volume Profile Auto POC は MetaTrader 4 用の軽量で最適化されたインジケーターです。価格ごとの出来高分布を表示し、最も取引量が集中した価格 (POC) を自動的に強調します。これにより、隠れたサポート・レジスタンスや機関投資家の活動を簡単に把握できます。 MT5版も利用可能: Crystal Volume Profile Auto POC (MT5) 。 主な機能 自動POC検出 動的ボリュームプロファイル (可視範囲またはカスタム範囲) 固定プロファイルで詳細分析可能 ヒストグラムサイズ・色・ラインスタイルの調整可 各ローソク足で自動更新 Reset VP と Hide VP ボタン搭載 ライト/ダークテーマ対応 利用するメリット 蓄積・分配ゾーンを特定 高出来高のブレイク/リジェクトゾーンを検出 機関投資家の活動を確認 POCを基準に正確なエントリー/イグジット 反転・継続戦略の信頼性向上 使い方 (MT4)
FREE
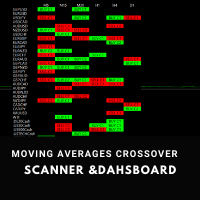
Moving Average Crossover Scanner and Dashboard Advanced Moving Average Scanner Moving Average Crossover Dashboard The indicator scans the market and sends signals and alerts for Moving Averages crossovers, death cross and golden cross. Crossovers are one of the main moving average ( MA ) strategies. MA Crossover ( cut ) strategy is to apply two moving averages to a chart: one longer and one shorter. When the shorter-term ( fast MA ) MA crosses above the longer-term ( slow MA ) MA, it's a buy sig

スイートVWAPオックスで時間を節約し、より正確な意思決定を行いましょう まだMetatrader 4の 無料VWAPインジケータ をダウンロードしていない場合は、今すぐダウンロードして、アンカー付きの素晴らしいVWAP視覚化機能を体験してください。その後、ここに戻ってスイートVWAPオックスを知ってください-あなたのスイートVWAPインジケータの完璧な拡張機能。 スイートVWAPをクリックするだけで、このVWAPインジケータを任意のポイントに固定できるため、手動で設定する必要がなく、時間を節約できます。さらに、このインジケータは、大手機関が取引し、注文を配置している重要なポイントに関する貴重な情報を提供するため、より正確な意思決定を行い、独自の取引戦略を設定することができます。 アンカー付きのVWAPを手動で設定しようとするのに時間を費やす必要はありません。今すぐスイートVWAPオックスを購入して、市場分析を新たなレベルに引き上げてください。これは、金融市場で成功を収めたい真剣なトレーダーにとって貴重な投資です。 スイートVWAPを無料でダウンロードして、グラフのさまざまなアンカーポ

Super Signal – Skyblade Edition
プロ仕様のノンリペイント / ノーラグ・トレンドシグナルシステム。卓越した勝率を実現 | MT4 / MT5 対応 1分足、5分足、15分足などの低い時間足で最も効果を発揮します。
主な特徴: Super Signal – Skyblade Edition は、トレンド取引に特化したスマートなシグナルシステムです。マルチレイヤーのフィルターロジックを用いて、明確な方向性と実際のモメンタムに支えられた強力なトレンドのみを検出します。 このシステムは 天井や底を予測するものではありません 。次の3つの条件がすべて満たされた場合にのみシグナルを発生させます: 明確なトレンド方向 モメンタムの増加 健全なボラティリティ構造 市場セッションに基づく流動性分析と組み合わせることで、シグナルの精度とタイミングがさらに向上します。 シグナルの特性: すべての矢印シグナルは 100% 非リペイント / 遅延なし 一度出現したシグナルは固定され、点滅・消失しません チャート上の矢印、情報パネル、ポップアップ通知、音声アラート、プッシュ通知

これはMT4のインジケーターで、再描画なしで取引に参入するための正確なシグナルを提供します。 外国為替、暗号通貨、金属、株式、インデックスなど、あらゆる金融資産に適用できます。かなり正確な見積もりを提供し、取引を開始して終了するのに最適な時期を教えてくれます。1つのシグナルを処理しただけでインジケーターの元が取れた例の 動画 (6:22)をご覧ください。Entry PointsPro インジケーターの助けを借りたほとんどのトレーダーの最初の1週間の結果が改善しています。 Telegramグループ に登録してください。Entry Points Proインジケーターのメリットは次の通りです。 再描画のないエントリーシグナル
再描画されるインジケーターでは一度表示されたシグナルが削除されて大きな金銭的損失につながることがありますが、これと異なり、表示されて確認されたシグナルは消えることがありません。
エラーなしの取引開始
インジケーターアルゴリズムによって取引を開始する(資産を売買する)理想的な瞬間を見つけることができます。それを使用するすべてのトレーダーの成功率が向上します。
あら

SMC All-in-One: Market Structure and Liquidity The SMC (Smart Money Concepts) Analytic Indicator automates price action analysis based on the Smart Money Concepts approach. Instead of drawing levels manually, the indicator labels internal and swing market structure, order blocks, fair value gaps and liquidity levels on the chart in real time.
By identifying where institutional participants are likely placing orders, this indicator helps you find optimal Points of Interest (POI) for more precis
FREE

Pivot Tide — ウェーブのピボット、自動トレンドライン、ラインに基づくトレンド方向の判定 Pivot Tide は MetaTrader 4 用のインディケータです。チャートを自動的にウェーブに分割し、各ウェーブの高値と安値にマーカーを付け、それらを結んでトレンドラインを引き、ラインの状態からトレンドの方向を判定します。すべてチャート上に直接表示され、コンパクトな情報パネルも備えています。 あらゆる銘柄、あらゆる時間足で動作します。 MT5-version: https://www.mql5.com/en/market/product/199662
機能 ウェーブを検出します。 ウェーブは 2 本の移動平均線の関係で定義されます。短期の SMA と長期の LWMA です。短期線が長期線の上にある間は上昇ウェーブ、下にある間は下降ウェーブです。 ピボットをマークします。 ウェーブが終了すると(移動平均線が交差すると)、その極値にマーカーを置きます。上昇ウェーブの高値、または下降ウェーブの安値です。 トレンドラインを引きます。 連続する同種のピボット 2 点を結びます。 ライ

Dynamic Forex28 Navigator - 次世代の Forex 取引ツール。 現在 49% オフ。
Dynamic Forex28 Navigator は、長年人気のインジケーターを進化させたもので、3 つの機能を 1 つにまとめています。 Advanced Currency Strength28 インジケーター (レビュー 695 件) + Advanced Currency IMPULSE with ALERT (レビュー 520 件) + CS28 コンボ シグナル (ボーナス)。
インジケーターの詳細 https://www.mql5.com/en/blogs/post/758844
次世代の Strength インジケーターが提供するもの オリジナルで気に入っていたすべての機能が、新機能と精度の向上によって強化されました。
主な機能: 独自の通貨強度計算式。 すべての時間枠でスムーズかつ正確な強度ライン。 トレンドの特定と正確なエントリーに最適です。
ダイナミックマーケットフィボナッチレベル (マーケットフィボナッチ)。 このインジケーターに固有

スイングトレーディング は、トレンドの方向のスイングと可能な反転スイングを検出するように設計された最初のインジケーターです。トレーディングの文献で広く説明されているベースラインスイングトレーディングアプローチを使用します。インディケータは、いくつかの価格と時間のベクトルを調査して、全体的なトレンドの方向を追跡し、市場が売られ過ぎまたは買われ過ぎて修正の準備ができている状況を検出します。 [ インストールガイド | 更新ガイド | トラブルシューティング | よくある質問 | すべての製品 ]
むち打ちを起こさずに市場スイングの利益 インジケーターは常にトレンドの方向を表示します 色付きの価格帯は機会のベースラインを表します 色付きのダッシュは、可能な反転スイングを表します この指標は、独自の品質とパフォーマンスを分析します 複数時間枠のダッシュボードを実装します カスタマイズ可能なトレンドおよびスイング期間 電子メール/サウンド/プッシュアラートを実装します インジケータは再描画またはバックペインティングではありません
Swing Tradingとは Swing Tradingは

** All Symbols x All Timeframes scan just by pressing scanner button ** Discount: The price is $100$, But now it is just 39$, Limited time offer is active.
*** Contact me to send you instruction and add you in "Trend Reversal group" for sharing or seeing experiences with other users. New Update: 2026/10/11 Introduction: Trendlines are the most famous technical analysis in trading . Trend lines continually form on the charts of markets across all the different timeframes providing huge

The AI That Puts You Ahead of the Market
You're Losing Trades – And It’s Not Your Fault. The market is ruthless. You analyze charts, test strategies, follow indicators—yet profits slip through your fingers. Why? Because traditional trading forces you to guess. What if you didn’t have to?
Most strategies are based on hope, not proof. You wouldn’t gamble your money in a casino, so why trade without statistical certainty?
TRADE EXTRACTOR Changes Everything.
This is not just an indicator. It’s

Automatically detect bullish or bearish order blocks to optimize your trade entries with our powerful indicator. Ideal for traders following ICT (The Inner Circle Trader). Works with any asset type, including cryptocurrencies, stocks, and forex. Displays order blocks on multiple timeframes, from M2 to W1. Alerts you when an order block is detected, migrated, or a higher timeframe order block is created/migrated. Perfect for both scalping and swing trading in Smart Money Concepts. Enhanced by st
123456789101112131415161718192021222324252627282930313233343536373839404142434445464748495051525354555657585960616263646566676869707172737475767778798081828384858687888990919293949596979899100101102103104105106107108109110111112113114115116117118119120121122123124125126127128129130131132133134135136137138139140141142143144145146147148149150151152153154155156157158159160161162163164165166167168169170171172173174175
MetaTraderマーケットは、履歴データを使ったテストと最適化のための無料のデモ自動売買ロボットをダウンロードできる唯一のストアです。
アプリ概要と他のカスタマーからのレビューをご覧になり、ターミナルにダウンロードし、購入する前に自動売買ロボットをテストしてください。完全に無料でアプリをテストできるのはMetaTraderマーケットだけです。

取引の機会を逃しています。
- 無料取引アプリ
- 8千を超えるシグナルをコピー
- 金融ニュースで金融マーケットを探索