YouTubeにあるマーケットチュートリアルビデオをご覧ください
ロボットや指標を購入する
仮想ホスティングで
EAを実行
EAを実行
ロボットや指標を購入前にテストする
マーケットで収入を得る
販売のためにプロダクトをプレゼンテーションする方法
MetaTrader 4のためのテクニカル指標 - 95

Description
Bitcoin Manager is the best indicator for trading Bitcoin cryptocurrency. It is calculated based on the price deviation from the moving average line channel. Ascending and descending arrows indicate potential points and levels for opening buy and sell positions.
How to use?
We strongly recommend using this indicator on the H1 timeframe. An up arrow indicates a buy level. Down Arrow - Sell Level.
Parameters
Maximum History Bars - maximum count of history bars to calculate. _GRAP
Binary options are the markets where the selected assets are traded according to the estimates in which direction they will move in a certain period. What is called active; are investment tools such as stocks, foreign exchange and gold.
For example; You think one of these instruments will move up in 10 minutes. You have purchased one of the suitable options. When your expectation comes true at this expiry, you will earn almost double your money.
The logic of the market; to make predictions ac

RoboS Indicator Version 1.5 The RoboS Indicator is a trading tool designed to enhance your market analysis. With advanced features such as Buy and Sell signals, it simplifies decision-making for traders across all experience levels. This indicator is compatible with all symbols and timeframes, making it a versatile addition to any trading strategy.
Features Signal Arrows: Clearly identify Buy and Sell opportunities with optional arrows. Customizable Alerts: Receive notifications on your mobile

This strategy is best used for Trend based trading. While market is trending, price still makes smaller ranges. Darvas boxes show breakouts from these small ranges, while still following the original market trend. Detailed Description: https://www.mql5.com/en/blogs/post/747919
Features:
Darvas - Check Darvas Box Breakout
- Check Price Above/Below MA or Darvas Box has crossed MA
- Min, Max Box Height
- Max Distance Between Entry Price and Darvas Box
Other Indicators:
- NRTR Trend Check
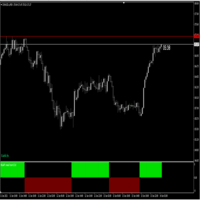
Follow Trend indicator , indicator works on Currencies , Indices ,Stocks Gold etc , good for follwoing trend on the markets suitable for scalping Buy Rules; When the histo changes to Blue you place buy order ,stop loss just below the previous swing low Sell Rules; When the histo changes to Red you place sell order ,stop loss just below the previous swing high Trade on a timeframe which best suits your trading style

Day Trades Resistance and Support (daytradesSR) is an indicator composed of 1. The main line (support/resistance line), which shows i. either UP or DOWN trend ii. levels of dynamic support or resistance 2. A specific range defined by a line for range high and another line for range low. These lines serve as weak secondary support or resistance . 3. When the main line (support/resistance line) is first hit by the price after a detected trend reversal , either an UP ARROW (sup

Are you unhappy with the size of the main chart when using oscillators? You can add MACD, RSI, Stochastic, ATR and Momentum indicators using Main Chart Oscillators. Vertical Size : Vertical size of indicator's window Drawing Mode : Add Oscillators on same section or create a new section for any of them Draw Top Line : Draws a line in the top of indicator's section to separate it Top Line Style : Style of top line Top Line Color : Color of top line Top Line Width : Width of top line Show Indicat
Any Moving Average draws a moving average of * any indicator in a sub-window. Many Indicators included with MT4 are supported by default. You can add custom indicators as well. Settings Name Description Timeframe Select timeframe for calculation Source Indicator Select Indicator Custom Indicator Name Enter Custom Indicator Name ( when Source Indicator is set to Custom) Indicator Settings Source Indicator parameters ( separated by comma ) Moving Average Settings Moving Average parameters (

Hello Traders, A very simple but useful tool for an automatic traders. An indicator that allows you to adjust the speed of the strategy tester in a very simple way. Just drag the indicator into the chart before launching the strategy tester and adjust the speed manually, and that's all! Buttons can be located in any part of the chart as you like, just enter the x and y coordinates --------------------------------------------------------------------------------------------------------------------
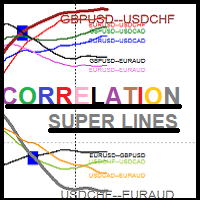
SUPER Correlation Lines for Symbols Multi timeframes Multi Currencies Indicator Each line indicates 2 symbols correlation based on Multi timeframes symbols strength calculations
5 symbols -> 10 correlation indicator lines Strategy:1 is based on selecting the NEW weaker/stronger correlation line : *****New Weaker Line Crossing DOWN the old weaker line : SELL SYMBOL1 && BUY SYMBOL2 *****New Stronger Line Crossing UP the old weaker line : BUT SYMBOL1 && SELL SYMBOL2
You close trades when n

Perfect Entry Spotter Indicator with Alert is based on a combination of Support Resistance, Fractals, Alligator and Moving Average indicators, based on an intense research. It has alert included with option to enable/disable it. You can trade based on it with high accuracy. Recommended trading rules: 1. Buy - Wait for the Lime arrow to appear and trade in the direction of the trend (trend going up). 2. Sell - Wait for the Red arrow to appear and trade in the direction of the trend (trend going d
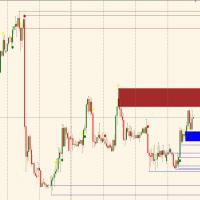
It automatically tracks the supply and demand zones and indicates the current trend. Once you have identified the trend on the main time frame just wait for the price on the operating time frame to arrive in the near future of a demand (buy) or supply (sell) zone and execute the trade. It is recommended to wait for the higher time frame trend and operational time frame to be aligned and operate exclusively on the areas indicated by the. Developed the right awareness you can achieve more and more
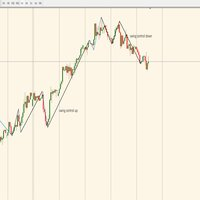
Indicator automatically translates control swings (trend-dominated market) and correction swings (retracing market); It is a simple indicator to be combined with your strategies in order to improve them and enter the market only when the trend is in control; Check on the largest time frame how the market is moving (swing black color control or swing blue color correction) from here, going down from time frame to set its operation in the direction of the trend. OPERATIONAL EXAMPLE: LOCATE DOWNWAR

We Trade Live Trend Max 500-1000 Pips Our team of engineers have programmed a great tool which we have used to success and will aid you in making better decisions when placing a trade, it is better than anything available on the market at the moment! try & Test Against other products and see for yourself how amazing this is. Our Main Objective is to help you as traders discover how you can take a simple trading setup and make consistent profits. We provide the fundamentals needed to trade the ma

We Trade Live Trend Levels This indicator is a fantastic addition to the We Trade Live Trend Max this helps filter out noise and helps with better entries into a trade this add on is a must have and we use it all the time along side We Trade Live Trend Max this is a fantastic tool to help with entering a trade and exiting a trade, This indicator Calculates Volume strength indicating levels of support and resistance for a trade, measures momentum in a market making buying or selling into the

This indicator identifies the major and minor swing high and low points on a chart. It then takes the most recent swing and draws a fibonacci pattern of retracement and extension levels to give you an idea of where price may move next. It allow allows you to set a pair of moving averages to help identify the direction of the overall trend. There are configuration parameters for the major and minor swing and the moving averages.
indicator for binary options the signal appears along with the opening of a new candle and signals it complete lack of redrawing recommendations buy signal blue arrow pointing up sell signal red arrow pointing down expiration time and recommended 1 candle of the timeframe used if the trade turns out to be unprofitable, you can increase the amount and open the trade again on the next signal the instrument is easy to set up, only two periods Optimal settings are already set by default the indicato

LinearRegressionDecomposition ( LRD ) Linear Regression Decomposition has been calculated using a very complex method.
Basically, by examining the retractions of the price movements of the instruments on the Metatrader platform, it is aimed to decompose these movements linearly.
The indicator is shown on the graph with two separate lines.
The red line is our main indicator and handles the price divergence.
The blue line filters the red signal.
For example, for a buy signal to occur: the red line

After Purchase, Please Contact
t.me/hakimsann
These Indicator are Mixed on All Logical Value Such As
Trend
Support and Resistance
Candle Pattern
Price Action
we Combine
2 Bollinger Band
6 Zigzag Periods
4 Relative Strength Index Period
1 MACD Trend
Support and Resistance
Price Action
Pattern Candle
Avoiding Doji On Market Can Be Applied On Every Market
24-7
Maksimum Martingale lv 5.
First stake 0.4% Balance

Murrey Math Multi Timeframe Indicator Support/Resistance
Murrey Math Lines are strong tools to plot the support and resistance levels.
Murrey Math Multi Timeframe Indicator draws multi timeframe MM lines on a smaller tf chart.
General Information: According to Gann, prices move in 1/8's, these 1/8's act as points of price support and resistance as an entity's price changes in time. Given this 1/8 characteristic of price action, Murrey assigns properties to each of the MML's in an a given oc

We Trade Live Trend Entry & Exit is another fantastic addition to the the We trade Live trend Indicator collection This Indicator works fantastically well with our other Indicators. This Indicator is primarily used to enter a trade & Exit a Trade , and to alert you when you could possibly take a short or long on a current trend , it provides alerts on when there is a change in direction on the trend you are trading but please make sure you take into account all variables, before entering a trade

The Velocity of price change ( VP ) indicator shows the average rate of price change at those characteristic time intervals where this rate was approximately constant. The robust algorithm used in VP to smooth out the price from its random jumps, ensures the reliability of the indicator reading, which does not react to simple price volatility and its insignificant movements. The indicator allows you to track trends and the moments of their reversals , during which t

コアラトレンドラインの紹介: この指標は、トレーダーがトレンドをよりよく見つけるのに役立つように作成しました。このインジケーターは、現在のトレンドラインを示すことができます。 ご存知のように、傾向線は2つの最高点または最低点の間にある必要があります。 したがって、基本的なロジックは、最高点と最低点を見つけることです。 インジケーターは、履歴の最高点と最低点をすべて見つけ、それらを赤と青の点で示します。 これらの最高点と最低点は、深度値に従って計算されます。深度値は調整可能であり、ユーザーが変更できます。 深さはどういう意味ですか? 深さが10の場合、最も高いキャンドルホルダーは10本のキャンドルの中で最も高いはずです。前の5番目と次の5番目のキャンドルホルダーの間に最も高いキャンドルホルダーがあるはずです。 深さが10の場合、周囲の10の間の最低のろうそくが最低であり、周囲の5から5の間の最低のろうそくが次のろうそくであることを意味します。 [XTHに接続]オプションはどのように機能しますか? 指標は下降トレンドラインを描くために2ポイントを必要とします。彼は反対方向を見て、2番目の

The ATR Levels Indicator For MT4 is an indicator that is built specifically for traders who use the Meta Trader 4 for their trading analysis, charting of different currency pairs and trading assets, doing their technical analysis and making trading decisions all through the trading day as they work.
One of the first major advantages of using the ATR Levels Indicator For MT4 is that it automatically helps the trader to spot very important levels in the markets based on the Average True Range Ind
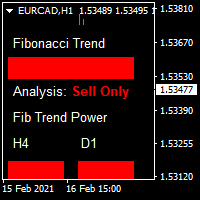
Our buy and sell indicator provides precise entry points, guiding you on when to buy and sell while indicating the trend bias. This tool minimizes drawdowns and increases your winning percentage by aligning with the trend. Buy signals are represented by blue boxes alongside candles, signaling optimal entry points. Conversely, red boxes indicate sell signals. Additionally, the secondary indicator, Fibonacci trends, further enhances decision-making by complementing the primary signals.
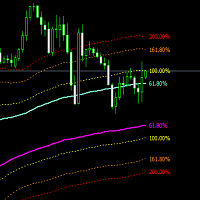
DYNAMIC CHANNEL Forex is a Metatrader 4 (MT4 (MT4)) indicator and the essence of this technical indicator is to transform the accumulated historical data. Forex DYNAMIC CHANNEL Indicator provides for an opportunity to detect various peculiarities and trends in price dynamics which are invisible to the naked eye. Based on this information, traders can assume further price movements and adjust their strategy accordingly.
Dynamic channel, which is calculated based on the maximum distance between

What Is Currency StrengtT Indicator?
A currency strengthT indicator is a graphical tool that shows the strength of a currency. Common indicators usually show the strength of a currency in relation to another currency, however, with some calculations it is possible to find the absolute strength of each individual currency.
Therefore, a currency strength matrix indicator (or meter) is a tool that tries to express the absolute strength of a currency, so that you can compare this strength with the

The trading system is designed to work with gold on time periods: 30M, 1H. The indicator allows you to adjust to the market situation.
Parameters for 1H : PERIOD=9F , FILTER=300 .
Parameters for 30M : PERIOD=22B , FILTER=450 .
A small adjustment to a specific broker is allowed .
If you change the amount of history displayed, you may also need to adjust the parameters.
The indicator is not redrawn.
"Gold n XAU" uses different rules for entering a trade and different rules fo
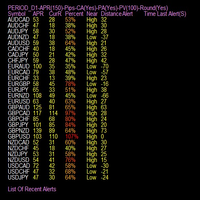
Indicator is able to alert by pop and acoustic alarm the achievement of the average price range of the last periods so as to be able to set our operation. It allows different percentage variables reached and periods of variation according to the parameters entered. Apply your reverse strategies to achieving that threshold so you get higher success rates. Indispensabile per le strategie reverse intraday.

コーシー分布は、ファットテール分布の典型的な例です。太い尾は、確率変数が中央の傾向から逸脱する確率が非常に高いことを示しています。したがって、正規分布の場合、確率変数の数学的な期待値からの3標準偏差以上の偏差は非常にまれであり(3シグマルール)、コーシー分布の場合、中心からの偏差は任意に大きくなる可能性があります。このプロパティは、市場の価格変動をシミュレートするために使用できます。したがって、コーシー分布は、予期しないおよび/または予測できない要因によって引き起こされる大きくて急激な価格変動を除外することができます。 インジケーターを使用すると、使用する価格を選択できます。また、そのインジケーター操作は、次のパラメーターを使用して構成されます。 iPeriod-計算するバーの数 PercentLvl 1-3-レベルの偏差(パーセント)、許容値は0より大きく100未満(デフォルトでは-50、20、10パーセント) Shift-レベルの継続を右に トレーディングでのこの指標の使用は、価格が最高または最低レベルを超えた後、平均値に戻る可能性が高いという仮定に基づいています。つまり、価格が

!!!!UPDATED VERSION!!!!
Multi Currency Strength Indicator is the ultimate simple multi-currency strength dash meter that consists of Signal provider and automated labelled levels, that is effective for beginners and seasoned traders to enhance their strategies. The Author coded the program for the aim of bringing simplicity yet effective indicator that is user-friendly for all who use it. Try it out , its worth a try. INDICATOR INCLUDES: 1.Push Notification to get notifications on MT4 App on

This indicator XX Power indicator.Indicator displays trend movement. Indicator helps to buy and sell.In dicator displays arrow and line. Features
FiltPer - displays indicator period.
How to understand the status: If the Trend color is green, trend is up. I f the Trend color is red, trend is down.
//////////////////////////////////////////////////////////////////////////////////////////////////////////////////////////////////////////////////// ////////////////////////////////////////////
Start Signal is one of the most reliable tools for trading in the financial markets With the help of Start Signal, you can trade both Bnary Options and other markets Such as Forex Initially, Start Signal was developed for Binary Options But during the trading, it was decided that it is also well suited for scalping Moreover, it provides good accuracy Perfect for both beginners and experienced traders The signals are extremely simple and straightforward You don't need to analyze a lot of infor

the indicator is designed for trading in financial markets for scalping, pipsing the tool uses support and maintenance levels in its algorithm own strategy and unique development signals up arrow buy down arrow sale recommended for use on timeframes up to 15 m you can trade from signal to signal pay attention to the transaction no more than 2% of the deposit.
A good and reliable tool if you follow the rules of money management Developed according to its own strategy on a unique algorithm The indicator is completely sharpened for binary options Binary Luck is very easy to use, nothing needs to be configured Just add to the chart and you can start trading Perfect for both beginners and experienced traders Signals are simple and straightforward Up arrow buy Down arrow sale Recommended time of expiration and 1 candle For one deal no more than 3% of the d
We Trade Live Trend Candle Stick can help identify potential trend in the market when trading, spot market trends and predict future prices. We Trade Live Trend Candle Stick has a smoother look, as it is essentially taking an average of the movement. candles will stay RED during a downtrend and Green during an uptrend . We believe It's useful for making candlestick charts more readable and trends easier to analyse. As a breakout trader you are looking for trades that are ‘breaking out’ of
As a trader you are looking for to enter trades at the perfect time. This indicator takes advantage of any price action and indicates when a certain level has been made and a potential break out is going to be made. THIS IS BEST USED ON THE 1DAY CHART WITH WE TREND LIVE MAX Check LTF (Check Long time frame) feature added to 5mins , 15mins, 30mins 1hr & 4Hr chart which will check the trend on all frames times in particular the 4hr trend. so if a alert is received to buy or sell and the trend is

Definition : VPO is a Volume Price Opportunity. Instead of using bars or candles with an Open, High, Low, and Close price, each "bar" in a Market Profile is represented by horizontal bars against the price It is called Market Profile terminology.
In other words volume-price-opportunity (VPO) profiles are histograms of how many volumes were traded at each price within the span of the profile.
By using a VPO chart, you are able to analyze the amount of trading activity, based on volume, for each

Back testing can't; get indicator full performance
Trading the currency markets is a complex business. With so many pairs and multiple timeframes it is almost impossible to monitor them all – but with with the Currency Heatmap you can. The Currency Heatmap indicator delivers the information you need to base your trading decisions on the entire spectrum of currency pairs derived from the 8 major currencies; namely the US dollar, the Euro, the British Pound, the Swiss Franc, the Japanese Yen, t

Fibonacci Magic Pivot Levels The Fibonacci Magic Pivot Levels is a powerful yet easy to use indicator . It continuously monitor s intra-day price action and uses complex algorithms to calculate and detect key support, resistance and pivot levels, using the D1 timeframe as a filter. The Fibonacci Magic Pivot Levels is optimized for H4, H1, M30, M15, M5 & M1 timeframes and can be used on ALL Currencies, Indices, Commodities, and Cryptocurrency pairs . Trade with improved confidence an

This indicator is a must have tool that scans the active chart for candlestick patterns. It labels each bar according the candlestick pattern(s) that it finds enabling you to more easily analyze price action and be more informed about your trading decision. There are 103 common and uncommon possible patterns plus 6 new patterns based on research that the indicator can identify. If a candlestick(s) meets the requirements for multiple patterns, the bar will be labeled with up to 4 patterns names f
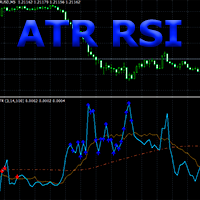
Composition of ATR and RSI indicators.
The ATR RSI indicator compares two calculations of the ATR indicator with the Fast and Slow periods on one chart, plus the line of the average and the overbought and oversold zones of the RSI indicator.
ATR shows the values of the volatility change in the currency pair in points, taking into account the period specified as a parameter. The entry points provided by the RSI indicator show a very good risk-reward ratio in volatile and trending markets. ATR RS

Follow a step-by-step system that detects the most powerful breakouts!
Discover market patterns that generate massive rewards based on a proven and tested strategy.
Benefits You Get On Indicator: Unique price action based algorithm. Powerful combination to any trading strategy. Auto-detects entry, exit, stop loss & take profit levels. Auto-calculates statistics of signals. Never repaints, never backpaints, never recalculates. Signals strictly on the "Close of the bar". Works in all symbols a

XMaster Scalping NEW - a simple indicator that determines the beginning and end of a trend. It can be said very well, even ideal for both scalping and medium / long-term trading. When plotted on a chart, it is located in the basement, which gives you the opportunity to draw trend lines / levels on the price and look into the basement at the indicator.
How to use: It's simple. Sale yellow, buy green. The colors can be changed in the settings.
Additional trading information: Works best on t

The indicator helps the trader in identifying potential liquidity levels. The algorithm used in this indicator checks the behavior of the asset taking into account the price levels, momentum and volume analysis.
Features:- Parameters for signal optimization and alerts.
Usage:- The levels formed by the indicator can be helpful to traders in identifying potential entries, breakouts or reversals. it can assist traders of technical trading background or even pure price action trading. Examples of

Definition : TPO is a Time Price Opportunity. Instead of using bars or candles with an Open, High, Low, and Close price, each "bar" in a Market Profile is represented by horizontal bars against the price It is called Market Profile terminology.
In other words time-price-opportunity (TPO) profiles are histograms of how much time was spent at each price within the span of the profile.
By using a TPO chart, you are able to analyze the amount of trading activity, based on time, for each price level

This indicator shows a candlestick combination based on dodge, dodge and pin-bar. This combination is similar to fakes, but has a different logic. The logic is to be on the side of the force after the uncertainty. It has proven to be effective. You also get a quick guide to using the indicator and my almost 24/7 support. The indicator is universal and useful for trading binary options (you will receive additional rules on this issue), forex, ETF, cryptocurrencies and much more. Supports timefram
Indicator for Binary options Binary Dream Trader Expiration time and 1 candle Timeframes from m1 to m15 No redrawing Any money management can be used If it is a martingale, the profitability will increase It is not recommended to use Martingale on a small account Signals Blue up arrow buy signal Red down arrow sell signal It is recommended to avoid trading during strong news releases

すべてのローソク足ライブラリは、ローソク足のバリエーションの本当に広い範囲を備えたインテリジェントなパターン認識システムを提供するインジケーターです! 一般的な同事や統合のバリエーションから、よく知られている勢いやブレイクアウトキャンドル、日常では見られない珍しいパターンまで、100を超えるキャンドルパターンがあります。
さらに、(100%正確ではありませんが、十分に公平な)統計が付属しています! キャンドルホルダーを表示するかどうかを選択し、それぞれのテキスト間隔、フォントの色とサイズを変更できます。
この指標は、特定の研究のための2年間の仕事からのものであり、99回のアクティベーションで購入できるようになりました。 それはあなたのために取引されていませんが、あなたはそれを欲するでしょう! (すぐに...)
はい、長期的には最新の状態に保たれます。
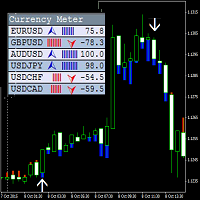
Данный индикатор рисует на графике стрелки, которые являются сигнала на вход и выход из сделки, а также в качестве фильтра индикатор окрашивает каждую свечу в синий и красный цвет. Дополнительно ко всему в левом верхнем окне показывается сила тренда и его направление по основным парам. У индикатора новая логика, которая существенно отличает его от множества аналогов. Он дает ранние сигналы на вход и на выход, свои значения не перерисовывает — то есть, если индикатор дал сигнал на вход в сделку,
The Perfect Supply & Demand Indicator for the MetaTrader 4 Platform ! It comes packed with the following features...
Supply & Demand Zones
The indicator charts Supply & Demand Zones on your favorite profiles. It works on all time frames and in all markets. Fresh & Used Zones
The indicator color codes each zone so that you know if it's fresh or not.
When the zone is no longer fresh it changes color, indicating that price have already traded at the level once or multiple times before. Structure
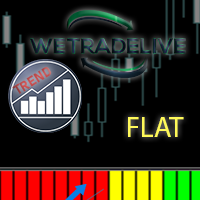
Being flat is a position taken by a trader in Forex trading when s/he is unsure about the direction of currencies trading in the market. If you had no positions in the U.S. dollar or your long and short positions canceled each other out, you would be flat or have a flat book
A flat market is one where there is little price movement; the market typically trades within a tight range, rather than forming a clear up or down trend. This indicator shows potential flat
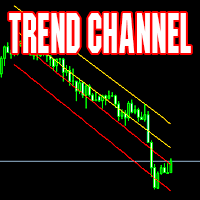
Channel indicator. Calculated dynamically. Suitable for both working in the direction of the trend and inside the channel. Excellent results when working on timeframes from 4H towards the center of the channel.
Example of use: when the price touches one of the extreme lines - opening a deal in the center of the channel with a take profit on the nearest middle line of the indicator. MT5 version The indicator can be used in expert advisors (4 buffers), receiving data in a standard way. Support:
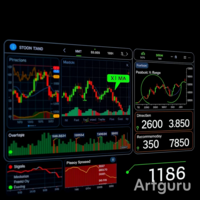
Multi Information Panel designed to give alot more precision to both trade entries and exits and provide an instant snapshot of a currency pair’s movement. Multi Information Panel works on any currency or timeframe (or it should) and displays the following in the bottom right corner of the chart..
A graph of Stochastic Oscillators on timeframes M1 up to D1. An indication of the market trend using EMA’s on timeframes M1 to D1. The direction of the MACD on the current chart, and crossing of the

Volume, momentum, and market strength are key indications that price is about to move in a certain direction. The Volume-solution indicator is one indicator which can help traders objectively classify a momentum type of trade setup as one having volume and strength or not. What is the Volume-solution Indicator? The Trading Volume indicator is a custom technical indicator which works somewhat like a market sentiment indicator. It indicates the strength of the bulls and the bears of the market. Wh

A universal tool for determining trends, flats and trading on graphical patterns. Combines the techniques of Gan, Elliot, and Murray. Just place it on the chart and it will show the direction and speed of the price movement, highlight the turning points.
Maltese cross will help you accurately determine the key points in the history, plan trading actions and accompany open transactions. Basic principles
Maltese Cross displays the Trend, Flat and Impulse lines before and after the selected momen

GoldTrend MT4 - is a leading indicator for Gold on MetaTrader 4
- In Update version has been added new ability on USD pairs
( AUDUSD, EURUSD, GBPUSD, NZDUSD, USDCAD, USDCHF, USDJPY )
- very easy to use , even for beginners
- Stoploss and Take Profit provided - no repaint, no redraw and no lagging
When you decide to enter the global market , then there is a technical skill you absolutely must have, - which is all about trends .
Why - GoldTrend is different from others :
Not only uptre

Action Alert indicator generates and writes data on the chart when performing any modification to the dead process. Expertise Properties: An audible alert is issued in the name of the operation and the labor that has been made You only need one chart Writes the processed operations in clear handwriting The font color can be controlled on the chart Setting Action Alert indicator
What is meant by it is to alert me any change in my deals of , it will reverse if any new deal comes out, al

With the purchase of the Auto-Harmonic Pattern Recognition Trading Software for MT4 , you will have access to: The Auto Harmonic Pattern recognition software is designed to take the heavy lifting out of a traders Harmonic trading strategy. The Software automatically Identifies and Projects Harmonic Pattern Completion Zones for the 6 most trade-able Harmonic Patterns. If the Pattern Completes in the projected zone, then there is a high probability of the resulting trade being successful. Pleas
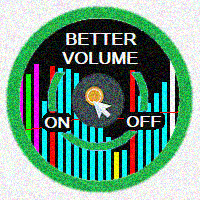
The Better Volume indictator improves the comprehension on volume by coloring the classical histogram bars . The colors point out differents nature of volume . Further through two buttons and without change the main chart it is possibile to change the time frames and navigate among three symbols . The alerts will work accordingly. For each symbol can be choosed the LookBack and Ma periods . The possibility to show/hide the indicator allows you to focus on the price .
The subwindow can be hide
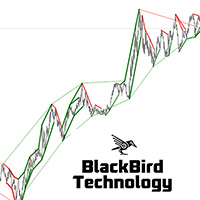
Multi Level Trend Direction is an indicator that identifies the most accurate buy/sell swing points with the highest probability, based on multi-level Zig Zag Swings. The indicator draws a color Zig Zag at the Higher Highs, Higher Lows, Lower Lows and Higher Lows in the chart, but based on two level Zig Zag Swing. If the fast price swing is in line with the trend of the slow price swing, then the buy/sell trend lines are bigger. If the price swing is against the trend, no lines are drawn to si
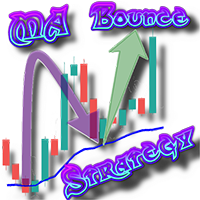
The MA Bounce Strategy is a strategy that seeks to long FX pairs on a strong uptrend as they bounce off their MA support and shorting FX pairs on a strong downtrend as they bounce off MA resistance. The best suitable periods of moving averages for that strategy are 18, 30, 50. This indicator helps to identify and find place for potential market entry by MA bounce strategy. Read More information about MA Bounce Strategy . By default MA Bounce Strategy indicator is configured for trading of M1

This is a volume profile where you can customize the time period you want. You can do this with a line or choose automatic functions such as showing the volume from the last time period. The indicator also shows the maximum volume value (VPOC - VOLUME POINT OF CONTROL) and the average value, colors and settings you can adjust as you like, there are many possibilities. If you need an indicator that shows the constant volume time frames there is ...HERE... Volume Profile is an advanced charting
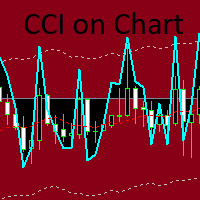
CCi indicator with dynamic levels based on the standard MA, taken as the basis for reading the levels, and modified data of the standard CCi relative to the MA. The input parameter CutCCi, if greater than 0, limits the vertical drawing of the CCi graph, but does not affect the calculations. There are 3 options for displaying arrows: arrows when crossing levels to exit the level zone - trend, arrows to return after exiting the level zone - reverse and crossing the zero level (red MA line). You ca
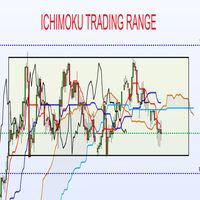
scanner de gamme commerciale Ichimoku: ne manqué plus le début d'une gamme. capable de suivre plusieurs paires cet indicateur surveille: les croisements de SSA et SSB (cela indique une forte possibilité de la mise en place d'un range) il identifie les bougies de retournements Il vous alerte quand les deux éléments apparaissent (croisement + bougies). vous pouvez ajouter le filtre du stochastique, ainsi l'alerte se fera seulement s'il y en compétemment le stochastique en surachat ou survente 80/

Concept of Market Profile was created at Chicago Board of Trade (CBOT) by trader Peter Steidlmayer and first published during the 1980s as CBOT product. Market profile by itself is not a stand-alone strategy, but a different way how you can view the market and make better trading decisions.
They have seen a market as an auction process which is affected by supply and demand the same way as every other auction, for example, development of prices of food, gas etc.
The price goes up as long th

The indicator builds "psychological levels": levels of round numbers and intermediate levels of round numbers.
Round numbers play an important role in forming support and resistance levels. There is a pattern in which the decline or growth of the price can stop at round numbers.
The level whose price ends at 0 is the level of a round number of the first order. Intermediate level, this is the level between two round levels, for example, between 10 and 20 this is level 15.
In the " Num_Zeros "
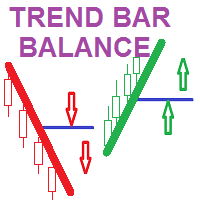
Trend Bar Balance Indicator Simple indicator based on trend detection and support resistance breakage It detects the major trend and the minor support and resistance levels *** a signal for UP /BUY is detected and alerted in a BULL trend and a resistance level break *** a signal for DOWN /SELL is detected and alerted in a Bear trend and a support level break THE POWER OF THIS INDICATOR I USE IT WHEN YOU COMBINE ITS DAILY SIGNALS FROM DIFFERENT CHART SYMBOLS AT SAME TIME AND CLOSE ALL ORDERS BY

DESCRIPTION:
The theory of the indicator is that currencies that are traded in the European session sleep at night. And when they wake up, they go to the golden mean of Fibonacci, their own way. At night, a channel is formed from which they want to get out, in the morning with renewed vigor on the road. The upper level of the channel is the buy zone.
The lower level of the channel is the sell zone. The objectives of the hike are marked with colors at the top and bottom.
The indicator outputs
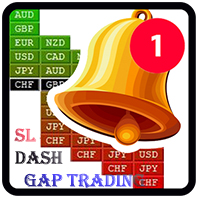
Here on some thoughts about the sl dash information and layout for strength indicators for clarity and view. We have Bid Ratio, Relative Strength, Currency Strength, Absolute Strength, Gap and Sync.
Bid Ratio is based on the current price as a percentage of the Day Range. This range can be based on the Day Bar (the time elapsed since the brokers open time) or Rolling (the last 24 hours).
Relative Strength is the Bid Ratio of a pair expressed in a range of gap diffrent value -9 to +9.
Currenc
MetaTraderマーケットは、他に類のない自動売買ロボットやテクニカル指標の販売場所です。
MQL5.community ユーザーメモを読んで、取引シグナルのコピー、フリーランサーによるカスタムアプリの開発、支払いシステムを経由した自動支払い、MQL5Cloud Networkなど、当社がトレーダーに対して提供するユニークなサービスについて詳しくご覧ください。
取引の機会を逃しています。
- 無料取引アプリ
- 8千を超えるシグナルをコピー
- 金融ニュースで金融マーケットを探索
新規登録
ログイン