YouTubeにあるマーケットチュートリアルビデオをご覧ください
ロボットや指標を購入する
仮想ホスティングで
EAを実行
EAを実行
ロボットや指標を購入前にテストする
マーケットで収入を得る
販売のためにプロダクトをプレゼンテーションする方法
MetaTrader 4のためのテクニカル指標 - 6

ONI FUSION PRO Institutional Flow Matrix for MT4 (機関投資家級・相関ダッシュボード / MTF完全対応版) 相場の「カンニングペーパー」を、あなたのMT4に。 機関投資家の資金フローを完全可視化する、次世代コックピット・システム なぜ「相関」を見ないと勝てないのか? 通貨ペアは単独では動きません。「ドル高」になれば、ユーロもポンドも円も、すべてその影響を受けて連動します。 この「見えない連鎖(相関関係)」を無視してトレードすることは、 目隠しで高速道路を運転するのと同じ です。 根拠のない逆張りで焼かれる 知らないうちにリスクを倍増させている 「なぜ負けたのか」が分からない ONI FUSION はこの連動性を可視化し、無駄な負けトレードを未然に防ぎます。 「相関」×「勢い」×「MTF」を融合した次世代コックピット 市場全体の資金フローを秒速で把握し、KATANAシステムで好機を逃さない。 チャートを1枚ずつ切り替えて確認するのは、もう終わりにしませんか? ONI FUSION は、単なる相関インジケーターではありません。

発見が困難で頻度が少ないため、分岐は最も信頼できる取引シナリオの1つです。このインジケーターは、お気に入りのオシレーターを使用して、通常の隠れた分岐点を自動的に見つけてスキャンします。 [ インストールガイド | 更新ガイド | トラブルシューティング | よくある質問 | すべての製品 ]
取引が簡単
通常の隠れた発散を見つけます 多くのよく知られている発振器をサポート ブレイクアウトに基づいて取引シグナルを実装します 適切なストップロスおよび利益レベルを表示します
設定可能なオシレーターパラメーター カスタマイズ可能な色とサイズ バー単位でサイズ別に分岐をフィルタリング パフォーマンス統計を実装します 電子メール/音声/視覚アラートを実装します 幅広い市場の見通しを提供するために、異なるオシレーターを使用して、干渉なしで同じチャートにインジケーターを何度もロードできます。このインジケーターは、次のオシレーターをサポートしています。 RSI CCI MACD オスマ 確率的 勢い 素晴らしい発振器 加速器発振器 ウィリアムズパーセントレンジ 相対活力指数 特に外国為替市場では、
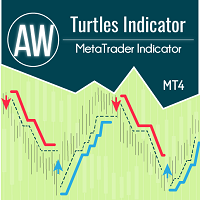
このインジケーターはタートル システムに従って機能し、古典的に 20 ローソク足と 55 ローソク足の時間間隔を想定しています。傾向は、指定された時間間隔にわたって監視されます。エントリーはサポートまたはレジスタンスレベルを下抜けた瞬間に行われます。出口シグナルは、同じ時間間隔のトレンドの反対方向への価格ブレイクアウトです。 利点:
金融商品: 通貨ペア、株式、商品、指数、暗号通貨 タイムフレーム: 古典的には D1、あらゆるタイムフレームでの作業にも適しています 取引時間: 24時間 資金管理戦略: 取引あたりのリスクは 1% 以下 追加注文を使用する場合、追加ポジションごとのリスクは 0.25% MT5 indicator version -> HERE / AW Turtles EA MT4 -> HERE / More products -> HERE エントリールール: 1) 短いエントリー: エントリー条件は20日間の高値または安値をブレイクアウトすることです。
前のシグナルが成功した場合、取引はスキップされます。
注記!以前の取引が利益で終了した場合
FREE

1. Compound Drawings (1) Line segment with arrow (2) Continuous line segment (broken line) (3) Parallelogram (4) Polygon (5) Profit and loss ratio measurement tools
2. Backtracking By the Z key in the process of drawing the line Line types that support Z-key backtracking: continuous line segments (broken line) ,channels,parallelograms,polygons, and fibo extensions.
3.Automatic Adsorption (1) Click the "Lock-Button" to switch the automatic adsorption switch before drawing the line (2) The

on demo mode use date to work. on version 13 wave added.13.1 histogram and trigger line can be changeble. wave can be set 200-500. can have different signal on wave 200 on version 14 ema used.so can see mountly chart signals also. up-down indicator is no repaint and works all pairs and all time frames charts. it is suitable also 1 m charts for all pairs. and hold long way to signal. dont gives too many signals. when red histogram cross trigger line that is up signal.and price probably will down

の紹介 Quantum平均足PRO チャート 市場のトレンドに対する明確な洞察を提供するように設計された平均足キャンドルは、ノイズを除去し、誤ったシグナルを排除する能力で知られています。混乱を招く価格変動に別れを告げ、よりスムーズで信頼性の高いチャート表現を導入しましょう。 Quantum Heiken Ashi PRO を真にユニークなものにしているのは、従来のローソク足データを読みやすい色のバーに変換する革新的なフォーミュラです。赤と緑のバーはそれぞれ弱気トレンドと強気トレンドをエレガントに強調し、潜在的なエントリーポイントとエグジットポイントを驚くほど正確に見つけることができます。
量子EAチャネル: ここをクリック
MT5のバージョン: ここをクリック
この注目すべき指標には、いくつかの重要な利点があります。 明確性の向上: 価格変動を平滑化することで、平均足バーは市場トレンドをより明確に表現し、有利な取引機会を特定しやすくします。 ノイズの削減: 誤ったシグナルを引き起こすことが多い不安定な価格変動に別れを告げます。 Quantum H

MT4用 マーケットストラクチャーシフトとフェアバリューギャップ (FVG) インジケーター このMT4インジケーターは、市場構造の変化とフェアバリューギャップ(FVG)を特定し、トレーダーに潜在的な取引機会を提供します。モバイル通知を通じてこれらのイベントをユーザーに警告し、変化する市場状況に迅速に対応できるようにします。 主な特徴: 市場構造シフトの検出: スイング高値/安値のブレイクと、平均と比較して значительный なキャンドル本体サイズに基づいて、強気と弱気の市場構造シフトを識別します。チャート上の上/下矢印で視覚化されます。 フェアバリューギャップ (FVG) の識別: 過去3本のキャンドルの価格アクションに基づいて、強気と弱気のFVGを検出します。 FVGはチャート上で色付きの長方形で強調表示されます。 モバイル通知: マーケットストラクチャーシフトとFVG形成の両方に関するリアルタイムのモバイル通知を受信し、潜在的な取引設定を見逃さないようにします。 カスタマイズ可能なパラメータ: ルックバック期間 (Lookback Period): スイング高値/安値計
FREE
The Controversial 5-Step System That Professional Traders Use To Unlock Trading Success!
Reversal Pro effectively combines price action, ideal location and reliable statistics in one smart algorithm. Understanding the market in this unique perspective allows you to recognize reversals professionally.
Discover The Secret Of Professional Traders
Get instant access www.mql5.com/en/blogs/post/716077 Copy & Paste what professional traders are doing right now!
How To Trade Step 1: Trade Setup Sta

The MA Bounce Strategy is a strategy that seeks to long FX pairs on a strong uptrend as they bounce off their MA support and shorting FX pairs on a strong downtrend as they bounce off MA resistance. The best suitable periods of moving averages for that strategy are 18, 30, 50. This indicator helps to identify and find place for potential market entry by MA bounce strategy. Read More information about MA Bounce Strategy . By default MA Bounce Strategy indicator is configured for trading of M15
Welcome to the world of SMC (Smart Money Concepts) Trading, where we empower traders with the tools and knowledge to make smarter trading decisions. Our latest addition to our suite of trading tools is the SMC Trading Pro indicator, version 1.0. Key Features: Major Market Structure Identification with BODY break. Order Block must be in Major Swing ( not Small Swing ). Order Block with Fair Value Gap Detection. Order Block in Discount | Premium zone. Filter for only Bullish, Bearish or All Order
FREE
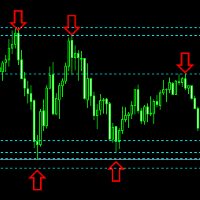
.....................................hi....................... ................for showing high s and low s and support and resistanses .....................we have a lot of ways............................... it can be helpful for finding trends , higher highs , higher lows , lower highs , lower lows
.......................today i write on of thems.......................... ........................you can enter the number of last support and resistanses .........................and it will dra
FREE
SL Curruncy impulse https://www.mql5.com/en/market/product/82593 SL Session Strength 28 Pair flow of this intraday Asian London New York Sessions strength.SL Session Strength 28 indicator best for intraday scalper. market powerful move time you can catch best symbol. because you'll know which currencies are best to trade at that moment. Buy strong currencies and sell weak currencies (Diverging currencies). Suggested timeframes to trading : M5 - M15 - M30 - You can however just change session

Trendline Alert Pro is a MetaTrader 4 indicator that monitors the objects that you created such as trendlines, horizontal lines, rectangles, Fibonacci levels, and instantly alerts you when price interacts with them.
MT5 version is here PM me to receive a 7-day trial version of the product.
Multi-Object Monitoring Trendlines, channels, and angled lines Horizontal & vertical lines Rectangles (support/resistance zones) Fibonacci retracements & expansions (customizable levels) Flexible Alert Opt

True Super Arrows is a powerful and versatile indicator that can help you identify and trade profitable trends. The indicator uses a combination of technical indicators to generate arrows that point to the direction of the trend. Features: Multiple trend identification methods: The indicator uses a combination of moving averages, trend lines, and other indicators to identify trends. Accurate trend direction: The indicator uses a variety of techniques to ensure that the arrows are pointing in
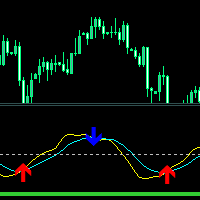
Crossing Line Indicator - トレンドの方向へのインパルスの動きを早期に検出するために設計されたインジケーター。
スムージングと動作修正を備えた RVI インジケーター上に構築されたオシレーターが含まれています。 2 本の細い線が交差すると、価格が変化する瞬間が発生し、その結果として衝動または激しい動きが発生する可能性があります。
トレンドの方向を決定するための指標は、加重 MA 指標に基づいています。太い薄緑色の線が中心レベルより下にある場合は下降傾向、上にある場合は上昇傾向を示します。
使いやすく、パラメータの設定も簡単です。メインチャートは読み込まれません。
インジケーターの機能
シグナル矢印は現在のローソク足に表示され、再描画されません。 信号が発生したときに複数の種類のアラートを提供します。 これは汎用性があり、あらゆる取引商品や時間枠で使用できます。 主にスキャルピングや短期取引に使用できます。
入力パラメータの設定
このインジケーターには、計算を調整するための 2 つの主要なパラメーターが含まれています。 Period of tre
FREE

Current event: https://c.mql5.com/1/326/A2SR2025_NoMusic.gif
A. A2SR とは何ですか ? * 先行テクニカル指標です (塗り直しなし、ラグなし)。
-- ガイダンス : -- https://www.mql5.com/en/blogs/post/734748/page4#comment_16532516 -- そして https://www.mql5.com/en/users/yohana/blog
A2SR には、サポート (需要) とレジスタンス (供給) のレベルを決定する特別な手法があります。 ネットで見かける通常の方法とは異なり、A2SR は実際の SR レベルを決定する独自のコンセプトを持っています。 元の手法はインターネットから取得されたものではなく、インターネット上で公開されたこともありません。 A2SR は、取引スタイルに応じて SR レベルを自動選択します。 時間枠を変更しても、SR レベルはその位置にとどまります。 実際のSRは、使用する時間枠から取得されるわけではないため. A2SR

One of the most powerful and important ICT concepts is the Power of 3. It explains the IPDA (Interbank Price Delivery Algorithm) phases. PO3 simply means there are 3 things that the market maker's algorithm do with price:
Accumulation, Manipulation and Distribution
ICT tells us how its important to identify the weekly candle expansion and then try to enter above or below the daily open, in the direction of the weekly expansion.
This handy indicator here helps you keep track of the weekly and

The indicator analyzes the volume scale and splits it into two components - seller volumes and buyer volumes, and also calculates the delta and cumulative delta. The indicator does not flicker or redraw, its calculation and plotting are performed fairly quickly, while using the data from the smaller (relative to the current) periods. The indicator operation modes can be switched using the Mode input variable: Buy - display only the buyer volumes. Sell - display only the seller volumes. BuySell -
FREE
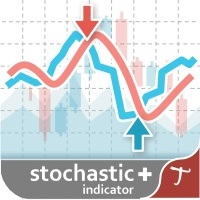
Tipu Stochastic is the modified version of the original Stochastic Oscillator published by MetaQuotes here .
Features Choose three types of signals (Reversals, Main Signal Cross, and Overbought/Oversold Cross). Customizable Buy/Sell alerts, push alerts, email alerts, and visual on-screen alerts. Marked overbought and oversold levels. Add Tipu Panel (found here ) and unlock the following additional features: An easy to use Panel that shows the trend + signal of the selected time frames. Show Sto
説明
Market Phase Analyzer は、市場の3つの主要フェーズである 蓄積(Accumulation) 、 操作(Manipulation) 、 分配(Distribution) を識別するために設計された高度なインジケーターです。
自動セッション分析を通じて アジアボックス(Asia Box) を描画し、重要なレベルの上下でのスイープ動作を検出し、 ATRフィルター を使用して反転を確認し、誤ったシグナルを減らします。 主な機能 カスタマイズ可能なアジアセッションのボックスをハイライト表示。 強気または弱気のスイープを自動検出。 シグナル確認のためのオプションATRフィルター。 日足始値ラインを表示。 矢印とテキストによる視覚的シグナル表示。 再初期化時のオブジェクト自動削除。 取引上の利点 潜在的な反転ポイントとトレンドフェーズを特定するのに役立つ。 スマートマネーコンセプトや高度なプライスアクション戦略に対応。 デイトレードおよびスイングトレードに最適化。 時間、色、レベルを完全にカスタマイズ可能。 推奨使用方法
M15、M30、H1チャートでの使用を推奨。市
FREE
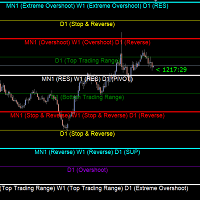
Gold Levels MTF - this is a fine stock technical indicator. The indicator algorithm analyzes the movement of the asset price, displays price levels of support and resistance from all time frames (TF) using the Murray method based on the Gann theory. The indicator indicates overbought and oversold fields, giving an idea of possible reversal points and at the same time giving some idea of the strength of the current trend. Description of levels: (Extreme Overshoot) - these levels are the ultimat
FREE
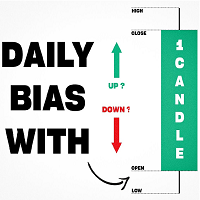
Inspired by TTrades video on daily bias, this indicator aims to develop a higher timeframe bias and collect data on its success rate. While a handful of concepts were introduced in said video, this indicator focuses on one specific method that utilizes previous highs and lows. The following description will outline how the indicator works using the daily timeframe as an example, but the weekly timeframe is also an included option that functions in the exact same manner.
On the daily timefr

Title: HTF Candle Insight - See the Big Picture on One Chart Introduction: Stop switching tabs constantly! HTF Candle Insight allows you to visualize Higher Timeframe price action directly on your current trading chart. Whether you are a Scalper, Day Trader, or Swing Trader, seeing the "Big Picture" candle structure is crucial for identifying trends, reversals, and key levels (Support/Resistance). Key Features: Dual HTF Overlay: Display up to 2 different Higher Timeframes simultaneously (e.g.,

Contact me after payment to send you the User-Manual PDF File. Divergence detection indicator with a special algorithm. Using divergences is very common in trading strategies. But finding opportunities for trading with the eyes is very difficult and sometimes we lose those opportunities. The indicator finds all the regular and hidden divergences. (RD & HD) It uses an advanced method to specify divergence. This indicator is very functional and can greatly improve the outcome of your trading. Thi

Free Market structure zig zag to assist in price action trading the screenshots describe how to use and how to spot patterns new version comes with alerts, email alert and push notification alert can be used on all pairs can be used on all timeframes you can add additional confirmation indicators the indicator shows you your higher high and low highs as well as your lower lows and lower highs the indication makes price action analysis easier to spot.
FREE

The indicator places Semaphore points on the maximum and minimum of a higher, medium and lower period. It includes A,B,C Triangles for easier spotting of reversal chart pattern which occurs very frequently and has a very high success ratio. Both Semaphore and A,B,C Triangles have Alerts and Push notifications to a mobile device when they occur on the chart. These indicators are very useful for breakout trading and spotting support/resistance levels which gives good opportunities for positions.
It is a tool for technical analysis. It allows you to make measurements: Fibo, including the search for clusters Fibo levels (by the DiNapoli method) Overbalance Trend line Selecting S/D levels
Input parameters Trend_Color - color of the trend line Trend_Width - width of the trend line Trend_info - if true, along with the trend line additional information is displayed (low, high, medium of the trend line) Trend_info_color_up_dn - color of the text describing the trend line Trend_info_font_up_dn

Good News ! Advanced Currency Meter is more awesome now ! If you have been a fan of the free version of Advanced Currency Meter then I will implore you not to be discourage because you will soon find that the new paid version is worth every dime. Unlike the free version the new paid version of Advanced Currency Meter now has a newly added panel called the “% Daily Range” . Why A Paid Version Now? We believe you like good things and many who has used Advanced Currency Meter over the years will te

トレンドの識別インジケータを使用すると、非常に正確に、そして最も重要なこととして、わずかな遅延で、(1)真のトレンドの動きの開始、および(2)フラットを識別できます。このような指標は、スキャルパー戦略による取引と長期取引戦略の使用の両方に使用できます。インディケーター操作アルゴリズムは、最後のスクリーンショットで詳しく説明されています。 指標の読みは視覚的で非常に単純で、コメントを必要としません。インディケータの青い線は上昇トレンドを表し、金色の線はフラット、そして赤い線は下降トレンドです。したがって、赤または金の線が青に置き換えられた場合はBuyのエントリポイント、青または金の線が赤に置き換えられた場合はSell - のエントリポイントです。 このインディケータにはあらゆる種類の警告があります。(トレンド方向の)インジケーターの表示が最後の2つのバーに一致すると、アラートがアクティブになります。 価格の動きの方向が変化する可能性のある瞬間も
FREE

MT5版 | Trend Monitor VZインジケーター | Owl Smart Levelsインジケーター | Owl Smart Levels戦略 | FAQ エリオット波理論は 、価格チャート上の波の視覚的モデルに依存している金融市場のプロセスの解釈です。 Valable ZigZagインジケータは、取引の決定を行うために使用することができる市場の波の構造を表示します。 Valable ZigZag indicatorはより安定しており、古典的なZigZag indicatorのように方向を変えることはなく、トレーダーを誤解させます。 これは、指標波の構築にフラクタルを使用することによって達成される。 Telegram チャット: @it_trader_chat 新しい Expert Advisor Prop Master - 取引ターミナルでテストしてください https://www.mql5.com/ja/market/product/115375
Valable ZigZagは、主にトレンド指標です 。 これは、トレーダーが取引すべき主な方
FREE
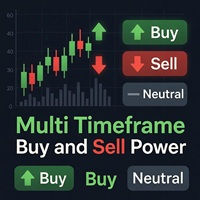
Multi Timeframe Buy and Sell Power MT4
The Multi Timeframe Buy and Sell Power indicator for MetaTrader 4 is a versatile tool designed to provide traders with a clear visual representation of market pressure across nine standard timeframes, from M1 to MN1. By aggregating buy and sell strength percentages derived from recent price action and tick volume, it helps identify potential trends, reversals, and neutral conditions in real-time. The indicator displays this information in a compact dashbo
FREE

Auto Trendline Fibo Dow Theory - Automated Price Action & Structure Analysis Overview: Stop drawing manual trendlines and Fibonacci retracements! Auto Trendline Fibo Dow Theory is a powerful price action utility designed to automate your technical analysis based on the classic Dow Theory and Fibonacci ratios. This indicator scans market structure using a customizable ZigZag algorithm to identify higher highs, higher lows (Uptrend), or lower highs, lower lows (Downtrend). It automatically plots
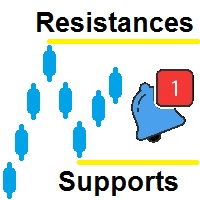
サポートとレジスタンスは、いくつかの異なる時間枠で自動的にトップとボトムを識別し、現在のチャートにこれらのトップとボトムをプロットするのに役立つように作成されました。 レジスタンスの作成の説明に行きましょう 上部と下部を定義できるルール フィールドがあり、上部のルールはデフォルトで次のように設定されます。 H[ 0 ]<=H[ 1 ] and H[ 1 ]=>H[ 2 ]
どこ:
エレメント 説明 H ハイを 意味します
[0] 現在の ろうそく を意味します [1] 前の ろうそく を意味します <= より低いか等しいこと を意味します => より高いか等しいこと を意味します
したがって、この式では、最初に次のルールを使用して、現在の高値が前の高値以下であるかどうかを確認します。 H[ 0 ]<=H[ 1 ] 次に、次の式を使用して、前回の高値が前回の高値以上であるかどうかを確認します。 H[ 1 ]=>H[ 2 ] 「And」は 2 つの表現を結合し、true の場合、新しい抵抗があることを意味します。 and ただし、マークを付けるには正しいろうそくを選択する必要
FREE

Introducing Volume Orderflow Profile , a versatile tool designed to help traders visualize and understand the dynamics of buying and selling pressure within a specified lookback period. Perfect for those looking to gain deeper insights into volume-based market behavior! MT5 Version - https://www.mql5.com/en/market/product/122657 The indicator gathers data on high and low prices, along with buy and sell volumes, over a user-defined period. It calculates the maximum and minimum prices during this

Pips Chaser は、マニュアル取引を補完するために開発されたインジケーターです。このインディケータは短期スキャルピングと長期スイングトレードの両方に使用することができます // MT5バージョン
特徴 リペイントなしインジケーター このインディケータは、新しいデータが到着しても値を変更しません。 取引通貨ペア 全ての通貨ペア 時間軸 H1が望ましいが、どのタイムフレームにも適用可能。 取引時間 24時間 Buffers Buy Buffer: 0 / Sell Buffer: 1
必要条件
一部のポジションのスキャルピングには、スプレッドが狭いECNブローカーの利用が必須です。 中程度のインパクトと高いインパクトのニュースリリース時間には取引しないこと。
インストール方法
ご希望の取引ペア(H1推奨)にインジケータを装着してください。
設定方法
インジケーターの設定です 。 インジケーターのパラメータを変更し、自分に合った戦略を採用することができます。 追加設定 ここでは、インジケータの様々な部分の色を変更することができます。また、アラートの設定を変更することがで
FREE
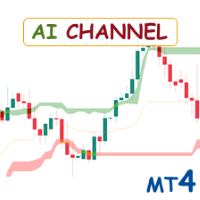
Special offer : ALL TOOLS , just $35 each! New tools will be $30 for the first week or the first 3 purchases ! Trading Tools Channel on MQL5 : Join my MQL5 channel to update the latest news from me AI Channels インジケーターは、クラスタリング分析における強力な機械学習技術である ローリングK-平均クラスタリング を使用して、価格の基礎的なトレンドについてリアルタイムの洞察を提供します。このインジケーターは、クラスタ化された価格データに基づいた適応チャネルを作成し、トレーダーがトレンド方向や市場の状況について情報に基づいた判断を下せるようにします。 インジケーターにはリスク管理に柔軟性を持たせるため、 トレーリングストップオプション も設定内に含まれています。 MT5バージョンを見る: AI Channels MT5 他の製品を見る: すべて
FREE

Advanced Stochastic Scalper - is a professional indicator based on the popular Stochastic Oscillator. Advanced Stochastic Scalper is an oscillator with dynamic overbought and oversold levels, while in the standard Stochastic Oscillator, these levels are static and do not change. This allows Advanced Stochastic Scalper to adapt to the ever-changing market. When a buy or a sell signal appears, an arrow is drawn on the chart and an alert is triggered allowing you to open a position in a timely mann
MTF Moving Averages is an useful indicator that brings you data from fully customizable higher timeframe Moving Averages on your charts, you can add multiple Moving Averages to use even more data of current market conditions. Check the indicator in action [Images below]
What MTF Moving Averages does apart from showing higher timeframe MA's?
Time saver , having all your higher timeframe MA's in just one chart, time is key, avoid switching between timeframes. Enter Trends precisely, easy to follo
ICT Template Indicator visualizes and automatically updates all important ICT elements for Scalpers, Day and Swing traders. It allows you too keep your chart clean and bring any elements by just one click to the side buttons. Thanks to mobile notifications on external liquidity levels, you will not miss any opportunity and you don't have to sit behind the screens whole day. Each element has fully customizable colours, width, line types, max timeframe to be shown etc... so you can really tweak y

Supply Demand Analyzer is an advanced trading indicator meticulously designed for the precise identification, analysis, and management of supply and demand zones. By integrating real-time data and advanced algorithms, this tool enables traders to recognize market phases, price movements, and structural patterns with unparalleled accuracy. It simplifies complex market dynamics into actionable insights, empowering traders to anticipate market behavior, identify trading opportunities, and make info
Please thoroughly test demo the indicator in your preferred trading conditions before making a purchase decision.
Your satisfaction and confidence in its performance are paramount.
MT Magical : A sophisticated strategy combining swing trading, trend analysis and supply & demand signals. Expertly filtered for precision. Developed with rigorous effort, delivering value to serious investors. Indicator for traders who prefer manual trading. Request: PC high performance
TRADE: Forex
TIME FRA
Hi Trader, ================================================================================ If you like my indicator, please do not hesitate to give a review and/or comment. Thank you! ================================================================================
This indicator draws trade entry zone and target levels based on the levels of the previous day.
A blue zone (BUY) or red zone (SELL) is drawn and two targets. The optimal trade entry value is also indicated.
A second gray zone is
FREE

Buy Sell Signal Low TF gives buy/sell signals and alerts with up and down arrow at potential reversal of a pullback or a trend continuation pattern in low timeframe. This is an indicator which gives signals based on trend => It works best in trend market with the principle is to ride on the trend not trade against the trend.
The components of Buy Sell Signal Low TF: - The trend is determined by SMMA 13 , SMMA 21 and SMMA 35 ( can be changed manually to suit your preference). - The signal is b
FREE

EZTトレンドインジケーターは、トレンド、プルバック、エントリーの機会を示します。 オプションのフィルタリングとあらゆるタイプのアラートが利用可能です。 電子メールおよびプッシュ通知アラートが追加されます。 また、このインジケーターに基づいた EA も開発中であり、間もなく利用可能になる予定です。
2色のヒストグラムとラインで構成される多機能インジケーターです。 これはトレンドの方向と強さを視覚的に表現したもので、ラインまたはヒストグラム上で発散が何度も見つかります。
このインジケーターは自動パラメーター設定とうまく連携します。 これらは特定の時間枠に対して事前に決定されており、その設定でインジケーターを使用することをお勧めします。 手動モードでは、独自のパラメータを設定できます。 これはマルチタイムフレーム(MTF)インジケーターです。
このインジケーターは、MTF rsi、MTF cci、MACD pro などの他のインジケーターの組み合わせとうまく機能します。
取引される商品の変動が大きいほど、最適なエントリーを見つけるために使用する必要がある時間枠は短くなります。 常
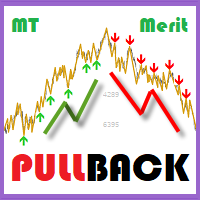
"Pullback while filtering trend"
MT MERIT PullBack :
Engineered to detect pullback signals while filtering trends using advanced techniques. Best for short-term cycles. Tailored for manual trading, emphasizing risk management and fundamental analysis to select optimal currency pairs.
TRADE: Forex TIME FRAME: All Time Frame SYMBOL PAIR: All Symbol
SETTINGS:
CALCULATE BARS: Value or bars used must be large enough to calculate the formula.
TREND FILTER: Put the number Period and Show tren

What is a Point of Interest? Traders who follow Smart Money Concepts may call this a Liquidity Point, or where areas of liquidity have been built up by retail traders for for Big Banks to target to create large price movements in the market. As we all know, retail traders that use outdated and unreliable methods of trading like using trendlines, support and resistance, RSI, MACD, and many others to place trades and put their stop losses at keys points in the market. The "Big Banks" know these me

Consolidation Zone Indicator is a powerful tool designed for traders to identify and capitalize on consolidation patterns in the market. This innovative indicator detects consolidation areas and provides timely alerts when the price breaks above or below these zones, enabling traders to make informed trading decisions. MT5 Version : https://www.mql5.com/en/market/product/118748 Join To Learn Market Depth - https://www.mql5.com/en/channels/suvashishfx
Key Features:
1. Consolidation Detecti
FREE

特別オファー : ALL TOOLS 、各 $35 のみ! 新しいツール は 最初の週 または 最初の 3 つの購入 で $30 になります! Trading Tools Channel on MQL5 :最新情報を受け取るにはチャンネルに参加してください RSI Shift Zone Scanner は、RSI シグナルをプライスアクションと結び付け、市場センチメントが変化する可能性のある瞬間を特定します。RSI が設定レベル(デフォルトでは 70=買われ過ぎ、30=売られ過ぎ)を上抜け・下抜けすると、インジケーターはチャート上にチャネルを描画します。これらのチャネルはセンチメントが反転した可能性のある領域を示し、サポートやレジスタンスとして機能することがあります。 MT5 版はこちら: RSI Shift Zone MT5 Scanner その他の製品: All P roducts RSI が上限または下限をクロスすると、新しいチャネルが生成されます。 チャネルの境界はクロスしたローソク足の高値と安値に固定され、中間線が平均値を示します。 各チャネル
MT5バージョンはこちら: https://www.mql5.com/en/market/product/50255
Telegramチャンネル&グループ: https://t.me/bluedigitsfx
VIPグループアクセス: 支払い証明を私たちの受信箱に送信してください
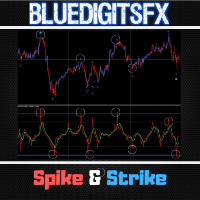
推奨ブローカー: https://bit.ly/BlueDigitsFxStarTrader BlueDigitsFx Spike And Strike Reversal — 正確な市場反転検出のための強力な複合オシレーター BlueDigitsFx Spike And Strike Reversalは、複数のインジケーター信号を組み合わせた複合オシレーターで、市場の反転を正確に予測するのに役立ちます。 このインジケーターは、基本的なオシレーターを含む2つのモジュールを統合し、最適なエントリーポイントを示す矢印で明確な視覚的シグナルを提供します。 主な特徴 簡単で視覚的、効果的な反転検出 既存の取引戦略のフィルタリングと強化 バークローズ時にのみシグナルを発生させ、信頼性を確保 すべての銘柄および時間枠

Speed Trend Matrix Ultimate (バージョン 5.10) Speed Trend Matrix (STM) は、単一のインジケーターに組み込まれた包括的なトレーディングシステムです。買われすぎや売られすぎの状態を示すだけの標準的なオシレーターとは異なり、STM は市場のボラティリティ (ATR) に対する価格の「速度」を分析します。トレンドの方向性だけでなく、その動きの背後にある強さも特定し、トレーダーが騙しに遭いやすい勢いの低い「横ばい」期間をフィルタリングします。 このツールは、すべての取引に対して完全なロードマップを必要とするトレーダー向けに設計されています。単なるエントリーシグナルを提供するだけでなく、選択したトレーディングスタイルに基づいて推奨される ストップロス (Stop Loss) と テイクプロフィット (Take Profit) の水準を自動的に計算し、チャート上に直接表示します。 基本理念 インジケーターは、価格の速度に基づいて市場の行動を 3 つの異なるゾーンに分類します。 UpZone (緑): 強い上昇の勢いがある状態。 DownZo

It identifies the pivot, support, and resistance price levels of the selected timeframe and then draws lines onto the chart. FEATURES: Option to specify the Timeframe Period in the PivotSR calculation. Option to display the PivotSR of the last candle, of every candle, or of the current candle. Options for displaying labels, line thickness, and line color. PivotSR can be interpreted as reversal levels or past price reactions that can be used as the basis for current price analysis. Some traders b
FREE

The Supply and Demand Zones indicator is one of the best tools we have ever made. This great tool automatically draws supply and demand zones, the best places for opening and closing positions. It has many advanced features such as multi timeframe zones support, displaying the width of zones, alert notifications for retouched zones, and much more. Because of market fractality, this indicator can be used for any kind of trading. Whether you are a positional, swing, or intraday trader does not ma

The Supply and Demand Zone Indicator is a powerful and easy-to-use tool designed to help traders identify critical supply and demand zones on the chart. These zones can provide valuable insight into potential market reversals, breakouts, and important price levels where buyers or sellers are likely to take control. The best FREE Trade Manager . If you want to create your own Hedging or Grid strategies without any coding make sure to check out the ManHedger Key Features: Automatic Zone Detect
FREE

The Magic Histogram indicator is a universal tool, suitable for scalping and medium-term trading. This indicator uses an innovative formula and allows you to determine the direction and strength of the trend. Magic Histogram is not redrawn, so you can evaluate its efficiency using history data. It is most suitable for M5, M15, M30, H1 and H4. Version for the MetaTrader 5 terminal : https://www.mql5.com/en/market/product/58448
Indicator Benefits Excellent indicator signals! Suitable for beginne

** All Symbols x All Time frames scan just by pressing scanner button ** *** Contact me to send you instruction and add you in "Order Block group" for sharing or seeing experiences with other users. Introduction: The central banks and financial institutions mainly drive the market, Order block is considered a market behavior that indicates accumulation of orders from banks and institutions, then the market tends to make a sharp move(Imbalance) on either side once the order block is completed. O

このプロジェクトが好きなら、5つ星レビューを残してください。 このインジケータは、指定されたためのオープン、ハイ、ロー、クローズ価格を描画します
特定のタイムゾーンの期間と調整が可能です。 これらは、多くの機関や専門家によって見られた重要なレベルです
トレーダーは、彼らがより多くのかもしれない場所を知るために有用であり、
アクティブ。 利用可能な期間は次のとおりです。 前の日。 前週。 前の月。 前の四半期。 前年。 または: 現在の日。 現在の週。 現在の月。 現在の四半期。 現年。
FREE

Scalper Arrow x is a buy sell arrow type indicator, the strategy behind its signals is based on the MFI indicator with trend filter using Halftrend formula, this indicator can be used alone or mixed with other tools. NOTE : THIS INDICATOR DOESN'T REPAINT OR BACK PAINT, AND ITS ARROW SIGNALS ARE NOT DELAYED. ---------------------------------------------------------------
FREE

volatility level indicator is a volatility oscillator to see trend reversal points. price trends has reverese when volatility inreased . this indicator show trend reversal points volatility. mostly same level up and down volatility is reversal points. red colour shows up points of volatilty.and probably trend will down. blue colour oscillator shows deep point of price when increased volatiliyty. on pictures horizontal lines on oscillator has drawed by hand.to see the before level and compare now
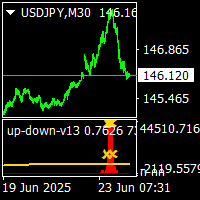
up-down v13 indicator is no repaint and works all pairs and all time frames charts. it consumes too much time need at least i5 cpu.pc it is suitable also 1 m charts for all pairs. and hold long way to signal. dont gives too many signals. when red histogram cross trigger line that is up signal.and price probably will down when blue histogram cross trigger line that is down signal.and price probably will go up. when the signals not seen press + button on terminal . you will see sometimes h4 sign

または(TDO)は、「純粋な勢い 」の原則を使用して価格変動率を測定する指標です。
証券価格が10から15に上がると、価格の変化率は150%になりますが、15から10に戻ると、価格の変化率は33.3%になります。そのため、「価格変化率」(ROC)や「モメンタム」などのテクニカル分析指標は、下降するものよりも上昇する価格の動きの方が高い値を示します。 TDOはこの問題を修正して、トレーダーが勢いを正しく読み取るのを支援します。
重要な情報
TDOユーザーズマニュアル: https://www.mql5.com/en/blogs/post/717970 TDO FAQ: https://www.mql5.com/en/blogs/post/722015 TDOビデオライブラリ: https://www.mql5.com/en/blogs/post/722018 TDOエキスパートアドバイザーの例: https://www.mql5.com/en/blogs/post/731141
TDOの機能
TDOは純粋な勢いをパーセントとして計算するため、さまざまな市場のさまざまな証券を比較す
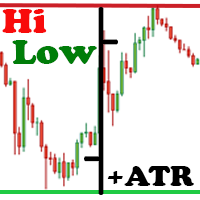
The Hi Low Last Day ( Hi Lo Last Day ) indicator shows the high and low of the last trading day and the second trading day, as well as the minimum and maximum of last week . There are many trading strategies on the daily levels. This indicator is indispensable when using such trading strategies. In fact, everything is simple in trading, you just need to understand and accept it for yourself. There is only price!!! What is price? This is the level on the chart. The level is the price that the

This indicator is another variant of the famous powerful indicator Fibonacci-SS https://www.mql5.com/en/market/product/10136 but has different behaviour in placing Pending Order and TP Line. Automatically places Fibonacci retracement lines from the last highest and lowest visible bars on the chart with: An auto Pending Order (Buy/Sell). Taking Profit 1, Taking Profit 2 is pivot point and Taking Profit 3 for extended reward opportunity. The best risk and reward ratio.
Simple and powerful indicat

This is an advanced multi-timeframe version of the popular Hull Moving Average (HMA). Features Graphical panel with HMA indicator data from all timeframes at the same time . If the HMA has switched its direction on any timeframe, a question mark or exclamation mark is displayed on the panel, accompanied by a text and audio message. The messages can be configured separately for each timeframe using the corresponding checkboxes.
The indicator is located in a separate window, so as not to overload

Auto Fibo は、手動での取引を強化するために開発されたインジケーターです。自動で黄金比を描き、時間を節約し、取引を円滑にします。 グラフにインジケータを取り付けると、自動的に正確な黄金比が描かれるので、臨界点を探す手間が省けます。 インターフェイスは、お使いのコンピュータに応じて、バンドのおおよそのハイポイントとローポイントに調整されます。 このインジケータは、ほとんどの始点と終点の選択ミスを修正します。 各バンドには、正確な価格が表示されます。 警告 私はMQL5.comで私のEAを販売するだけです。もし誰かが私のEAを売ってくれと連絡してきたら、それはあなたのお金が欲しいだけの詐欺師です。
また、もしあなたが私のEAを外部のウェブサイトから購入した場合、それは偽のバージョンであり、オリジナルのものと同じようには動作しないことを保証します。
FREE

基本的な需給インジケータは、あなたの市場分析を強化し、あらゆるチャート上の重要な機会領域を特定するために設計された強力なツールです。直感的で使いやすいインターフェイスで、この無料のメタトレーダー用インディケータは、需給ゾーンを明確に表示し、より多くの情報に基づいた正確な取引判断を可能にします / MT5無料版 この指標のダッシュボードスキャナー: ( Basic Supply Demand Dashboard )
特徴 チャートの需給ゾーンを自動的にスキャンし、面倒な手動分析を不要にします。 直近の需給ゾーンまでの残り距離をグラフィカルに表示 供給ゾーンは特徴的な色で強調表示され、需要ゾーンは別の色で表示されるため、迅速かつ正確な解釈が可能。 このインディケータは、最も近い供給ゾーンまたは需要ゾーンとチャート上の現在価格との距離をpips単位で自動的に計算し、明確かつ定量的な指標を提供します。pips単位の距離はチャート上にはっきりと見やすく表示され、現在価 格との距離が大きい、または小さいエリアを素早く特定できます。 需給ゾーンの接近やブレイクを警告 どのタイムフレームでも機
FREE

MT4マルチタイムフレームオーダーブロック検出インジケーター。
特徴
-チャートコントロールパネルで完全にカスタマイズ可能で、完全な相互作用を提供します。
-必要な場所でコントロールパネルを表示および非表示にします。
-複数の時間枠でOBを検出します。
-表示するOBの数量を選択します。
-さまざまなOBユーザーインターフェイス。
-OBのさまざまなフィルター。
-OB近接アラート。
-ADRの高線と低線。
-通知サービス(画面アラート|プッシュ通知)。
概要
注文ブロックは、金融機関や銀行からの注文収集を示す市場行動です。著名な金融機関と中央銀行が外国為替市場を牽引しています。したがって、トレーダーは市場で何をしているのかを知る必要があります。市場が注文ブロックを構築するとき、それは投資決定のほとんどが行われる範囲のように動きます。
注文の構築が完了すると、市場は上向きと下向きの両方に向かって急激に動きます。注文ブロック取引戦略の重要な用語は、機関投資家が行っていることを含むことです。それらは主要な価格ドライバーであるため、機関投資家の取引を含むあらゆる戦
Candle_Timer_and_Spread インジケーターは、選択したシンボルのスプレッドとともに、ローソク足の終了までの時間と価格変化の割合を 1 つのチャートに表示します。
現在の時間枠のローソク足の終わりまでの時間と、その日の始値に対するパーセンテージでの価格変化のタイマーは、デフォルトでチャートの右上隅に表示されます。 パネルには、選択したシンボルのその日の始値に対する現在の価格のスプレッドと変化率が表示されます。パネルはデフォルトで左上隅に配置されます。
入力設定: Candle_Time_Lable_Settings - ローソク足の終わりまでの時間と現在のシンボルの価格の変化に関するタイマーのタイプの設定。 Font_Size - フォント サイズ。 X_offset - 横軸に沿ってシフトします。 Y_offset - 縦軸に沿ってシフトします。 Text_color - フォントの色。 Multi_Symbol_Settings - マルチシンボル パネルの設定。 Symbols_to_work - パネルに表示するシンボルをカンマで区切って手動で入力します
FREE

Volumatic Fair Value Gaps is a precision-engineered indicator for identifying, analyzing, and visualizing Fair Value Gaps (FVGs) backed by volume intelligence. This tool goes beyond standard FVG plotting by dissecting volume dynamics inside each gap using lower-timeframe sampling , offering clear insight into whether bulls or bears dominate the imbalance. Designed for technical traders, this indicator overlays high-probability gaps only, visualizes bullish vs. bearish volume compositio

VR ドンチャン インジケーターは、ドンチャン チャネルの改良版です。改善はチャネルのほぼすべての機能に影響を与えましたが、主要な動作アルゴリズムとチャネル構造は維持されました。現在のトレンドに応じてレベルの色の変化がボールインジケーターに追加されました。これは、トレーダーにトレンドまたはフラットの変化を明確に示します。スマートフォン、電子メール、または MetaTrader ターミナル自体で 2 つのチャネル レベルのうちの 1 つのブレイクアウトについてトレーダーに通知する機能が追加されました。値札が追加されており、これを利用してトレーダーはチャート上の価格レベルを確認できます。古典的なドンチャン指標の操作アルゴリズムは、トレーダーが指標が計算する期間を自分で設定できるという事実により、最適化され高速化されています。古典的な Donchian インジケーターは、MetaTrader ターミナルで利用可能な履歴全体を計算します。これにより、MetaTrader ターミナルに数学的計算の負荷が大きくかかります。 VR Donchian インジケーターは、トレーダーが設定で設定した金額の
FREE

About: Someone recently shared a pinescript with me. And asked me to convert it to MT4. I found the FVG blocks very effective as SR areas. So here it is. Enjoy!!
What are Fair Value Gaps (FVG)? Fair Value Gaps occur when price moves so quickly that it creates an imbalance between buyers and sellers. These gaps represent areas where price "skipped" levels, creating potential zones for price to return and "fill the gap". Think of it as unfinished business in the market that often gets revisited.
FREE
MetaTraderマーケットは、開発者がトレーディングアプリを販売するシンプルで便利なサイトです。
プロダクトを投稿するのをお手伝いし、マーケットのためにプロダクト記載を準備する方法を説明します。マーケットのすべてのアプリは暗号化によって守られ、購入者のコンピュータでしか動作しません。違法なコピーは不可能です。
取引の機会を逃しています。
- 無料取引アプリ
- 8千を超えるシグナルをコピー
- 金融ニュースで金融マーケットを探索
新規登録
ログイン