YouTubeにあるマーケットチュートリアルビデオをご覧ください
ロボットや指標を購入する
仮想ホスティングで
EAを実行
EAを実行
ロボットや指標を購入前にテストする
マーケットで収入を得る
販売のためにプロダクトをプレゼンテーションする方法
MetaTrader 4のためのテクニカル指標 - 8
Mars 14 is a Break indicator is a powerful indicator of Pattern trade for any par and any timeframe. It doesn't requires any additional indicators for the trading setup.The indicator gives clear signals about opening and closing trades.This Indicator is a unique, high quality and affordable trading tool. Can be used in combination with other indicators Perfect For New Traders And Expert Traders Low risk entries. Never repaints signal. Never backpaints signal. Never recalculates signal. For M
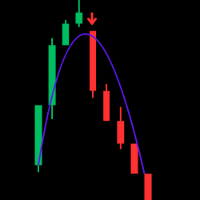
Trend WTS — Advanced Modular Trend & Signal Indicator for XAUUSD (M5 Optimized) Unlock precise trading insights with Trend WTS , a powerful and modular trend and signal indicator designed specifically for XAUUSD on the M5 timeframe. Built for traders seeking accuracy and clarity, Trend WTS combines fast moving average crossovers with a long-term EMA filter to deliver reliable buy and sell signals tailored for the gold market. Key Features: Dual Moving Average Trend Detection: Detect strong trend
FREE

Candle Timer Countdown to Next Bar MT 4 Free by DigitalPrime A reliable, lightweight candle timer showing the exact time remaining until the next bar – now available for free with core functionality. Used and trusted by hundreds of traders – over 800 downloads! Key Features Real-time countdown to the next candle close (for M1, M15, and H1 only) Updates independently of market tick activity Minimal CPU usage – works smoothly on all supported charts Simple, always visible, fixed position (top lef
FREE
How To Determine If The Market is Strong Or Weak?
Strength Meter uses an Adaptive Algorithm That Detect Price Action Strength In 4 Important Levels! This powerful filter gives you the ability to determine setups with the best probability.
Features Universal compatibility to different trading systems Advance analysis categorized in 4 levels Level 1 (Weak) - Indicates us to WAIT. This will help avoid false moves Weak Bullish - Early signs bullish pressure Weak Bearish - Early signs bearish press

サポートとレジスタンススクリーナーは、1つのインジケーター内に複数のツールを提供するMetaTraderの1つのレベルインジケーターにあります。 利用可能なツールは次のとおりです。 1.市場構造スクリーナー。 2.強気のプルバックゾーン。 3.弱気プルバックゾーン。 4.デイリーピボットポイント 5.毎週のピボットポイント 6.毎月のピボットポイント 7.ハーモニックパターンとボリュームに基づく強力なサポートとレジスタンス。 8.銀行レベルのゾーン。 期間限定オファー:HVサポートおよびレジスタンスインジケーターは、50ドルと生涯でのみご利用いただけます。 (元の価格125 $)
Metatrader Backtesterの制限なしでインジケーターを試してみませんか? デモ版をダウンロードするには、ここをクリックしてください。
主な機能
ハーモニックおよびボリュームアルゴリズムに基づく強力なサポートおよびレジスタンスゾーン。
ハーモニックおよびボリュームアルゴリズムに基づく強気および弱気のプルバックゾーン。
市場構造スクリーナー
毎日、毎週、毎月の

Description Helps you detect the structure of the market, using different types of Smart Money concepts. This should help you to upgrade your trading strategy in every way. MT5 Version Here Smart Money Features: Color candle to signal the type of structure Shows CHOCH and BOS Equal Lows and Highs Order Blocks Internal and Swings Weak and strongs high and lows Fair Value Gaps High and Lows in daily weekly and monthly timeframes Premium and discount Zones KEY LINKS: How to Install – Frequent
FREE

Mars 13 is a Break indicator is a powerful indicator of Pattern trade for any par and any timeframe. It doesn't requires any additional indicators for the trading setup.The indicator gives clear signals about opening and closing trades.This Indicator is a unique, high quality and affordable trading tool. Can be used in combination with other indicators Perfect For New Traders And Expert Traders Low risk entries. Never repaints signal. Never backpaints signal. Never recalculates signal. For

SR PrevPeriods MT4 概要
SR PrevPeriods は、MetaTrader 4 のチャート上に前日、高値・安値、前週、高値・安値、前月、高値・安値をリアルタイムで表示するインジケーターです。軽量設計で、価格の反応ゾーン、ブレイクアウト、リバランスゾーンと重なることが多い、過去のサポート・レジスタンス領域を強調表示します。 機能
主要な過去レベルに水平線を描画し、必要に応じて正確な価格を表示するテキストラベルも追加します。新しいティックごとに自動更新され、内部のオブジェクト管理機能によってチャートが常に整然と保たれます。 有用性
前日、前週、前月の価格レベルは、多くの裁量トレーダーやシステムトレーダーにとって重要な指標です。これらのレベルを把握することで、相場状況の認識が高まり、押し目買いや戻り売りの精度が向上し、ブレイクアウトの確認にも役立ちます。過剰取引を減らし、あらゆる時間足で客観的なコンテキストを提供します。 主な特徴
日足・週足・月足レベルの個別表示切替
各レベルの価格を表示するオプションラベル
タイムフレームごとのカラー、ラインスタイル、太さを
FREE
Special offer : ALL TOOLS , just $35 each! New tools will be $30 for the first week or the first 3 purchases ! Trading Tools Channel on MQL5 : Join my MQL5 channel to update the latest news from me I. はじめに
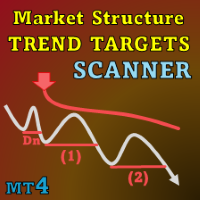
Market Structure Trend Targets Scanner は、市場のトレンドを分析し、ブレイクアウトポイントを特定し、動的なストップロスを通じてリスクを管理するための強力なツールです。過去の高値と安値を追跡してブレイクアウトを特定することで、このツールはトレーダーが直感的に市場のトレンドや潜在的な反転を迅速に認識するのを助けます。 MT5バージョンの詳細はこちら: Market Structure Trend Targets MT5 Scanner その他の製品についてはこちら: すべての 製品 II. 主な特徴 順序番号付き
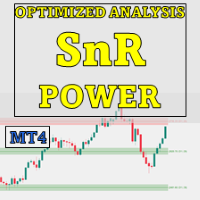
Special offer : ALL TOOLS , just $35 each! New tools will be $30 for the first week or the first 3 purchases ! Trading Tools Channel on MQL5 : Join my MQL5 channel to update the latest news from me 概要
OA SnR Powerは、サポートおよびレジスタンスレベルの強度を識別して評価するために設計された強力なツールです。取引量、反発頻度、再テスト回数などの重要な要素を組み込むことで、このインジケーターは市場の重要な価格ゾーンを包括的に可視化します。 その他の製品を見る: すべての 製品 OA SnR Powerの仕組み 高値と安値の特定 このインジケーターは、ローカル高値と安値を計算するための高度なアルゴリズムを使用します。 ユーザーはゾーン幅の設定を調整でき、サポートおよびレジスタンスの潜在的なレベルを正確に検出します。 主要レベルのフィルタリングと統合
FREE
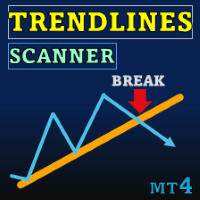
Special offer : ALL TOOLS , just $35 each! New tools will be $30 for the first week or the first 3 purchases ! Trading Tools Channel on MQL5 : Join my MQL5 channel to update the latest news from me Trendlines with Breaks Scanner は、トレーダーが重要なトレンドを特定し、リアルタイムでブレイクアウトを検出するのを支援するために設計された最先端の取引ツールです。ピボットポイントに基づいて自動生成されたトレンドラインを使用することで、このインジケーターはトレーダーが精度と自信を持って取引の機会を活用できるようにします。 MT5バージョンを見る: Trendlines with Breaks Scanner MT5 他の製品を見る: All Products 主な機能 1. リアルタイムのブレイクアウト検出 ブレイクアウトアラート: 価
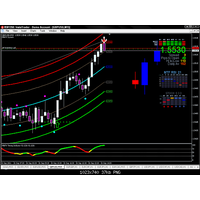
Gravity Timing Indicator -GTI-
GTIインジケーターは、これまでで最も簡単で最も正確なインジケーターです.重力の方法でサポートとレジスタンスを使用します.作業はとても簡単で、7つのラインで構成されており、最も強力なのは最低ラインと最高ラインです。 インジケーターがリバウンドし、エントリーするのに最適な時期です。
例外なくすべてのペアで機能します
時間枠については、スキャルピングの場合は 5 分や 15 分などの短い時間枠を好みます。
GTI を試してみて、気に入ったらレビューを残してください .
ありがとうございました
GTIインジケーターは、これまでで最も簡単で最も正確なインジケーターです.重力の方法でサポートとレジスタンスを使用します.作業はとても簡単で、7つのラインで構成されており、最も強力なのは最低ラインと最高ラインです。 インジケーターがリバウンドし、エントリーするのに最適な時期です。
例外なくすべてのペアで機能します
時間枠については、スキャルピングの場合は 5 分や 15 分などの短い時間枠を好みます。
FREE

BUY INDICATOR AND GET EA FOR FREE AS A BONUS + SOME OTHER GIFTS! ITALO VOLUME INDICATOR is the best volume indicator ever created, and why is that? The Indicator works on all time-frames and assets, indicator built after 7 years of experience on forex and many other markets. You know many volume indicators around the internet are not complete, does not help, and it's difficult to trade, but the Italo Volume Indicator is different , the Italo Volume Indicator shows the wave volume, when market

TrendSeeker Pro ― 究極のトレンド&ターニングポイント・ダッシュボード + H4レンジ検出器 Ultimate Trend & Turning Point Dashboard は、トレーダーを常にトレンドの正しい方向へ導き、低確率なレンジ相場を排除し、高精度なターニングポイントエントリーを自信をもって提供する、完全なマルチタイムフレーム市場判断システムです。 これは単なるインジケーターではありません。
取引前に必ず答えを出す、完成されたトレードフレームワークです。 このツールは、エントリー前に次の 3つの重要な質問 に答えます: 市場は トレンド相場 か レンジ相場 か? 上位足(H4)の バイアス は何か? 最も 安全で精度の高いエントリーポイント はどこか? 1. スマート・マルチシンボル・トレンドダッシュボード(H4ベース) 内蔵ダッシュボードは、すべての取引可能シンボルを自動スキャンし、H4時間足における EMA・ADX・ATR ロジックを用いて各通貨ペアを即座に分類します。 ダッシュボードには以下が明確に表示されます: PAIR(通貨ペア) TREND → U
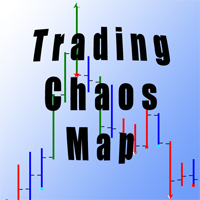
For those who studies Bill Williams' books "New Trading Dimensions" and "Trading Chaos (Second Edition)" and tries trading using these methods, it becomes evident that the standard set of indicators is not sufficient for full-fledged work. The Trading Chaos Map indicator draws the "market map", thus allowing you to the charts the same way as the author of the trilogy. Parameters provide options for enabling and disabling each signal. You can use any of the methods, or use them in conjunction. Yo

Scalping signals M1 を購入した方全員に、 本インジケーターのシグナルに基づいて自動売買を行う EAロボットを無料プレゼント します。 Scalping signals M1 — M1向けトレンドスキャルピング完全エントリーシステム Scalping signals M1 は、チャートをわかりやすい行動マップに変えるインジケーターです。
カラートレンドチャネルが市場の方向を示し、矢印がエントリーポイントを知らせます。
チャネルの方向と矢印に従うだけでよく、初心者でも簡単に扱えます。 インジケーターは特に M1 で優れた性能を発揮し、
XAUUSD(ゴールド)、ポンド、ドルの主要通貨ペア、クロスなど、ほぼすべての通貨ペアに対応しています。
アラートとメール通知を搭載しているため、シグナルを見逃しません。 基本コンセプト Scalping signals M1 は使いやすい外観とは対照的に、内部では高度なアルゴリズムが動作しています。
視覚的に表示されるのは以下の2つだけです。 – トレンド方向を示すチャネル
– トレンド継続が期待される位置での Buy/Sell 矢印
Binary Trader Master は、ローソク足の終値を予測する矢印ベースのインジケーターです。分析は 1 つのろうそく内でのみ行われます。ろうそくが開くと、分析を行い、ろうそくの終値を予測するのに少し時間がかかります.次に、信号を生成します。この指標では、分析に使用できる時間制限を適用することもできます。つまり、ろうそく内での分析にどれくらいの時間が許可されているかを実際に指標に伝えることができます。インジケーターは、ろうそくの特別なボリューム パターンを監視します。この分析は、現在の (0) ローソク足の終値を実際に予測します。このようなローソク足は通常、ボリュームが大きいため、これらのシグナルには潜在的な利益があり、外国為替取引にも使用できます。バイナリーと外国為替の両方のトレーダーがインジケーターの恩恵を受けることができます. インジケーターは個々のろうそくの本体で動作するため、インジケーターはリアルタイムまたはビジュアル戦略テスト モードでのみシグナルを提供します! 信号は再描画されません! 購入後ご連絡ください!私はあなたに取引指示を提供し、無料で素晴らしいボーナス

This tool gives you the opportunity to display pivot point support and resistance levels as well as the daily open, weekly close and monthly close levels on your chart with high levels of customization.
Pivot points are important horizontal support and resistance levels that get calculated using the high, low and closing price of the previous period (for example D1). With this indicator, you can choose between hourly to monthly timeframes to base your pivot point calculation on.
There is a va
FREE
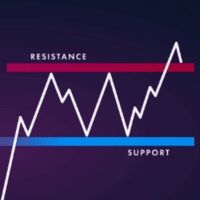
MT4 バージョン: https://www.mql5.com/ja/market/product/157679 MT5 バージョン: https://www.mql5.com/ja/market/product/157680
サポート・レジスタンス — スマートな市場構造レベル
プロのトレーダーと自動システム向けに開発された、シンプルでインテリジェント、かつ信頼性の高いサポート&レジスタンスインジケーターです。
サポート・レジスタンスは、フラクタル、ATRベースの価格セグメンテーション、マルチタイムフレーム分析を組み合わせた高度なクラスタリングアルゴリズムを用いて、真の市場レベルを検出するように設計されています。
このインジケーターは、ランダムなラインやノイズの多いラインを描くのではなく、価格が繰り返し反応した統計的に検証されたレベルを生成します。そのため、裁量取引、アルゴリズム取引、リスク管理、ブレイクアウト検証に最適です。
主な機能 高度なサポート・レジスタンス・エンジン ATRスケールのグリッドセグメンテーションを使用 上方フラクタルと下方フラクタルをクラスター化し
FREE

ピボットポイントフィボRSJは、フィボナッチレートを使用してその日のサポートラインとレジスタンスラインを追跡するインジケーターです。
この壮大な指標は、フィボナッチレートを使用してピボットポイントを通じて最大7レベルのサポートとレジスタンスを作成します。 価格がこのサポートとレジスタンスの各レベルを尊重する方法は素晴らしいです。そこでは、オペレーションの可能な入口/出口ポイントを認識することができます。
特徴 最大7レベルのサポートと7レベルの抵抗 レベルの色を個別に設定します
入力 ピボットタイプ ピボットフィボRSJ1 =フィボ比1の計算 ピボットフィボRSJ2 =フィボ比2の計算 ピボットフィボRSJ3 =フィボ比3の計算 ピボットフィボクラシック=クラシックピボット計算 最小ピボットレベル ピボット3レベル ピボット4レベル ピボット5レベル ピボット6レベル ピボット7レベル
それでも質問がある場合は、ダイレクトメッセージで私に連絡してください: https://www.mql5.com/ja/users/robsjunqueira/
FREE

SuperTrend Alert MT4で市場トレンドをマスターしましょう。この強力なインジケーターは、外国為替、株式、暗号通貨、商品取引向けに正確なトレンド追従シグナルを提供するために設計されています。Forex FactoryやRedditのr/Forexなどのトレーディングコミュニティで称賛され、InvestopediaやTradingViewの議論でもその堅牢なトレンド検出能力で高く評価されており、信頼性の高いエントリーとエグジットを求めるトレーダーにとって必須のツールです。ユーザーは、SuperTrendのシグナルをプライスアクションと組み合わせることで、トレンド方向を最大90%の精度で特定し、リアルタイムアラートを活用してトレンドの変化を捉えることで、取引タイミングが25-35%向上したと報告しています。主な利点には、高度なトレンド分析、カスタマイズ可能な設定によるパーソナライズされた戦略、チャートを常に監視せずに意思決定を向上させる軽量デザインが含まれ、スカルパー、デイトレーダー、スイングトレーダーに最適です。 SuperTrend Alert MT4は、独自のアルゴリズ
FREE

Trading Viewで見かけたTMA - RSI DivergenceをMT4でも使えるように作成しました。 TMA RSI Divergence(TMA-RSIダイバージェンス)とは、 TMA( Triple Moving Average :三重加重移動平均) と RSI(Relative Strength Index:相対力指数) を組み合わせたテクニカル指標で、 価格とRSIの動きが逆行する「ダイバージェンス(逆行現象)」を検出する際に使われる手法です 。 通常RSI単体で見るのではなく、 RSIをTMAで平滑化(スムージング) し、 TMAライン自体をRSIの代わりに使う ことで、相場の転換点やトレンドの弱まりを、より明確に、そして長期的な視点で捉えることを目指します。 仕組みと特徴 RSIの平滑化 : 通常のRSIのノイズ(小さな値動き)を、TMAで平均化することで、トレンドの方向性や強い転換シグナルを際立たせます。 TMAをRSIの代わりに : TMA自体をオシレーター(買われすぎ・売られすぎを示す指標)として使い、価格とのダイバージェンスを見ることもあります。 5
FREE

Elliot's Triangle is taken from 1 of the 13 patterns within the Elliot Wave Theory that says social or crowd behaviour tends to reverse in recognisable patterns and of which they reveal a structural pattern that appears in nature, as well as the mass psychology of trading participants. From this, he has devised various identifiable patterns that appear in market prices. One of these is what I have named Elliot's Triangle.
This triangular pattern appears to reflect a balance of forces, causing
FREE

The Omega Trend Indicator is an advanced tool that has been specifically designed to detect market trends early, and follow them efficiently. The indicator draws two lines. The main (thicker) Trend Line represents the presumed lower or upper volatility limits of the current market trend. A break in the main Trend Line indicates a potential reversal or shift in the movement of the trend. The Trend Line also indicates the best point to place a stop loss order. In Omega Trend Indicator, the Trend L
FREE
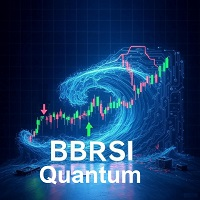
BBRSI Quantum (Free Edition) BBRSI Quantum is a powerful, 100% Non-Repainting indicator for MetaTrader 4 that generates clear Buy and Sell arrows based on an advanced momentum strategy. This tool is designed for traders who want to identify precise entry points during overbought or oversold conditions. This is the fully functional FREE edition. The Core Strategy: Bollinger Bands on RSI Unlike standard indicators, BBRSI Quantum does not apply Bollinger Bands to the price. Instead, it applies th
FREE
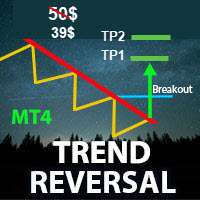
** All Symbols x All Timeframes scan just by pressing scanner button ** Discount: The price is $50$, But now it is just $39, Limited time offer is active.
*** Contact me to send you instruction and add you in "Trend Reversal group" for sharing or seeing experiences with other users. Introduction: Trendlines are the most famous technical analysis in trading . Trend lines continually form on the charts of markets across all the different timeframes providing huge opportunities for trader

GalaxyReversalPro — Trend Signal Indicator
GalaxyReversalPro is a signal-based trend indicator designed for traders who value simplicity, accuracy, and reliability.
It’s extremely easy to use and requires no additional setup.
The tool helps you enter new trends early and exit before corrections begin — maximum precision with minimal risk.The algorithm is based on structural-impulse analysis: it tracks local highs and lows, detects breakouts of key levels, and confirms trend reversals only af
FREE

シンボル: USDCHF、USDJPY、XAUUSD、GBPUSD、EURUSD、AUDUSD、GBPJPY( 私は USDCHF_H1 が大好きです )
時間足: H1, H4, D1
主な特徴: リペイントなし、遅延なし、方向性シグナル、複数の確認
安全性: シグナルにはストップロス、テイクプロフィットが含まれ、リスクリワード比を遵守 含まれるもの:無料のマルチタイムフレーム・スキャナー(本製品を購入後、プライベートメッセージでスクリーンショットを送ってください。私が直接スキャナーファイルをお送りします。)
完全なトレーディングシステムのコンセプト: 記事を読む (この記事で完全なコンセプトが説明されています) Break Out Explosion の MT5 バージョンが利用可能です: https://www.mql5.com/en/market/product/152676 1000ドル口座でのリアルトレードを公開しているライブシグナル: https://www.mql5.com/en/signals/2348010
ディスカッションに参加 MQL5コミ

Advanced Reversal Hunter Pro (ARH) is a powerful, innovative volatility-based momentum indicator designed to accurately identify key trend reversals. Developed using a special algorithm that provides a clear construction of the average volatility range, without redrawing its values and does not change them. The indicator adapts to any market volatility and dynamically adjusts the width of the band range, depending on current market conditions. Indicator advantages: Advanced Reversal Hunter Pro

Introducing the Volume Order Blocks indicator, a game-changing tool designed for traders who demand precision and clarity in their market analysis. This advanced indicator not only identifies order blocks but also integrates crucial volumetric data, allowing you to gauge the strength of these blocks with unparalleled accuracy. MT5 version - https://www.mql5.com/en/market/product/121238/ Key Features of the Volume Order Blocks: Bullish & Bearish Order Blocks: Easily visualize and dif
SMC OrderBlock Auto MT4は、Smart Money Concepts (SMC) に基づいた高度な取引インジケーターで、MetaTrader 4プラットフォーム専用に設計されています。このインジケーターは、大口の機関投資家のエントリーおよびエグジットポイントを正確に特定するのに役立ち、オーダーブロック(Order Blocks)、高値・安値(ストップ流動性:BSL、SSL)などの主要なプライスアクションパターンを複数の時間軸で認識することで、トレードの成功率と利益の可能性を高めます。 主な特徴 オーダーブロックの自動描画
オーダーブロックは、機関投資家(銀行、ファンド、多国籍企業、スマートマネー)が売買活動を集中させる重要な価格帯です。これらのゾーンは、市場の転換点やトレンド継続エリアとなることがよくあります。 このインジケーターは、買い(ブル)と売り(ベア)のオーダーブロックを自動的に検出し、水平線として表示します。これにより、トレーダーはサポートおよびレジスタンスレベルを簡単に特定できます。 モメンタム方向矢印
市場の上昇または下降モメンタムを示す矢印を表
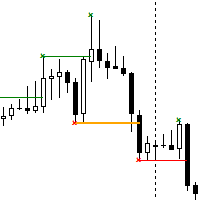
The Break of Structure (BoS) and Change of Character indicator is a powerful tool designed to identify significant turning points in price movements on financial charts within the MetaTrader 4 platform. By analyzing price action, this indicator highlights instances where the market shifts from a trend to a potential reversal or consolidation phase. Utilizing sophisticated algorithms, the indicator identifies breakouts where the structure of price movement undergoes notable changes. These breakou
FREE

Huge 70% Halloween Sale for 24 hours only!
This indicator is unstoppable when combined with our other indicator called Support & Resistance . After purchase, send us a message and you will get it for FREE as a BONUS! Introducing Trend Punch , the revolutionary forex trend indicator that will transform the way you trade! Trend Punch is uniquely designed to provide precise buy and sell arrows during strong market trends, making your trading decisions clearer and more confident. Whether you

回帰取引を意味する専門的かつ定量的なアプローチを実装する独自の指標。これは、価格が予測可能かつ測定可能な方法で迂回して平均に戻るという事実を利用しており、非定量的な取引戦略を大幅に上回る明確な出入りルールを可能にします。 [ Installation Guide | Update Guide | Troubleshooting | FAQ | All Products ]
明確な取引シグナル 驚くほど簡単に取引できます カスタマイズ可能な色とサイズ パフォーマンス統計を実装します ほとんどの取引戦略を上回ります 適切なSLおよびTPレベルを表示します 電子メール/音声/視覚アラートを実装します
使い方
インディケータは、より高い時間枠からの完全にカスタマイズ可能な移動平均の周りの標準偏差を測定し、トレンドフォローアプローチを使用して正確に取引を見つけます。取引は、現在のチャートの価格アクションに飛び込むことによって見つけられ、価格が選択したより高い時間枠から計算された平均価格帯に戻ったときに閉じられます。それがコード化される方法のために、指標は高ボラティリティと強いトレンドの市場か

The Key level wedge indicator automatically draws rising wedge pattern and falling wedge pattern for you on the chart. This pattern is really good when used as a confirmation entry at key support & resistance, supply & demand and reversal zones.
Advantages
The Key level wedge block DOES NOT RE-PAINT, giving you confidence when a signal appears and also helps when looking back. The Key level wedge includes an on/off button on the chart to easily keep the charts clean after analysis by just o
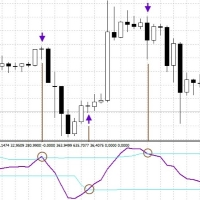
Cyclic Smoothed Relative Strength Indicator
The cyclic smoothed RSI indicator is an enhancement of the classic RSI, adding
additional smoothing according to the market vibration,
adaptive upper and lower bands according to the cyclic memory and
using the current dominant cycle length as input for the indicator. The cRSI is used like a standard indicator. The chart highlights trading signals where the signal line crosses above or below the adaptive lower/upper bands. It is much more responsive
FREE
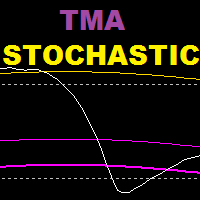
TMA Stochastic は、確率的オシレーターと TMA バンド指標に基づいた指標であり、この指標は反転戦略に基づいています。
推奨期間 : 15 歳以上
推奨設定: スキャルピングには低い値、スイングトレードには高い値
================================================= =====================
パラメーター :
tma 履歴: ストキャスティクスで tma バンドを表示するために遡るバー数
K周期(確率的)
D期間(確率的) S期間(確率的) TMA期間
TMAシフト
極端な tma 偏差 : 遠帯域の偏差
tma 偏差 : 内側バンドの偏差 --------------------------------------------------------------
FREE

トレンドトレーディング は、タイミングのプルバックとブレイクアウトにより、市場で起こっているトレンドから可能な限り利益を得るように設計された指標です。確立されたトレンドの中で価格が何をしているかを分析することにより、取引の機会を見つけます。 [ インストールガイド | 更新ガイド | トラブルシューティング | よくある質問 | すべての製品 ]
自信を持って効率的に金融市場を取引する むち打ちにならずに確立されたトレンドから利益を得る 収益性の高いプルバック、ブレイクアウト、早期の逆転を認識する この指標は、独自の品質とパフォーマンスを分析します 複数時間枠のダッシュボードを実装します インジケーターは再描画されていません 電子メール/音声/視覚アラートを実装します 確立されたトレンドは多くの取引機会を提供しますが、ほとんどのトレンド指標はそれらを完全に無視しています。インジケーターの解釈はかなり簡単です:
(1) トレンドの変化
(2) トレンドの方向への後退 (3) トレンドの方向へのブレイクアウト 赤いダッシュ は下降トレンド中の修正です 青いダッシュ は上昇トレンド中

This indicator has been created for finding the probable reversal points of the symbol price. A small candlestick reversal pattern is used it its operation in conjunction with a filter of extremums. The indicator is not redrawn! If the extremum filter is disabled, the indicator shows all points that have a pattern. If the extremum filter is enabled, the condition works – if the history Previous bars 1 candles back contains higher candles and they are farther than the Previous bars 2 candle, such
FREE

This indicator help to mark the high and low of the session Asian,London,Newyork , with custom hour setting
This indicator is set to count from minute candle so it will move with the current market and stop at the designated hour and create a accurate line for the day.
below is the customization that you can adjust :
Input Descriptions EnableAsian Enables or disables the display of Asian session high and low levels.
EnableLondon Enables or disables the display of London session high and
FREE

FOLLOW THE LINE GET THE FULL VERSION HERE: https://www.mql5.com/en/market/product/36024 This indicator obeys the popular maxim that: "THE TREND IS YOUR FRIEND" It paints a GREEN line for BUY and also paints a RED line for SELL. It gives alarms and alerts of all kinds. IT DOES NOT REPAINT and can be used for all currency pairs and timeframes. Yes, as easy and simple as that. Even a newbie can use it to make great and reliable trades. NB: For best results, get my other premium indicators for more
FREE
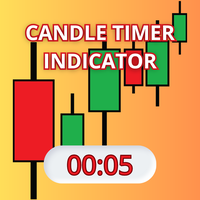
Candle Timer Indicator is a custom tool designed for the MetaTrader 4 (MQL4) trading platform. Its primary purpose is to display a moving timer on the chart, indicating the remaining time before the current candle closes. This feature is particularly useful for traders who need precise tracking of candle closing times for their technical analysis strategies. My indicators for free. I onl
FREE
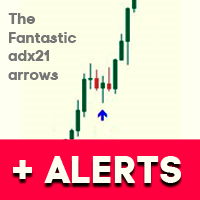
.See screenshots of the indicator. Uses information about the current trend. It is based on the classic ADX indicator. Gives a signal to enter a trade using a non-standard strategy.
Settings: Name Description Period of ADX The period of the classic ADX indicator Distance between +D & -D lines Distance between + D and -D lines . Determines the strength of the trend. Freshness of the signal (bars) Checking the freshness of a buy or sell signal.
Selects the very first signal in the span.
The numbe
FREE

Special offer : ALL TOOLS , just $35 each! New tools will be $30 for the first week or the first 3 purchases ! Trading Tools Channel on MQL5 : Join my MQL5 channel to update the latest news from me 用の画期的な RSI Kernel Optimized with Scanner をご紹介します。この最先端ツールは、強力なカーネル密度推定 (KDE) アルゴリズムを統合することで、従来の RSI 分析を再定義します。この高度なインジケーターは、リアルタイムでの市場トレンドのインサイトを提供するだけでなく、複数の通貨ペアや時間枠を同時にスキャンできるダッシュボードも備えています。このツールがトレードアーセナルに必須な理由をご紹介します。 See more MT5 version at: RSI Kernel Optimized with Scanner for M

Volume Gives Depth To Price Action! Volume Critical can accurately locate the cheapest areas to place trades. Enter reversals as early as possible to get the best Risk Reward setups!
Features Aggressive algorithm that anticipates reversals Volume Classifications Gray Histograms - Normal Volume, average market activity Orange Histogram - Trending Volume, increased market activity Pink Histograms - Overbought Volume, we can wait for further confirmation to sell Blue Histograms - Oversold Conditio

SX Trend Impulse Channels is a precisely designed trend-following system that represents trend development through distinct, volatility-adjusted steps. Instead of relying on traditional slope-based methods, it employs a structured step mechanism that only advances when price action conclusively confirms momentum via an ATR-based trigger.
This indicator is well suited for traders who favor structured, stair-step trend progression over smooth, continuous curves. It delivers clear momentum-based
FREE
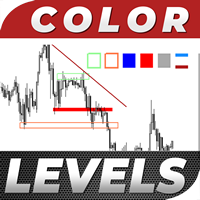
Color Levels is a convenient tool for traders using a Trendline and a Rectangle in their technical analysis. It allows setting two empty rectangles, three filled ones, and two tredlines. The indicator parameters are very simple and divided into numbered blocks: The ones beginning with 1 and 2 - empty rectangle (frame) parameters; 3, 4, and 5 - filled rectangle parameters; 6 and 7 - trendline parameters. Simply click a desired object and it will appear in the upper left corner. Main Adjustable Pa
FREE
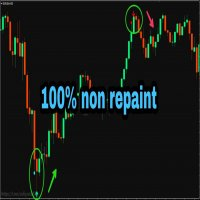
PLEASE NOTE You can customize the settings of K_period value, the oversold and the overbought value is customizable. You can change it as per your requirement. The accuracy will change as per your settings.
100% Non repaint indicator
Pre-alert (get ready) signals
Non-delay indications
24/7 signals
100% No lag
No recalculating The arrows wont repaint even if the signal fails, or you refresh or restart the mt4 Indicator is based on simple crossover strategy of main line and signal line of St
FREE
出来高分解インデックス(VDI) VDI は、出来高を買いと売りに分解して分析することにより、価格の動きの強さと方向性を特定するために開発された独自のボリューム分析インジケーターです。 このインジケーターは、ローソク足の価格データを出来高に投影することで、買いと売りの比率を視覚化します。これにより、トレーダーは市場の活動状況をより包括的に把握でき、買い取引と売り取引がどの程度行われたのかを明確に判断できます。 計算は、取引所から得られるすべての情報に基づいて行われており、分析精度が高く、市場のトレンドを深く評価することが可能です。 取引量の知識は、市場の価格変動を理解するための重要な要素です。このインジケーターはまさにその情報を提供します。
主な特徴 調整可能な唯一のパラメーター : period (デフォルト=18)
何本のバーを使って買いと売りの出来高を集計するかを設定します。 メイン計算式:
買いの出来高 ÷ 売りの出来高
指定した期間における買いと売りのどちらが優勢かを判断できます。 柔軟な期間設定:
トレーディングスタイルに合わせて、集計期間を自由に調整可能。 1.0
FREE

Forex Gunslinger は、MTF モードでサポート/レジスタンス、クロスオーバー、オシレーターを組み合わせるというアイデアに基づいて設計された、買い/売りのリバーサル シグナル インジケーターです。すべてが揃うと、インジケーターは買いまたは売りのシグナルを生成します。このインジケーターは MTF のアイデアに基づいていますが、アルゴリズムは非常に安定しており、信頼性の高い反転シグナルを生成します。これは MTF タイプのインジケーターで、より高い時間枠またはより低い時間枠を使用して現在のチャートのシグナルを計算できます。ただし、非 mtf モードでも使用できます。ただし、元のアイデアは、インジケーターを真に輝かせる MTF モードで使用することでした。 Forex Gunslinger インジケーターは、あらゆる取引手段と時間枠で使用できます。通貨、指数、株式、仮想通貨、金属で使用できます。あらゆる取引手段で機能します。 このインジケーターは、PUSH 通知を含むあらゆる種類のアラートを提供します。 取引のヒントと素晴らしいボーナスを入手するには、購入後にご連絡ください。
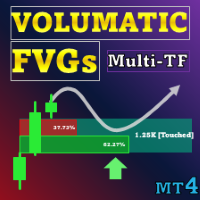
特別オファー : ALL TOOLS 、各 $35 ! 新ツール は 最初の1週間 または 最初の3回の購入 に限り $30 です! Trading Tools Channel on MQL5 :最新情報を受け取るため、私の MQL5 チャンネルに参加してください Volumatic Fair Value Gaps (FVG)は、有意な価格アンバランス領域を特定・維持し、各ギャップ内の方向性ボリュームを分解します。ボリュームは下位タイムフレーム(デフォルト M1、ユーザー選択可)から取得し、買い/売りに分割して、合計が100%となる2本のパーセンテージバーで表示します。各 FVG の右端には総出来高ラベルも表示されます。価格が反対側の境界を越えたとき(終値ベース=厳格、または高値/安値の接触=敏感)、設定に従いギャップはミティゲーションされ、削除されます。
MT5 版の詳細: Volumatic Fair Value Gaps MT5 Multi Timeframe MT4 版の詳細: Volumatic Fair Value Gaps MT4 Mul
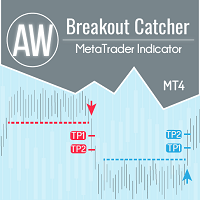
価格レベルの内訳、高度な統計、TakeProfit 計算、および 3 種類の通知。 利点: 結果を再描画しないでください ろうそくの終わりに厳密に信号を送る False Breakdown フィルタリング アルゴリズム どんなトレンド戦略にもよく合います。 すべてのツールと時系列で動作します マニュアルと説明 -> ここ / 問題解決 -> ここ / MT5 バージョン -> ここ インジケーターで取引する方法 わずか 3 つの簡単なステップで AW ブレイクアウト キャッチャーを使用して取引できます。 ステップ 1 - ポジションを開く 70% 以上の成功率で買いシグナルが受信されました ステップ 2 - ストップロスの決定 逆信号でトランクを選択 ステップ 3 - テイクプロフィット戦略の定義 戦略 1: TP1 に到達したらポジション全体をクローズする 戦略 2: TP1 に達した時点でポジションの 50% をクローズし、TP2 に達した時点で残りの 50% をクローズします。 戦略 3: 反対のシグナルでポジション全体を決済する 統計モジュール ペアをより適切に選択

Overview Happy Lion is a Smart Money Zone indicator, it scans historical data to identify specific candlestick patterns, these are the areas where large institutions (banks/hedge funds) leave behind significant "footprints" in the form of unfilled orders. Demand Zones (Bullish): Highlights the last bearish candle before a strong, impulsive upward breakout. Supply Zones (Bearish): Highlights the last bullish candle before a strong, impulsive downward breakout. Automatic Drawing: Once a valid zon
FREE
NYXORA SIGNAL – Precision Scalping Power for XAUUSD (M1) NYXORA SIGNAL is an advanced scalping indicator designed exclusively for XAUUSD (Gold) on the M1 timeframe .
It automatically detects potential reversal zones and refines them into a precise 30-pip area , giving traders fast and accurate entries in the ultra-volatile Gold market. Main Features Auto Reversal Zone Detection – Smart algorithm that identifies and refines potential reversal areas into a consistent 30-pip zone. Custom SL & TP Le
FREE

The indicator identifies when a divergence occurs between price and an indicator or oscillator. It identifies bullish and bearish hidden or regular (classical) divergences. Combined with your own rules and techniques, this indicator will allow you to create (or enhance) your own powerful system. For higher probability setups I can recommend you to use my Supply Demand indicator and trade only if the divergence occurs inside a zone. Supply zone for bearish div and demand zone for bullish div. T
FREE
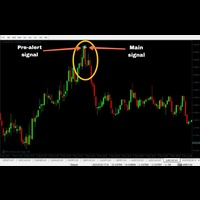
100% non-repaint MT4 indicator with advance pre alert
Recommended candle timeframe M15
Trade expiry 15 minutes
Call buffer 0
Put buffer 1
Intrabar
Pros Neural Network based Advance price action algorithms Advance trend filtering algorithms Advance consolidation filtering algo
Pre-alert (get ready) signals
Non-delay indications
Auto-trading supported
100% Non repaint
100% No lag
No recalculating
Lifetime license
Cons Very few signals
Instructions to use
1 Do not enter a trade if pre-a
FREE
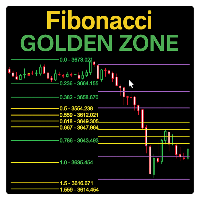
Fibonacci Sessions インジケーターは、精密なスキャルピングと日中取引戦略のために設計された強力なトレーディングツールです。 ニューヨーク、ロンドン、アジアの各セッションの主要なフィボナッチレベルを自動的にプロットし、トレーダーに主要市場セッションにおける価格変動の明確なビューを提供します。 各セッションでは、価格が最も反応するユニークな「ゴールデンゾーン」が強調表示されます。 これにより、反転、ブレイクアウト、継続パターンのための非常に信頼性の高いゾーンが作成されます。 インジケーターは、価格がどのように一つのゴールデンゾーンから別のゴールデンゾーンへと頻繁に移動するかを視覚的に示し、トレーダーが安定したチャンスを捉えるのに役立ちます。 XAUUSDのM5タイムフレームに最適化されており、他の通貨ペアや世界の指数でも優れたパフォーマンスを発揮します。 ゴールド、通貨ペア、または株価指数を取引する場合でも、このセッションベースのフィボナッチマッピングは、高確率の取引ゾーンを特定する上で追加の優位性を提供します。 赤い線: 極限利益ターゲットレベル。 黄色
FREE

チャート投影インジケーター チャートの予測は、組み込みのジグザグテクニカルインジケーターを使用して将来の価格アクションを予測する小さなインジケーターとして始まりました(古いアルゴリズムはコメントで見つけることができます)
アイデアは単純で、 過去の価格行動は未来に変換されませんが、過度に具体的、または過度に一般的でない場合は、何が起こる可能性があるかについてのガイドラインを抽出できます。
チャート投影の「論文」はこれです: トレーダーはチャートを見て決定を下すので、アルゴリズムはチャートも見ることができます。指標値を読み取らない、価格を読み取らないが、チャートを見る 何かを探すことは、繰り返しのなじみのあるパターンを見つけることです。そして、そのなじみのあるパターンを見つけるためには、それを保存する必要があります。
ジグザグはそれだけでは不十分であり、それを実行し、チャートの視覚的側面に関するデータを保持する新しいアルゴリズムが必要でした。したがって、光学アルゴリズムが必要でした。
チャートプロジェクションには、ペア価格アクションの低、中、高範囲スキャン用の3つの光学アルゴリ
FREE

My Intraday trading session indicator. SL Session Strength 28 Pair https://www.mql5.com/en/market/product/57585 This strategy is even used by the Banks to make profits. They take a strong currency and pitch against a weak currency This indicator allows you to analyze the hidden trends and correlations between the 8 most traded currencies via unique strength meter which creates multiple charts in a single window based on the price action of each currency in relation to all other currenci

Divergence and Convergence are important harbingers of reversals in stock markets.
The Divergence Sync indicator is designed to automatically search for divergences on a large number of indicators with different parameters.
The search for divergences is carried out on these indicators: (CCI, CHO, DeMarker, MACD, MFI, Momentum, OBV, OsMA, RSI, Stochastic, WPR, Awesome Oscillator ).
To search for divergences, you can use one technical indicator or search simultaneously on any number of indicator
The AX Forex Indicator MT4 is a sophisticated trading tool designed to provide traders with a comprehensive analysis of multiple currency pairs. This powerful indicator simplifies the complex nature of the forex market, making it accessible for both novice and experienced traders. AX Forex Indicator uses advanced algorithms to detect trends, patterns and is an essential tool for traders aiming to enhance their forex trading performance. With its robust features, ease of use, and reliabl
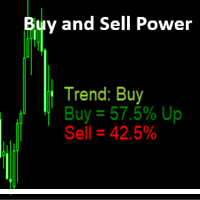
Simple Indicator that shows the Buy and Sell volume in percent. Feel free to join my Telegram Channel
Settings : Font size for percentage labels Horizontal offset from right edge (pixels) Vertical offset for Signal label from bottom (pixels) Vertical offset for Buy label from bottom (pixels) Vertical offset for Sell label from bottom (pixels) Color for Buy label Color for Sell label Color for Strong Buy signal Color for Buy signal Color for Strong Sell signal Color for Sell signal Color f
FREE

I prepared an indicator Showing BUY and SELL probability by checking Higher Time Frames... It’s quick, easy to read, and free. Enjoy, and let me know how it boosts your trading! By tweaking the timeframe weightings , smoothing , and support/resistance influence , you can adapt the indicator’s Buy/Sell probabilities to your personal trading style. Keep an eye on both the on-chart labels and subwindow histogram to quickly see when the bias shifts, then combine this with your own trading rules for
FREE

The ZUP is based on two ideas. Idea 1 - combine a variety of methods for identifying extremums (minimums and maximums) on the market price charts in a single indicator. Idea 2 - make it possible to easily bind various graphical tools, which allow to analyze the market behavior, to the identified extremums. To implement the first idea , the following has been made in the indicator. Included multiple ZigZag algorithms. Standard ZIGZAG algorithm. The basis of this algorithm is taken from the ZigZag
FREE
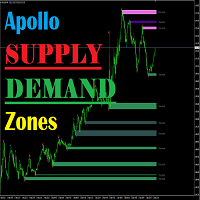
Apollo Supply Demand Zones は、サポートとレジスタンスのレベルを計算する指標です。このインジケーターは、使用する戦略に関係なく、すべてのトレーダーにとって絶対に役立ちます。この指標は、取引システムの主要な要素の 1 つになる可能性があります。このインジケーターは、現在の時間枠でレベルを計算し、MTF モードで動作して、より高い時間枠からのレベルを表示できます。この指標は、任意の時間枠で、任意の取引商品で絶対に使用できます。インジケーターは、実際に市場の全体像を表示するさまざまなタイプのレベルを示します。このインジケーターは音声アラートを提供するため、このインジケーターの操作が非常に 購入後、必ず私に書いてください!インジケーターの使用に関する推奨事項を共有します。あなたを待っている素晴らしいボーナスもあります!

Indicator determines the direction of price movement, calculates the possibility of entering the market using an internal formula and displays a breakout entry signal. Indicator signals appear both at the beginning of trend movements and in the opposite direction, which allows you to open and close orders as efficiently as possible in any of the market conditions. Version for МТ5: https://www.mql5.com/en/market/product/58980
Benefits: a unique signal calculation formula; high signal accuracy; d
FREE

Индикатор строит блоки заказов (БЗ) по торговой системе (ТС) Романа. Поиск блоков осуществляется одновременно на двух таймфремах: текущем и старшем (определяемым в настройках). Для оптимизации и игнорирования устаревших блоков в настройках задается ограничение количества дней в пределах которых осуществляется поиск блоков. Блоки строятся по правилам ТС состоящем из трех шагов: какую свечу вынесли (что?); какой свечой вынесли (чем?); правило отрисовки (как?).
FREE

RelicusRoad Pro: 定量的市場オペレーティングシステム 【期間限定】無制限アクセス 70% OFF - 2,000人超のトレーダーと共に なぜ多くのトレーダーは「完璧な」インジケーターを使っても失敗するのでしょうか? それは、文脈を無視して 単一の概念 だけでトレードしているからです。文脈のないシグナルは単なるギャンブルです。勝ち続けるには、 根拠の重なり(コンフルエンス) が必要です。 RelicusRoad Proは単なる矢印インジケーターではありません。完全な 定量的市場エコシステム です。独自のボラティリティモデリングを用いて、価格が推移する「適正価値の道(Fair Value Road)」をマッピングし、ノイズと真の構造的ブレイクを判別します。 推測はやめましょう。機関投資家レベルの「ロード・ロジック」でトレードを。 コアエンジン:「Road」アルゴリズム システムの中心となる Road Algo は、市場環境にリアルタイムで適応するダイナミックなボラティリティチャネルです。 安全ライン(平衡点) と、価格が数学的に反転しやすい 拡張レベル を投影します。 Si
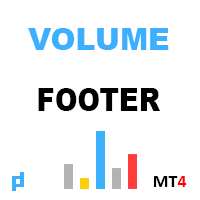
インジケータは、垂直方向の音量を示しています。 設定では、高と極を決定するための2つの係数、および低ボリュームを決定するための1があります。 同様のアルゴリズムが指標 UDP1 Volume Pixel でも使用されます。 指定されたボリュームが検出されると、ヒストグラムは適切な色で着色されます。 ヒストグラムの幅は、スケールに応じて自動的に選択されます。 原則として、価格は最大量と最小量に反応します。 しかし、確認信号を使用する必要があります。
入力パラメータ 。
基本設定 。 Bars Count - インジケータが表示されるキャンドルの数 。 Calc Bars - ボリューム偏差を決定するためのキャンドルの平均数 。 Low Volume Factor - 我々は、低ボリュームを定義する以下の係数 。 High Volume Factor - 我々は大きなボリュームを定義する上の係数 。 Extreme Volume Factor - 我々は極端なボリュームを定義する上の係数 。
視覚的な設定 。 Histo Color - キャンドルのボリュームと方向に応じてヒストグ
FREE

This is a Multi pair and Multi time frame dashboard. The founder of the system is Mr. Oma Ally, which is a system based from Bollinger Band and Moving Average(BBMA). BBMA consists of the use of 2 indicators: Moving Averages Bollinger Bands BBMA consists of 3 types of entries: Extreme MHV Re-Entry Rejection EMA50 This Dashboard Help you to scan current Extreme, Reentry setup, Rejection EMA50 and also MHV How to read signals:
find the same color in 3 different timeframes in succession
For exampl
FREE
MetaTraderマーケットは、開発者がトレーディングアプリを販売するシンプルで便利なサイトです。
プロダクトを投稿するのをお手伝いし、マーケットのためにプロダクト記載を準備する方法を説明します。マーケットのすべてのアプリは暗号化によって守られ、購入者のコンピュータでしか動作しません。違法なコピーは不可能です。
取引の機会を逃しています。
- 無料取引アプリ
- 8千を超えるシグナルをコピー
- 金融ニュースで金融マーケットを探索
新規登録
ログイン