YouTubeにあるマーケットチュートリアルビデオをご覧ください
ロボットや指標を購入する
仮想ホスティングで
EAを実行
EAを実行
ロボットや指標を購入前にテストする
マーケットで収入を得る
販売のためにプロダクトをプレゼンテーションする方法
MetaTrader 4のためのテクニカル指標 - 129

The KT Buy Sell Volume is a powerful tool traders use to gauge the strength and weakness of price movements. In the whirlwind of the Forex market, traders aim to identify and ride the waves of a bullish or bearish trend that exudes strength and potential. However, recognizing these trends necessitates a method, metric, or indicator to quantify their strength. One crucial factor that traders examine for this purpose is volume. Volume refers to the number of shares or contracts traded in a securit
KT Momentum Histogram は、特定の資産のモメンタムを可視化し、トレンドの強さと方向性を判断するのに役立ちます。インジケーターは取引のモメンタムを基に算出・動作します。
モメンタムヒストグラムとは
モメンタムとは、資産の価格または出来高の加速度を示す指標で、一定期間における価格の進む速度を測定します。正のモメンタムは価格上昇、負のモメンタムは価格下落を示します。モメンタムヒストグラムはゼロラインを中心に振動する縦棒グラフです。
棒がゼロラインより上にあれば強気モメンタム、下にあれば弱気モメンタムと見なします。棒が高いほど(低いほど)モメンタムは強くなります。
機能
トレンド判定: 棒がゼロラインを上抜けると上昇トレンド開始の可能性、下抜けると下降トレンドの示唆となります。 モメンタムの強弱: 大きな棒は強い勢い、小さな棒は弱い勢いを示します。 買われ過ぎ/売られ過ぎ: 極端な正値は買われ過ぎで反落の可能性、極端な負値は売られ過ぎで反発の可能性を示唆します。 ダイバージェンス検出: 価格が高値更新でも棒が下がれば弱気ダイバージェンス、価格が安値更新でも

This is the Full Version, to get the free version please contact me.
The free version works on “AUDNZD” and “XAUUSD” charts.
All symbols and time frames scanner
Head and Shoulder
One of the most popular Price Action patterns is the Head and Shoulders pattern. The pattern has three local tops that resemble the left shoulder, head, and right shoulder. The head and shoulders chart pattern appears in all kinds of markets, including Forex, cryptocurrency, commodities, stocks, and bonds. The head

Graph's roller-coaster
MT Roller Coaster :
Inspired by the graph's roller-coaster-like movement, this tool uses color bands to signal trends effectively.
The band colors simplify order decisions:
Downtrend: Bands 2 and 3 turn red, signaling sell opportunities.
Uptrend: Bands 2 and 3 appear sky blue, suggesting buy orders.
Sideways: Alternating band colors allow both buy and sell trades, suitable for scalping strategies.
Major trend entries are identified at the outer bands, with corr
KT Knoxville Divergenceは、相対力指数(RSI)とモメンタムオシレーターを巧みに組み合わせることで、金融商品のユニークな価格ダイバージェンスを明らかにする強力なツールです。このインジケーターは、市場の微妙な動きを効果的に捉え、トレーダーがより高い精度で有望な取引機会を特定するのに役立ちます。 Knoxville Divergenceは、Rob Bookerによって開発された取引手法の一種です。取引におけるダイバージェンスとは、資産価格の動きとテクニカル指標(オシレーター)が反対方向に動く現象を指します。このズレは、現在の価格トレンドが弱まっており、反転する可能性があることを示すシグナルとなる場合があります。 これは、最適なエントリーおよびエグジットポイントを探しているトレーダーにとって非常に有用です。インジケーターは、これらのダイバージェンスが発生した際に、価格チャート上に視覚的なシグナルを表示します。
Knoxville Divergenceの理解
Knoxville Divergenceは、トレンドに逆らう取引や、長期トレンドに沿う前に小さな押し目や戻りを
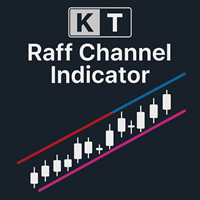
KT Raff Channelは、1996年にGilbert Raffが考案したオリジナルのラフチャネルコンセプトを改良・洗練させたバージョンです。このインジケーターは、ラフ氏の初期の理論をもとに、改良と最新技術を取り入れ、より高度で強力なツールとして提供されます。 金融市場分析の分野で著名なGilbert Raff氏は、Raffリグレッションチャネルの開発者です。このテクニカルツールは、市場の価格トレンドを識別・検証するために設計されています。選択した価格範囲の中間点を通る線形回帰線を引き、その回帰線の両側に等距離のラインを描くことで機能します。
特徴
トレーダーが市場トレンドを簡単に特定・確認できるよう支援します。ミッドラインの方向を解釈することで、市場が上昇トレンドか下降トレンドかを素早く判断できます。 チャネルの極端なレベルで最適なエントリーポイントを示し、売買の戦略立案をより簡単にします。この明確な指標により、利益の最大化と損失の最小化を支援します。 日中のすべての時間足、日足、週足、月足チャートで動作します。この柔軟性により、短期取引にも長期取引にも対応できます。 効果

Introducing Auto Trendline Pro : Your Ultimate Trading Companion Are you tired of manually drawing trendlines on your forex charts? Do you wish for a tool that can simplify your trading while providing timely alerts? Look no further, because Auto Trendline Pro is here to revolutionize your trading experience. In the fast-paced world of forex trading, staying ahead of the curve is essential. Identifying trends, both upward and downward, can be a game-changer. This is where Auto Trendline Pro s

The KT Risk Management Indicator provides a comprehensive overview of the profit/loss and risk management characteristics of your Metatrader account, offering valuable insights and information. It efficiently categorizes the displayed information at account and symbol levels, ensuring a clear and organized presentation of crucial data. Risk is inherent when trading the Forex market - a reality that seasoned traders acknowledge and beginners quickly realize. To succeed in this volatile market, t

The KT Trades Info indicator is useful for traders wishing to stay informed about their trading performance. This indicator provides real-time updates on the profitability of all ongoing and completed trades, enabling traders to make well-informed decisions. By incorporating key financial metrics, it provides a comprehensive picture of a trader's financial status at a glance. This means traders can monitor their performance with increased accuracy and precision, facilitating better risk manageme

The KT 4 Time Frame Trend is an invaluable forex indicator for traders seeking to identify the trend direction across 4-time frames accurately. This innovative indicator allows users to simultaneously observe and analyze price trends across four different timeframes. Whether you're a beginner or an experienced trader, this tool offers an enhanced understanding of trend dynamics, leading to improved trading strategies on your trading platform. The capability to concurrently monitor multiple timef

xTrendでトレンドを一目瞭然に! メリット ・ トレンドが一目瞭然:違う色と違う太さの上昇線、下降線、レンジ線が互いに繋がって指定された過去一定期間(Barの数)から現在までの全体的なトレンドが目立ちに表示されて裁量トレードを速やかに実現できる! ・Pipsが表示可能:そのトレンド線がどれほど変化したかはPipsの表示ですぐに明らかになる。 ・設定簡単:表示期間、各線の色と太さ、Pips表示、それだけの設定。もデフォルトの値は最適ですので 設定なしでもぜんぜんOK!アルゴリズムに関する難しいパラメターは一切なしので全てアルゴリズムに任せて良い! ・独自のアルゴリズム:長い年月に磨いた世界唯一無二のアルゴリズム、トレンド判断の正確率抜群! ・任意の時間足に適用 ・任意の銘柄に適用 ・任意のFX会社 に適用 ・MT4版・MT5版両方対応 ・多言語対応

「Scalper_PRO」インジケーターは、チャート上の再描画や遅延のない 2 つのラインとシグナルの形式のベースメントインジケーターです。 「Scalper_PRO」インジケーターは、トレンドに沿った最適なエントリーポイントをチャート上に表示します。 このインジケーターは M1 タイムフレームで良好な結果を示しています。 信号はローソク足が閉じた後に生成され、青と赤の矢印の形で表示され、ドットの形で予備信号が表示されます。 「Scalper_PRO」インジケーターはスキャルピング用に設計されています。 スクリーンショットはポジションエントリーポイントの例を示しています。 「Scalper_PRO」インジケーターを使用して取引する場合、インジケーターアルゴリズムには独自のスキャルピング戦略が含まれているため、常に黒字になります。

はじめに バイナリーオプションと外国為替取引の高速な世界では、成功と失敗の違いを生み出すことができる適切なツールと戦略を手にすることが重要です。そのようなツールの1つは、チャートパターン、移動平均、取引量の組み合わせを活用してトレーダーが情報に基づいた意思決定を支援する、画期的な取引手法であるBBBブラックブルーバイナリーオプションインジケーターシステムです。この包括的なガイドでは、BBBシステムの複雑な部分を掘り下げ、その仕組み、使用方法、そしてあなたの取引パフォーマンスを潜在的に向上させる方法を説明します。 BBBインジケーターシステムの説明 BBBブラックブルーバイナリーオプションインジケーターシステムは、バイナリーオプションと外国為替取引の最適なエントリーと出口ポイントを特定するのを支援するために設計された洗練されたテクニカル分析ツールです。その名前は、主要な取引シグナルを表す「黒」と「青」から来ています。 チャートパターン BBBシステムは、取引チャートの特定された部分を分析することから始まります。これは、サポートとレジスタンスレベル、トレンドライン、ろうそく足パターンなどの
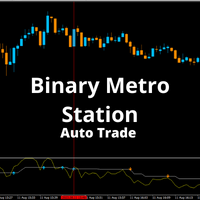
「メトロ駅」:成功する自動取引への道 「メトロ駅」は、先端の手法と賢明なアルゴリズムの交差点で動作する、前衛的なMT4自動取引シグナルです。精密な取引の世界に足を踏み入れましょう。「メトロ駅」は、移動平均線(MA)、相対力指数(RSI)、ストキャスティクスオシレーター、モメンタム、および平均方向指数(ADX)の強さを活用して、洗練された取引シグナルを生成します。これは、指導を求める初心者トレーダーと、取引プロセスを効率化しようとする熟練トレーダーの両方に対応するよう設計されています。 「メトロ駅」の機能の中心には、これらの重要なテクニカル指標を組み合わせる独自の戦略があり、これによりデータ駆動の洞察の調和した収束が生まれます。移動平均線は基本的なトレンド分析を提供し、市場のノイズを取り除き、価格の動向の真の方向を明らかにします。市場が買われ過ぎか売られ過ぎかを判断することで、RSIとストキャスティクスオシレーターは、トレーダーが可能性のある反転または継続を予測するのに役立つ追加の確認レベルを提供します。一方、モメンタムは市場の活気を評価し、現在のトレンドの強度を窺うための窓を提供します
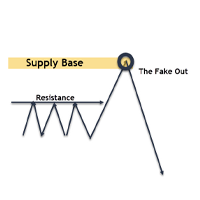
Fakeout Detector Indicator The "Fakeout Detector" indicator is a tool designed to assist traders in identifying potential false price movements (fakeouts) in the financial markets. A fakeout is a condition where the price of an asset appears to be moving in one direction but then reverses, causing losses for traders who incorrectly take positions. This indicator helps traders avoid or anticipate fakeouts by identifying key points in price movements. Indicator Output Functions: Arrow Up (Upward A

The Awesome Cross Trend Signal Indicator is a powerful tool designed to assist traders in making informed decisions in the financial markets. This advanced indicator leverages cutting-edge algorithms and technical analysis to identify potential entry points with high accuracy.
Features: 1. Precision Entry Points: The indicator generates precise arrow signals on the chart, highlighting potential entry points for various trading strategies.
2. Trend Identification: By analyzing price movem

The Levels indicator has been created to simplify the process of plotting support and resistance levels and zones on selected timeframes. The indicator plots the nearest levels of the selected timeframes, which are highlighted in different colors. It significantly reduces the time needed to plot them on the chart and simplifies the market analysis process. Horizontal support and resistance levels are used to identify price zones where the market movement can slow down or a price reversal is lik

This pass-band oscillator reduces lag in market data by filtering out high and low frequencies. It uses two EMAs (Exponential Moving Averages) with periods of 40 and 60.
Trigger points are added using an RMS cyclic envelope over the Signal line. The pass-band waveform output is calculated by summing its square over the last 50 bars and taking the square root to create trigger levels.
Buy when the pass-band crosses above its -RMS line and short when it crosses below the RMS line. The indicator

This is the Full Version, to get the free version please contact me. The free version works on “USDJPY” charts. All symbols and time frames scanner. Contact me after payment to send you the User-Manual PDF File. OVER and UNDER
Over & Under pattern is an advanced price action trading concept in the trading industry. The Over & Under pattern is more than a confluence pattern or entry technique than a trading strategy. It is a reversal pattern that is created after a significant obvious trend. It

This is the Full Version, to get the free version please contact me. The free version works on “GBPCHF” charts. All symbols and time frames scanner. Harmonic Pattern
Harmonic patterns are used in technical analysis that traders use to find trend reversals. They are considered one of the most accurate technical analysis tools, as they allow traders to predict the future price movement direction and the potential trend targets. Also, unlike many other technical tools, the number of false signals

The Real Strong Signal Signal Indicator is a powerful tool designed to assist traders in making informed decisions in the financial markets. This advanced indicator leverages cutting-edge algorithms and technical analysis to identify potential entry points with high accuracy.
Features 1. Precision Entry Points: The indicator generates precise arrow signals on the chart, highlighting potential entry points for various trading strategies.
2. Trend Identification: By analyzing price movemen

Title : UT_Bot - ATR-Based Trading Indicator Introduction : Discover the power of "UT_Bot," the ultimate trading indicator that leverages the Average True Range (ATR) to provide unparalleled accuracy in your trading decisions. If you're seeking a more reliable alternative to the Super Trend indicator, look no further. UT_Bot is your key to precision trading. Key Features : ATR-Powered Precision: UT_Bot uses the ATR to deliver accurate signals that adapt to market volatility. Enhanced Trend Detec

Title : Market Bias Indicator - Oscillator-Based Trading Tool Introduction : Discover the potential of the "Market Bias Indicator," a revolutionary oscillator-based trading tool designed for precise market analysis. If you're in search of a robust alternative to traditional bias indicators, your quest ends here. Market Bias Indicator offers unparalleled accuracy in identifying market sentiment and is your gateway to confident trading decisions. Recommended Trading Pairs : Market Bias Indicator i
ATR Stops is an indicator which shows Dynamic support and resistance lines by considering ATR value and also a multiplier. its highly effective to find out the trend direction and also is useful for using as stop loss levels. it could be used in different ways one usual way is to buy when line becomes green and sell when it becomes red. when its combined with money management rules and risk reward considerations there is good results.

Pivot Point Super Trend is another type of famous super trend indicator which is equipped with pivot points in different way. this indicator used to be available in the Trading view and this is converted from there to the MT4 language. MT5 version of the indicator is also available and you can find in my products. there are also buy/sell signals shown on the screen.

Pure Safe Trend indicator is designed for signal trading. This indicator generates trend signals.
It uses many algorithms and indicators to generate this signal. It tries to generate a signal from the points with the highest trend potential.
This indicator is a complete trading product. This indicator does not need any additional indicators.
The indicator certainly does not repaint. The point at which the signal is given does not change.
Features and Suggestions Time Frame: H1 Work

Indicador: Engulfing Candle Strategy El indicador "Engulfing Candle Strategy"! Este indicador personalizado para MetaTrader 4 identifica y resalta automáticamente las formaciones de velas "Engulfing", una poderosa señal técnica utilizada por traders de todo el mundo. ¿Qué es una vela "Engulfing"? Una vela "Engulfing" es una formación de dos velas consecutivas en un gráfico de precios. La primera vela es más pequeña y está completamente contenida dentro del rango de la segunda vela, que es sign

Line Breakouts - System for trend trading.
Contains a trend identifier that can be adapted to any chart and trading instrument using the period and smoothing function.
And a determinant of support and resistance levels. When the price is below the resistance line, open Sell trades, and when the price is above support lines - open Buy transactions. Stop loss should be placed a few points from the lines, Take Profit should be fixed after several candles (3-10-15), based on the time frame.
The indi
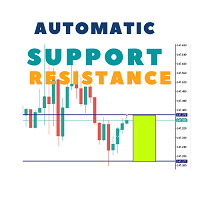
This Automatic support/resistance indicator calculates various peaks and troughs of the price action, identifies relevant levels and draws support and resistance automatically. It uses the built-in "ZigZag" indicator in Metatrader as a data source hence, very much accurate indicator. The support and resistance lines are contineusely updated as new levels and formed. The indicator has only 5 parameters to set, and mostly it can be used with the default values: The description of the settings is
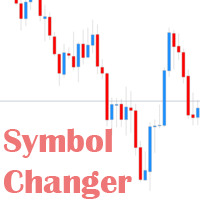
Symbol Changer This indicator makes it easier to change chart symbol, useful if a trader deals with many pairs.
User Inputs:
Indicator Custom Unique ID : Can make a custom ID for each Indicator when attach more 1 indicator. Show Profit Loss : Optional show Profit and Loss for each pair. Option Horizontal / Vertical button : Button to choose Horizontal or Vertical display. Optional display positions : Show in main Chart area and/or bottom chart. Main Pairs Preset / Own Pair : group pairs for e

The Nice Pro Signal Signal Indicator is a powerful tool designed to assist traders in making informed decisions in the financial markets. This advanced indicator leverages cutting-edge algorithms and technical analysis to identify potential entry points with high accuracy.
Features: 1. Precision Entry Points: The indicator generates precise arrow signals on the chart, highlighting potential entry points for various trading strategies.
2. Trend Identification: By analyzing price movements

Here is another version of famous Super Trend indicators which is modified by Kivanc Ozbilgic. I have get the code from Trading View and converted it to MT4 language. this is great opportunity for Trading View users who want to migrate to MT4 so can test this indicator and also make their custom EAs based on it. there are much more inputs than standard super trend also there are up/down arrows with alarms as well.

The QQE indicator is a momentum-based indicator used to identify trends and sideways. The Qualitative Quantitative Estimate (QQE) indicator works like a smoothed version of the popular Relative Strength Index (RSI) indicator. QQE extends the RSI by adding two volatility-based trailing stops. This indicator is converted from Trading View QQE MOD by Mihkel00 to be used in MT4 Version.

The SuperTrend indicator is a popular technical analysis tool used by traders and investors to identify trends in the price of a financial instrument, such as a stock, currency pair, or commodity. It is primarily used in chart analysis to help traders make decisions about entering or exiting positions in the market. this version of super trend indicator is exactly converted from trading view to be used in MT4

" Valiant Strong Trend " - Your Ultimate MT4 Signal Indicator Are you ready to elevate your trading game to new heights? Look no further than the "Valiant Strong Trend" MT4 signal indicator, your indispensable tool for navigating the complex world of financial markets. Key Features: Precise Trend Identification : "Valiant Strong Trend" employs advanced algorithms to accurately identify market trends, whether they are bullish or bearish. Say goodbye to guesswork and hello to informed trading deci
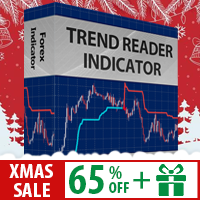
CHRISTMAS SALE — LIMITED TIME!
Get Trend Reader Indicator with a huge –65% discount AND receive Trend Matrix EA as a FREE BONUS ! Special Christmas Price: $107
(Regular Price: $297 — You Save $190!) FREE BONUS: Trend Matrix EA
A powerful multi-symbol strategy packed with advanced features, supporting 10 trading pairs — real value: $447! After completing your purchase, simply contact me and I will send you your BONUS EA immediately. Don’t miss this once-a-year opportunity! Trend Reader Indica

Roger MedcalfによるPTS Divergence Finder Sell Indicator - Precision Trading Systems。 このインジケーターは売りの指示のみを提供します。 まず第一に、なぜ私が多くの年にわたり購買シグナルのダイバージェンスファインダーを提供する一方で、売買ダイバージェンスのインジケーターを提供しなかったのか、何度も質問されました。 私は売買ダイバージェンスが買いダイバージェンスよりも信頼性が低いという答えをしましたが、それは今も真実です。 この問題を解決するいくつかの方法が見つかりましたが、これはピアプレッシャーに屈せず、または私が15年以上前に作成したこのインジケーターの修正によるものではなく、デフォルト設定をより厳格に変更することで実現しました。 PTS Divergence Finder Sell Indicatorはどのように動作しますか? PTS Divergence Finder Sell Indicatorは、トレードボリュームに基づくDemand Indexで発生したダイバージェンスの数を正確に測定します。MT4

Are you in search of a reliable tool to enhance your trading experience on MetaTrader 4? Look no further! "Great Safe Signal" is here to elevate your trading strategy and provide you with invaluable insights for making informed decisions. Key Features: Precision Analysis: "Great Safe Signal" employs advanced algorithms to analyze market trends and price movements with pinpoint accuracy. This ensures that you have the most precise information at your fingertips. User-Friendly Interface: We unders

PTS - Precision Trading Systemsによるダイバージェンスバイファインダー
Precision Divergence Finderは、市場の底を非常に正確に見つけることを目的としており、頻繁に成功しています。
テクニカル分析において、底を選ぶ技術は通常、トップを選ぶよりもはるかに簡単です。このアイテムは、まさにこのタスクのために設計されました。ブルシューダイバージェンスが識別された後、買い物をする前にトレンドが上向きに転換するのを待つのが賢明です。10本または20本のバーの高値を入力するか、移動平均15-30を上昇中に使用してトレンドの変化を特定できます。
この複雑なアルゴリズムは、リアルタイムのバーバーベースでアクティブなデマンドインデックスのダイバージェンスの数を検出し、カウントします。
モデルは、市場価格が新しい安値を付けており、デマンドインデックスが新しい安値を付けていないときに、ダイバージェンスが発生していると観察します。
このインジケーターは、2つの設定を使用します。
1. デマンドインデックス(DI)の長さは、インジケーターに探すも

Precision Trading SystemsによるPTS Demand Indexコード
Demand IndexはJames Sibbetによる創造物であり、複雑なコードを使用して、ボリュームと価格の組み合わせの解釈を簡単にします。
ボリュームの理解は決して簡単な作業ではありませんが、この美しいプログラミングの一部は、それをはるかに簡単にします。
このインジケータがトレーダーや投資家にどのように利益をもたらすか、いくつかの方法があります。
ダイバージェンス(先行指標として) 私は多くの技術指標を数年間研究してきましたが、Demand Indexは意義深いダイバージェンスを見つけるためのキングの1つだという意見を持っています。
市場価格が新高値を記録し、Demand Indexがそうでない場合、これはベアリッシュダイバージェンスとして知られています。どのように探すかを理解するのに役立つ、極端なダイバージェンスの例を示す私のウェブサイトにはいくつかのドラスティックな写真があります。ダイバージェンスの差が大きいほど、トレンド変更イベントを予測するポインターとしてその重

Super Trend Channels MT4 Indicator Looking for a versatile and powerful channel indicator for your MetaTrader 4 trading platform? Look no further than the "Super Trend Channels" indicator! This advanced tool is designed to help traders identify trend channels accurately, enabling you to make informed trading decisions with confidence. Key Features: Multi-Channel Support: The "Super Trend Channels" indicator supports multiple channels simultaneously. You can visualize various channel types, inclu

Enhance your trading strategies with the " MA Trend Filter " indicator for MetaTrader 4. This powerful tool is designed to help you make more informed trading decisions by effectively filtering market trends using Moving Averages (MA). Key Features: Efficient Trend Filtering: The "MA Trend Filter" uses Moving Averages to filter out noise and highlight significant market trends. It simplifies complex price data, making it easier to identify potential entry and exit points. Customizable Settings:

EZZ Elite Zig Zag is an indicator for the MetaTrader 4 terminal. This indicator traces the peak of the trend based on the market reversal, thus showing various opportunities in the financial market. EZZ Elite Zig Zag is a visual tool, intuitive, and easy to understand and use.
Test it Yourself by Downloading it for Free.
Author Paulo Rocha all rights reserved

Unlock the power of precision in your forex trading with the Precise Magic Arrow signal indicator. This versatile indicator is designed to provide you with weekly average signals for all major currency pairs, revolutionizing your trading strategy and enhancing your decision-making process. Key Features: Universal Applicability: "Precise Magic Arrow" is compatible with all currency pairs, ensuring that you have access to valuable signals across the forex market. Weekly Averages: Receive weekly

Scalper Terminal インターフェイス ソフトウェアはインジケーターであり、自動売買取引には関与しません。 このインジケーターは、スキャルピング取引機会が発生したときに取引を開始できる現在の取引ゾーンを示します。 スキャルピング シグナルがある場合、関連する取引ペアの右側にターコイズ色のライトが点灯し、その上に正確な取引方向が表示されます。 その後、「ターコイズ」ボタンをクリックしてトランザクションを入力します。 新しいタブが開きます。 その後、ローソク足の終値が予想され、これがスキャルピング取引に参加するための条件となります。
Scalper Terminal でスキャルピング取引取引を成功させるため;
説明セクションにあるビデオを必ずご覧ください。 兵士のように Scalper Terminal ソフトウェアに固執します。 各取引ペアの右側には、5M、15M、および DIRECTION 列があります。 まず、「通知」ボタンをクリックして緑色にします。 常に画面を見続ける必要はありません。 ターコイズ色の光信号またはメタトレーダー警告メッセージ音が鳴るのを待ってくだ
Daily Monitoring : The indicator automatically calculates and displays the daily drawdown on your trading chart, allowing you to see how well you're performing on a daily basis. Risk Management : By monitoring daily drawdown, traders can better manage their risk. It helps to keep daily losses within acceptable limits. Real-Time Information : Daily drawdown is updated in real-time, providing accurate and up-to-date information about your trading performance. How to Use: Activate the "Daily Drawd

Unlock the full potential of your trading strategy with the Large Strong Signal MT4 Signal Indicator. Designed with precision and reliability in mind, this powerful tool empowers traders with invaluable insights to make informed trading decisions. Here's why "Large Strong Signal" stands out in the crowded landscape of trading indicators: Enhanced Market Awareness : Gain a deeper understanding of market dynamics through our meticulously crafted indicator. It offers a comprehensive view of price
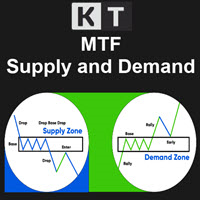
KT Supply and Demand インジケーターは、重要な需要と供給のゾーンを特定し表示します。スイングポイントを分析し、マルチタイムフレーム分析と組み合わせることで、本当に重要なゾーンだけを強調します。 この高度な手法により、最近の値動きで形成された顕著な需要と供給の不均衡から生じる価格反転の可能性が高い領域を際立たせます。
機能
精密分析: 改良されたアルゴリズムが最も重要な需要・供給ゾーンを正確に特定し、大きな値動きの兆候を示します。 包括的な市場把握: 最大三つのタイムフレームからゾーンを表示し、マルチタイムフレーム視点で市場全体を可視化。 すっきりした表示: ゾーンの重なりを避け、チャートを見やすく保ちます。 統合チャートテンプレート: プリセットのテンプレートが付属し、インジケーターの視認性を向上。 予測力: 各ゾーン内に独自のマークが入り、価格反転の手がかりを提供。 適応カラー: 相場の動きに合わせ、ゾーン色を柔軟に変更可能。 カスタマイズ性: ゾーンの濃淡や色、線幅まで好みに合わせて調整できます。 能動的通知: 画面アラート、モバイル通知、メール、サウンド
The "Dagangduit Spread Indicator" is a versatile tool designed to provide traders with essential information about the current spread in the chart window. This indicator offers customizable features, including font parameters, display location on the chart, spread normalization, and alerts to enhance your trading experience. Key Features: Real-time Spread Display : The indicator displays the current spread in real-time on your trading chart, allowing you to stay informed about the cost of execut

タイトル: ノンリペイント XY トレンドインジケーターの紹介: フォレックスとバイナリオプションで成功するための究極のガイド はじめに: ノンリペイント XY トレンドインジケーターは、複雑で常に変化する金融市場において、トレーダーが情報に基づいた意思決定を行うために設計された革新的な取引ツールです。この高度な MetaTrader 4 (MT4) インジケーターは、リペイントという一般的な問題を排除しながら、驚くほどの精度で価格トレンドを予測するそのユニークな能力により、トレーダーの間で大きな人気を集めています。 インジケーターの理解: ノンリペイント XY トレンドインジケーターを際立たせている重要な機能の一つは、その精度へのこだわりです。過去のシグナルをリペイントし、トレーダーに信頼性の低いデータを残してしまう他の多くのインジケーターとは異なり、このインジケーターは一貫性を保っています。トレーダーは、生成されたシグナルが過去の価格変動を正確に反映していることを知って、安心して取引できます。 XY トレンドインジケーターは、高度なアルゴリズムを使用して価格データを分析し、市場のト

Swing trading is a method in which traders attempt to take advantage of market fluctuations. They buy a security when they believe the market will rise and sell if they feel the market will fall, which, as you can imagine, is common in most trading strategies, irrespective of trading style.
The four most frequently occurring patterns in the swing trading domain are reversal, retracement (or pullback), breakouts, and breakdowns.
it work all currency pair, and work all timeframe
100% non repaint

An indicator based on candlestick patterns
To catch short-term and long-term trends
If it gives a signal in the direction of the trend, it is long term
And if it gives a signal in the opposite direction of the trend, it is short term
Too many signals
Can be used in all symbols
Can be used in all time frames
Attributes: Too many signals Can be used in all symbols Can be used in all time frames Simple settings Simple and fast usage With author lifetime support
Settings: Candle back: The number

The Fantastic Price Entry Signal Indicator is a powerful tool designed to assist traders in making informed decisions in the financial markets. This advanced indicator leverages cutting-edge algorithms and technical analysis to identify potential entry points with high accuracy.
Features: 1. Precision Entry Points: The indicator generates precise arrow signals on the chart, highlighting potential entry points for various trading strategies.
2. Trend Identification: By analyzing price mov
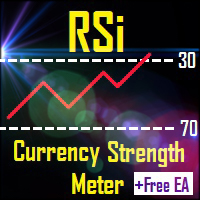
*注記 :
早期購入者向けに 40% 割引! 無料EAのリリースは11月の第2週となります 無料 EA が利用可能になり次第、割引は終了します RSi インジケーターは、特定の商品またはペアが買われすぎまたは売られすぎていることを示す最も人気のあるインジケーターの 1 つです。
通貨強さメーターは、複数の通貨に基づくトレンド指標でもあります。
RSi通貨強さメーターは、RSiと通貨強さメーターのアルゴリズムを備えた1つのチャート指標です。
また、ワンクリック機能もあり、28 のメジャーペアとマイナーペアがダッシュボードに表示され、特定のペアをクリックすると、チャートが選択したチャートに自動的に変更されます。
製品の利点: 取引を管理するための無料のEA。詳細についてはメッセージをください
入力パラメータ RSi 設定 - デフォルトのパラメータは、65/35 レベルの期間 14 です。レベルが高くても低くても、信号は少なくなりますが、より正確になります。 折れ線グラフ、ダッシュボード、市場動向の種類 表示設定 - フォントの通貨の色、信号の色、線の色、および X 軸と

OVERVIEW
A Lorentzian Distance Classifier (LDC) is a Machine Learning classification algorithm capable of categorizing historical data from a multi-dimensional feature space. This indicator demonstrates how Lorentzian Classification can also be used to predict the direction of future price movements when used as the distance metric for a novel implementation of an Approximate Nearest Neighbors (ANN) algorithm. This indicator provide signal as buffer, so very easy for create EA from this indi

トレンドスイフト 誰でも使えるように設計されており、取引の全くの初心者でも使用できます。 決して再塗装しないでください。 表示は近い方から近い方へ表示されます。 単独で使用するように設計されているため、他のインジケーターは必要ありません。
どのように機能するのか TrensSwift は、価格アクションおよびフィボナッチ システムと組み合わせた内部トレンド インジケーターを使用しています。 この戦略は、事後の再計算、平滑化、補間を一切行わずに厳密に適用されます。 コメントセクションの統計により、戦略の「成功」を即座に確認できます リアルタイムでローソク足の終値からローソク足の終値まで、トレンド インジケーターはシグナル条件が有効になるのを待ち、それを矢印 (買いの場合は緑色、売りの場合はオレンジ色) で表示します。 このインジケーターは、取引機会の開始時に SL と TP を表示し、アクション全体を通じてそれらを維持します。 驚くことはありません。
TrendSwift が示す 取引を開始する場所。 いつ閉じるか。 テイクプロフィットとストップロス
トレンドスイフトは機能

The strategy is based on Order-Block concept with MVB(Most Volatile Bar) concept. To determine a good zone of concern to focus for users, the zone are painted in blue and target levels are in thin redline. The mindset behind this indicator was to help users grow naturally while also making money trading. This strategy works so well on XAUUSD, the win rate is over 85%. To Buy! > Trader MUST see a Bullish Engulfing Candlestick pattern (HIGHER High, HIGHER Close Candle), at the Bank Zone (The Blu
"Maxi Super Signal" - Your Ultimate MT4 Signal Indicator! Are you tired of missing out on profitable trading opportunities? Look no further! Introducing "Maxi Super Signal," the must-have MT4 signal indicator that will revolutionize your trading experience. Key Features: Accurate Signals: Maxi Super Signal employs cutting-edge algorithms to provide you with highly accurate buy and sell signals. Say goodbye to guesswork and hello to informed trading decisions. User-Friendly Interface: Our intuiti

This indicator is based on the RSI indicator
Also, some candlestick patterns are used in it to identify better signals
Can be used in all symbols
Can be used in all time frames
Easy to use method
Adequate settings
Settings: period: The number of candles used to calculate signals. alarmShow: If you want to receive an alert in Metatrader after receiving the signal, enable this setting alarmShowNoti: If you want to receive an alert on your mobile after receiving a signal, enable this setting Ala

Let us introduce you to a new era of neural indicators for financial markets! Intelligent Moving is a unique indicator that trains its neural network in real time! You no longer need to look for the optimal indicator parameters for each specific situation. No more late signals. The artificial intelligence is able to adapt itself and predict any market movements.
Visually, the indicator is drawn as a main solid moving average line, two dotted lines of standard deviations and signal arrows. For
SuperOsma Arrowは、買いシグナルと売りシグナルを与えるスーパートレンドOSMAベースのインジケーターです。インジケーターは再描画されず、シグナル統計を表示するダッシュボードが付属しています。
推奨期間:15 歳以上
Buy : バーが開いているときに購入矢印が表示され、tp と sl をチャートに描かれたとおりに設定します
Sell : バーが開いているときに売り矢印が表示され、tp と sl をチャートに描かれたとおりに設定します
===============================
ダッシュボードには履歴信号情報が表示されます。
1.勝率%
2.勝者は何人ですか
3.敗者は何人ですか
4.連続当選者数
5.連敗者は何人か
6.pips単位の利益
============================
パラメーター :
1.スーパートレンド1期
2.スーパートレンド1マルチプライヤー
3.スーパートレンド2期
4.スーパートレンド2マルチプライヤ
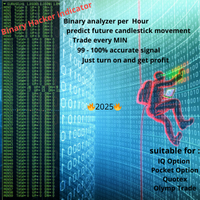
バイナリーハッカーインジケーター 金融市場の高速な世界では、1秒も無駄にできません。すべての意思決定が、取引の成否を分けるのです。そこで登場するのが、バイナリーハッカーインジケーターです。これは、トレーダーに貴重な洞察を提供するために、チャート上の1分ごとに分析を提供する画期的なツールです。 バイナリーハッカーは、手動による広範な分析が必要な従来のインジケーターとは異なり、トレーディングストラテジーから推測作業を取り除き、純粋なデータに基づいた計算されたアプローチを提供します。 取引における精度の向上: バイナリーハッカーインジケーターは、一般的なトレーディングツールではありません。チャート上の各分を分析し、トレーダーに貴重な洞察を提供するリアルタイムアナライザーとして機能します。 バイナリーハッカーを使用すると、売買圧力の微妙なバランスを理解しながら、取引の1分ごとに分析する機能を備えています。この機能により、常に市場の勢いに沿った取引を行うことができます。 1分ごとのパワー: 取引の1分ごとに分析し、売り買い圧力の微妙なバランスを理解する能力を想像してみてください。バイナリーハッカ

If you are good at trading at levels This indicator is all you need levels to manage your trades Market is usually follow current trend when break out some levels or reverse
Trade at the Institutional traders level with the best supply and demand zone indicator available in MT4 and MT5 The Secret Profit Levels Signals indicator for MT4 is a complete trading system that provides traders with the entry price and 2 take profit levels. Technical analysts use support and resistance levels to identi

Nice Price Signal is a powerful and easy-to-use MT4 indicator that provides traders with accurate and reliable entry and exit signals. The indicator uses a variety of technical indicators to analyze the market and identify trends and reversals. Features: Accurate and reliable signals: The indicator uses a variety of technical indicators to analyze the market and identify trends and reversals. This helps to ensure that traders are entering and exiting trades at the right time. Easy to use: Th

True Super Arrows is a powerful and versatile indicator that can help you identify and trade profitable trends. The indicator uses a combination of technical indicators to generate arrows that point to the direction of the trend. Features: Multiple trend identification methods: The indicator uses a combination of moving averages, trend lines, and other indicators to identify trends. Accurate trend direction: The indicator uses a variety of techniques to ensure that the arrows are pointing in

The Pure Cross Entry Signal Indicator is a powerful tool designed to assist traders in making informed decisions in the financial markets. This advanced indicator leverages cutting-edge algorithms and technical analysis to identify potential entry points with high accuracy. The indicator works based on instant price movements. This indicator is a complete trading product. This indicator does not need any additional indicators.
The indicator certainly does not repaint. The point at which th

Trend based indicator
Identify trends with this indicator
A simple-to-use trend indicator
No complicated settings
Attributes: Can be used in all symbols Can be used in all time frames Relatively high signals No complicated settings Specific to the trend Lifetime support
Settings: Alarm Show Alert: By activating these settings, after receiving the signal, you will receive an alarm in Metatrader
Alarm Show Notification: By activating these settings, after receiving the signal, you will receive a

Using signals generated by a single indicator can be risky while trading. This is because using just one indicator to trade can give more false signals. Thus, many forex traders used three or more indicators to filter out good trade setups. However, using multiple indicators for signals can also be complicating and confusing. This is especially true when these indicators are generating contradictory signals. The Super Arrow indicator, however, provides good signals by using multiple indicators.

Готовый Инструмент для Трейдера с большим арсеналом технического аспекта, который будет помощником в торговле! Индикатор имеет буферные стрелки, алерт, возможность настройки нужных уровней сигнала, возможность торговать на пробой и ретест! работать можно на любом инструменте, и любом таймфрейме. Можно регулировать цвета линий что бы было приятно использовать этот инструмент в своём торговом шаблоне!

With the help of this Practica Trend forex indicator algorithm, you can quickly understand what kind of trend is currently developing in the market. The Practical Trend indicator accompanies long trends, can be used without restrictions on instruments or timeframes. With this indicator, you can try to predict future values. But the main use of the indicator is to generate buy and sell signals.
The Practical Trend indicator is used in the forex markets. One of the main definitions for monitorin
MetaTraderマーケットは、他に類のない自動売買ロボットやテクニカル指標の販売場所です。
MQL5.community ユーザーメモを読んで、取引シグナルのコピー、フリーランサーによるカスタムアプリの開発、支払いシステムを経由した自動支払い、MQL5Cloud Networkなど、当社がトレーダーに対して提供するユニークなサービスについて詳しくご覧ください。
取引の機会を逃しています。
- 無料取引アプリ
- 8千を超えるシグナルをコピー
- 金融ニュースで金融マーケットを探索
新規登録
ログイン