YouTubeにあるマーケットチュートリアルビデオをご覧ください
ロボットや指標を購入する
仮想ホスティングで
EAを実行
EAを実行
ロボットや指標を購入前にテストする
マーケットで収入を得る
販売のためにプロダクトをプレゼンテーションする方法
MetaTrader 4のためのテクニカル指標 - 145

Belladonna is an advanced custom technical indicator for MetaTrader 4 based on Hull Moving Average (HMA). It visualizes the trend direction using colored lines and arrows on the chart. The indicator is optimized to minimize lag and eliminate market noise, making it especially useful for short-term and medium-term trading.
Functions and Features: Moving Average Type: Hull Moving Average (based on two EMA/SMA lines).
Calculation Methods: Support for different types of moving average (SMA, EMA,

The Hodrick-Prescott filter is a well known filtering algorithm Perfect for offline jobs it lacks realtime capabilities that are necessary in trading This is a first time a causal Hodrick-Prescott filter has been made
I was able to successfully make a causal (realtime) version of the Hodrick-Prescott algorithm which keeps the lag to a minimum as you can see on the screenshots, it is really responsive to sharp changes while retaining a high smoothing ability, making it one of the best smoothers
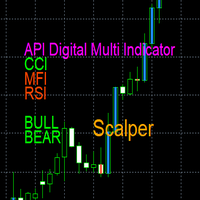
API Digital Multi Indicator Scalper – Clear Digital Display API Digital Multi Indicator Scalper , a tool that integrates RSI, MFI, CCI, Bulls and Bears into a digital display for market analysis . This indicator is designed for scalpers and short-term traders who demand clear data . Key Features: Digital Display – Monitor RSI, MFI, CCI, Bulls and Bears values in an easy-to-read digital format.
Color Changes – Visual cues help identify possible trend changes at a glance.
Adjustable

Trend NonLag Indicator is a professional and easy to use Forex, Crypto and CFDs trading system which is based on the best principles of trading using the Swing High and Swing Low and Price Action strategy. The indicator provides accurate BUY and SELL signals. You can trade even on the go using PUSH notifications. Probably you already heard about the Swing High and Swing Low trading methods before. Usually the Swing High/Low is a very complex thing not only for newbie traders but also for th

ORDER BLOCKS REVERSAL
Reversal Trading involves identifying points where an asset's price direction changes, capitalizing on potential profits from such shifts. Spotting reversals requires analyzing price patterns and volume indicators.
Key indicators include moving averages, RSI, and MACD, which help traders predict potential trend shifts. This indicator show us potential reversal points using ORDER BLOCKS.
While Reversal Trading offers potentially high reward opportunities by entering earl

Indicador de Fibonacci Semanal para MT4 Maximize suas operações no mercado financeiro com o Indicador de Fibonacci Semanal para MetaTrader 4 (MT4) , a ferramenta essencial para traders que buscam identificar pontos estratégicos de suporte e resistência com base na ação do preço da última semana. Principais Recursos: Atualização Automática : O indicador recalcula os níveis de Fibonacci automaticamente a cada novo candle semanal. Níveis Personalizados : Traça apenas os níveis essenciais de Fibonac
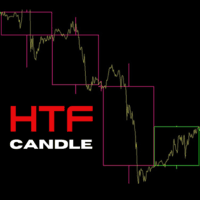
ICT Traders! Here's another cool Indicator that will allow to trade the HTF narrative while focus on price action on your entry timeframes. The following are the input for setup the indicator: Maximum Bar: The number of HTF bar you want to display Bullish Candle: The color of the bullish candle Bearish Candle: The color of the bearish candle Border Width: the width of the HTF candle drawn on the chart.

SuperTrend Starter - Yes Trading (over 100 Downloads in 10 days)
The SuperTrend Starter - Yes Trading indicator is a powerful, user-friendly tool designed to simplify market trend detection and provide clear trading signals. By combining the Commodity Channel Index (CCI) with a Moving Average (MA) filter, this indicator helps traders make informed decisions with precision and confidence. Key Features & Benefits Trend Detection: Easily identifies uptrends (price above the SuperTrend) and dow
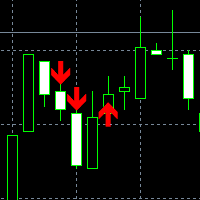
This is Binary option indicator mt4 for one candle expiry, also can be used for forex Higher Timeframes like H4,D1,W1, it is very accurate no lags no repaints, before you purchase you can ask me any question you may recon with feel free to contact me, Indicator Buffers are 0 for buy and 1 for sell, it Draws arows immidiate;
Alerts has been included; Push Notification has been included;
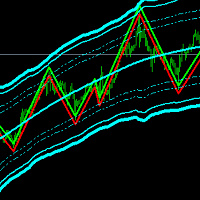
Channel Trend Bands – A Comprehensive Indicator for Market Analysis MetaTrader 5 Version
Simple to Use, Effective in Application User-Friendly and Suitable for All Traders This indicator stands out due to its straightforward functionality. Whether you're a beginner exploring the market or an experienced trader refining your strategy, this tool offers valuable insights. Using a Triangular Moving Average (TMA) with additional ATR-based bands , it provides structured market data to support well-i
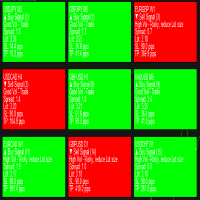
Introducing Telos Dashboard Indicator – Your Ultimate Trading Companion Optimized For Forex!
Note: This is a dashboard indicator and won't work on the strategy tester, demoing it there is a waste. Instead get the main indicator or, use the demo of DynamicCOG to see how it works with arrows, although Telos is a more refined and filtered version than the DynamicCOG indicator. Never Miss a Trading Opportunity Again!
Welcome to the future of trading with the Telos Dashboard Indicator ! Inspired b

「Auto FIBO Pro」Crypto_Forex インジケーターは、取引の補助ツールとして最適です。
- インジケーターは、フィボナッチ レベルとローカル トレンド ライン (赤色) を自動的に計算してチャート上に配置します。 - フィボナッチ レベルは、価格が反転する可能性のある重要な領域を示します。 - 最も重要なレベルは、23.6%、38.2%、50%、61.8% です。 - リバーサル スキャルピングやゾーン グリッド取引に使用できます。 - Auto FIBO Pro インジケーターを使用して、現在のシステムを改善する機会も多数あります。 - Info Spread Swap Display があり、接続されている外国為替ペアの現在のスプレッドとスワップを表示します。 - ディスプレイには、アカウントの残高、エクイティ、マージンも表示されます。 - Info Spread Swap Display は、チャートのどのコーナーにも配置できます。 0 - 左上コーナー、1 - 右上、2 - 左下、3 - 右下。
高品質のトレーディングロボットとインジケーターをご覧にな

MamchenkoTrend Complex - высокоточный индикатор, показывающий смену тенденций на рынке. Индикатор не перерисовывает сигнал после закрытия свечи. Дает вам уровень стопа для вашей сделки по его сигналам. Отлично подходит для ручной торговли и в разработке в АТС (автоматические торговые системы) Настройки можно использовать по умолчанию , а также подбирать самостоятельно . На скриншотах изображен один и тот же участок графика пары GBPUSD на тайме Н4 но с разными настройками . На первом рисунке зн

Quantum Entry is a powerful price action trading system built on one of the most popular and widely known strategies among traders: the Breakout Strategy! This indicator produces crystal clear buy and sell signals based on breakouts of key support and resistance zones. Unlike typical breakout indicators, it uses advanced calculations to accurately confirm the breakout! When a breakout occurs, you receive instant alerts. No lag and no repaint : All signals are delivered in real-time, with no lag

Overview: The Candle Pattern Weekly RSI is a powerful MT4 indicator designed to detect high-probability trade setups on the 1h -timeframe chart while aligning with the weekly trend . It filters signals using a unique three-candle pattern and other Pri ce actions , a minimum price move from the weekly open , and RSI confirmation to enhance accuracy and reduce false signals. Key Features: Weekly Trend Confirmation: Only takes buy trades when the Weekly candle is bullish and sell trades when i

ガン理論に基づいた修正ゾーンの手動構築用インジケーター。ゾーンは、M1 から始まり D1 で終わるさまざまな時間枠の特別な係数を使用した数学的計算によって決定されます。このインジケーターは通貨ペアや金属だけでなく、暗号通貨や株式でも機能します。
このインジケーターを使用すると、市場サイクルに基づいて購入/販売のサポートゾーンを簡単に構築し、これらのゾーンに近づいたときに取引の決定を下すことができます。
これにより、買い/売りサポートゾーンからの価格変動の方向を理解できるようになります。
また、このインジケーターの助けを借りて、上昇/下降サイクルのブレークを決定し、エントリ ポイントを決定することができます。
スキャルピング、短期および中期取引に適しています。それはすべてあなたの取引スタイルに依存します。
とても使いやすいです。ゾーンの構築には 4 つのキーのみが使用されます。
ゾーンは、チャート上で目立つ高値/安値から手動で構築されます。
購入のサポート ゾーンを構築するには、明確に定義された高値にマウス カーソルを置き、「2」キーを押す必要があります。チャートにインジ

VWAP (Value Weighted Average Price) is an indicator of market makers and banks. It is used by professional traders for intraday, weekly and long-term trading. If you are not familiar with it yet, it is high time to figure it out. How does VWAP work? VWAP shows the volume-weighted average price over a certain period. Its calculation takes into account both the price change and the volume of transactions in each candle. Candles with a higher volume have a greater impact, which increases the ac
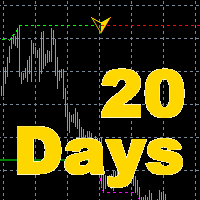
The indicator is the main part of Michael Huddleston's ICT (Inner Circle Trader) trading strategy. His legendary trading strategy is based on the concept of "Smart Money". To analyze the medium -term trend , the ICT offers an analysis based on twenty -day levels . The indicator builds levels , while showing the turning points with arrows . An important feature of the indicator is the automatic display of levels for different periods . You do not have to change the indicator settings when chang

Smart Key Levels Indicator for MT4 - Advanced Support & Resistance Tool The Smart Key Levels Indicator is a professional-grade tool for traders seeking precise support and resistance levels. Using advanced algorithms, it identifies key price levels with dynamic strength scoring, volume filtering, and higher timeframe confluence. Perfect for all trading styles and timeframes, this indicator provides clear visual signals with customizable settings. Available for both MT4 and MT5 platforms. Unl

This is a mini One pair version of Advanced Detector of Trend Reversal and Continuance known as TrueTrendStarM(TTSm25). It is a sensitive and Predictive indicator of Price Trends for Professional traders. ( ATTENTION BUYERS:-Now the indicator is available for UNLIMITED TIME ONE TIME buy of just $500 ). Avail the Opportunity. It detects high odds changes in Price Trend direction long before other indicator detects it. I have been working on it since 2019. This is possible due to fractal

Smart Set up leve l is a very powerful indicator based on the concept of order blocks and set up entries with proper fvg and breakouts to make a very nice level to enter like a pro trader. Very easy to use interface and friendly to enter on buy and sell signals. Works Best on M15 Time frame on Gold, Bitcoin and Fx pairs. Daily 4-5 trades on each pair Works great on gold like a pro on M15 It is non repainting nor lagging It is very powerful indicator giving precise entries and prop acts can be c

「Binary Smart Eye」MT4インジケーターは、バイナリーオプションと外国為替市場の両方で取引シグナルを提供するために設計されており、M1からW1までの広範囲な時間枠で動作します。トレンドレベル、インテリジェントな移動平均、最適化された取引期間を組み合わせた独自の戦略を採用し、潜在的なエントリーポイントを特定します。 主な機能の内訳は以下のとおりです。 マルチタイムフレーム分析: インジケーターの多様性により、トレーダーはさまざまな時間枠で利用でき、M1でのスキャルピングからW1での長期トレンドフォローまで、さまざまな取引スタイルに対応します。 独自の戦略: 「Binary Smart Eye」の核となるのは、以下を利用する独自の戦略です。 トレンドレベル: これらのレベルは、優勢な市場トレンドと潜在的な反転ポイントを特定するのに役立ちます。 インテリジェントな移動平均: 市場のボラティリティに適応し、正確なトレンド方向を提供するカスタマイズされた移動平均です。 スマート取引期間: インジケーターは、特定の時間期間に基づいてシグナル生成を最適化し、最適な市場状況を捉えること

Secret Liquidity Zones Indicator User Manual Introduction Unlock the power of hidden market opportunities with the Secret Liquidity Zones Indicator . This cutting‐edge tool is designed to reveal critical price levels where market momentum may shift. With its dynamic adaptability and sleek gold visuals, it offers clear and elegant insights into key trading opportunities—making it the perfect secret weapon for traders who demand precision and clarity. Key Features Dynamic Timeframe Adaptation:
A
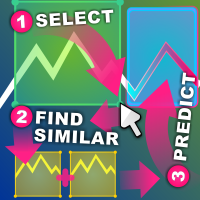
類似価格アクション インジケーター 類似価格アクションは、選択したチャートの領域に可能な限り類似するローソク足パターンの過去のシーケンスを検索します。
インジケーターは、選択した価格アクション領域の最初のローソク足の直前から、チャートの一番古い最初のバーまで検索を実行します。
2 つのシーケンス間の類似性を評価するための基準がいくつかあります: シーケンスの長さは同じである必要があります。選択した領域が 20 本のローソク足の幅である場合、一致する結果も 20 本のローソク足の幅である必要があります。ローソク足は好きなだけ選択できます。 シーケンスは、高値から安値までのサイズで視覚的に比較されます シーケンスは、始値から終値までのサイズと方向で視覚的に比較されます。ローソク足バーが一方のシーケンスでは強気で、もう一方のシーケンスでは弱気である場合、スコアは 0.0 に設定されます。 シーケンスには、デルタで比較される高速移動平均と低速移動平均のセットがあります。デルタは、その領域内で相対的に比較することも、資産全体で絶対的に比較することもできます (相対モードと絶対モード)。 シ
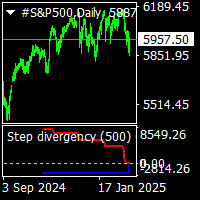
step divergency indicator is a buy sell divergency indicator.include sinus wave indicator. it work all timeframes and all pairs. red line gives step divergency sell formations. blue line gives step divergency buy formations. suitable for experienced and beginners. when prices is moving up and red lines step down ..this is sell divergecy formation and if prices moving down but blue line moving step up this is buy divergency formation. increased cnt value show more back side. gold line is sinus w

トレンドに従うは、RSI アルゴリズムに従ってローソク足に色を付け、推奨される FVG エントリー ポイントと推奨されるストップロスを提供する視覚的なインジケーターです。 再描画なし!
最初に形成された新しい公正価値ギャップに確認矢印が表示されます!
最適な使用方法:
5 分以上の時間枠!
トレンド パネル:
FVG: 最後の公正価値ギャップ。
スパン: 一目均衡表の雲の上、下、または内部。
RSI: RSI アルゴリズム セクション チャート上のパネルを簡単につかんで移動できます! パネルを見ることで、ペアのトレンドから簡単に抜け出すことができます!
戦略:
1. ロング トレードの可能性:
新しい緑の矢印が表示されたら、ストップロスを公正価値ギャップの下に設定します!
TP で、または新しい弱気の公正価値ギャップが形成されたら、トレードを終了します。
2. ショート トレードの可能性:
新しい赤の矢印が表示されたら、ストップロスを公正価値ギャップの上に設定します! TP または新しい強気の公正価値ギャップが形成された場合、取引を終了します。 アラート:

同期クロスヘア & 極値ライン インジケーター シンプルな説明(すべてのトレーダー向け) このインジケーターは、 同じ銘柄の複数のチャートでクロスヘアを同期 し、異なる時間軸の価格動向を同時に追跡できる便利なツールです。 主な機能: 同期クロスヘア: 1つのチャートでクロスヘアを動かすと、 他の同じ銘柄のチャートでも自動的に更新 されます。
ショートカットキーで簡単操作: "F" – クロスヘアの表示/非表示を切り替え。 "R" – 最高値/最安値に極値ラインを追加・削除。 "T" – 選択したバーに垂直ラインを追加・削除。
完全カスタマイズ可能: カラー、ラインスタイル、幅などを自由に調整可能。 このツールは、 手動でチャートを調整する手間を省き、マルチタイムフレーム分析をスムーズに行うのに最適 です。 詳細な説明(経験豊富なトレーダー & プログラマー向け) 同期クロスヘア & 極値ライン インジケーター は、 複数のチャートを同期する高度なツール で、テクニカル分析の精度を向上させます。
このインジケーターを使うことで、異なる時間軸のチャートにおいて

• Please test the product in the Strategy Tester before purchasing to understand how it works.
• If you face any issues, contact me via private message—I’m always available to help.
• After purchase, send me a screenshot of your order to receive a FREE EA as a gift.
Aroon Cross Signal Indicator - Trading Companion V1.21 Important Note: This indicator is provided as a raw trading tool designed for traders who enjoy customization and optimization. It is NOT a plug-and-play solution and requi

No Repaint Bext は完全な取引システムです。エントリーとエグジットのタイミング、そして取引の方向を示します。 緑の矢印 が表示されるたびに、 買い注文 を開きます。 赤い矢印 が表示されたら、すべての買い注文を閉じます。
同様に、 赤い矢印 が表示されたら、 売り注文 を開き、 緑の矢印 が表示されたらすべての売り注文を閉じます。
取引には M5(1分足) を使用し、 どの通貨ペアでも取引可能 です。 このインジケーターは 再描画されず 、ほとんど遅延しません。ただし、 ローソク足が確定するまで待つ という自然な条件はあります。 RSI フィルター と**2 つのクラシックな反転パターン(エンゴルフィング、ピンバー)**を使用し、反転の瞬間をほぼリアルタイムで捉えます。 インジケーターの効果的な使い方 どの通貨ペアでも使用可能 (テスト済み: GBPUSD, EURUSD ) 時間足:M5(1分足) 初期資金:500ドル以上 取引ロット:0.01 緑の矢印 が表示されたら、買い注文を開く。 赤い矢印 が表示されたら、すべての買い注文を閉じる。 赤い矢印 が表示されたら、売
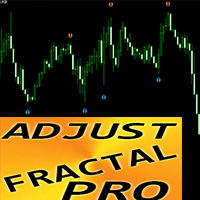
「Adjustable Fractals Pro」はフラクタルインジケーターの高度なバージョンで、非常に便利なトレーディングツールです。
- ご存知のとおり、標準フラクタル MT4 インジケーターには設定がまったくありません。これはトレーダーにとって非常に不便です。 - Adjustable Fractals Pro はその問題を解決しました。必要な設定がすべて揃っています: - インジケーターの調整可能な期間 (推奨値 - 7 以上)。 - 価格の高値/安値からの距離を調整可能。 - フラクタル矢印のデザインを調整可能。 - Info Spread Swap Display があり、接続された外国為替ペアの現在のスプレッドとスワップを表示します。 - ディスプレイには、口座残高、エクイティ、マージンも表示されます。 - Info Spread Swap Display はチャートのどのコーナーにも配置できます: 0 - 左上コーナー、1 - 右上、2 - 左下、3 - 右下。 - インジケーターにはモバイルおよび PC アラートが組み込まれています。 高品質のトレーディングロボッ

A powerful indicator for precise market analysis, according to the Smart Money Concepts methodology. Determines key liquidity levels, supply and demand zones. Unusual coloring of candles, as well as levels. Smartmoney has repeatedly won first places in various competitions. Multi-timeframe is suitable for both forex pairs and metals and cryptocurrency.
The "Volume POC WVAP" Indicator is a revolutionary tool for traders seeking in-depth analysis across various financial markets. This unique indicator, based on tick volumes in the MT4 terminal, provides indispensable information for making informed trading decisions in the following markets: Forex, binary options, cryptocurrency, spot, futures, and indices. Key Features: WVAP Line: Weighted Volume Average Price: The WVAP calculates the weighted volume average price on the selected timeframe, all

Multi-Timeframe Support & Resistance Indicator for MT4.
Professional Tool for Technical Traders.
Key Advantages Multi-Timeframe Analysis - View critical levels from different timeframes simultaneously Real-Time Alerts - Instant notifications when key levels change Customizable Display - Adjust colors, line styles, and timeframes to match your strategy User-Friendly - Easy setup with clear visual labels for all levels
Core Features Multi-Chart Integration : Track S/R from up to 4 t
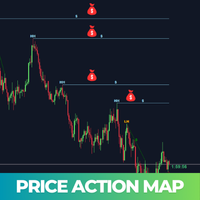
Price Action Map is an advanced trading indicator meticulously designed to provide clear visual insights into market structure by precisely labeling Higher Highs (HH) , Higher Lows (HL) , Lower Highs (LH) , and Lower Lows (LL) . Traders who find it challenging to accurately identify higher highs, lower lows, or understand different market phases will find this tool exceptionally valuable. Price Action Map significantly simplifies the analysis process, enabling traders at all skill levels to con

Last High and Low Indicator
Features
Dynamic High/Low Lines : Automatically plots horizontal lines showing the highest high and lowest low over a selected number of past bars. Customizable Lookback Period : Adjust how many bars the indicator analyzes to find highs/lows. Visual Customization : Choose line colors (red for high, blue for low). Adjust line style (dashed, solid, etc.) and thickness. Price Labels : Displays the exact price and bar count for clarity (e.g., "High (10 bars): 1.1200").
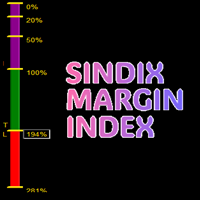
this indicator will help you see the following :
first , price levels that shows : 1. breakeven level for all open positions ( BEA shown in blue line ) 2. breakeven level for all open buy positions ( BEB shown in green line ) 3. breakeven level for all open sell positions ( BES shown in red line ) 4. draw a line at Margin level 100% ( violet color line ) 5. draw a line at Margin call level ( violet color line ) 6. draw a line at StopOut ( violet color line )
second , to the left : 1. it will s

General Information This indicator for MetaTrader 4 is a tool designed to generate buy and sell signals based on a combination of a stochastic oscillator and a moving average. Signals are displayed on the chart as arrows: green for buy signals and red for sell signals. It is built to provide a higher number of trading opportunities while considering market conditions.
How It Works The indicator processes market data using two components: the stochastic oscillator assesses the current market st
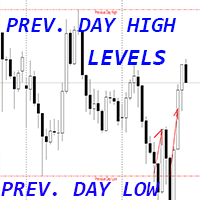
Crypto_Forex MT4 用インジケーター「前日の高値と安値」
- インジケーター「前日の高値と安値」は非常に便利な補助インジケーターです。 - 昨日の高値と安値は非常に重要です。価格がそこから頻繁に反発するからです。 - これらのレベルは信頼できるサポートとレジスタンスと見なすことができます。価格はこれらを非常に重視します。 - リバーサル取引方法とスキャルピングを使用する日中トレーダーにとって便利なインジケーターです。 - プライスアクションと組み合わせるのも非常に便利です。 - モバイルおよび PC アラートが組み込まれています。 高品質のトレーディングロボットとインジケーターをご覧になるにはここをクリックしてください! これは、この MQL5 ウェブサイトでのみ提供されるオリジナル製品です。

This indicator utilizes advanced market analysis algorithms, combining adaptive volatility , moving averages , and trend analysis to identify potential price reversal points. The algorithm is based on ATR, EMA, and ADX , allowing it to dynamically adjust to current market conditions and filter out false signals.
The indicator is suitable for various trading strategies, including scalping, intraday trading, and long-term trend strategies . With flexible settings, it can be adapted to any market
Unlock Institutional Trading Insights with Our Advanced Supply & Demand Zone Indicator Harness the power of institutional trading strategies with our cutting-edge Supply & Demand Zone Indicator —a game-changing tool designed to pinpoint high-probability entry and exit points in any financial market. By identifying where institutional buyers and sellers are positioned, this indicator gives you the edge to trade alongside the pros and capitalize on major market reversals. Why This Indicator Is

这是一个双均线指标,使用历史数据,通过较为严格且大众化的计算公式,计算得出主要均线的数值,然后再将其均线化,从而最大可能的避免了在走势不确定的情况下,均线发出错误的交易信号。最重要的是,可以结合您自己的交易专家,实现最大化的交易利润。 手工交易参与者也可以使用本指标,结合MACD 等其他指标也可获得比较高的准确率
建议使用默认参数。本指标适合各种周期,交易品种适合黄金、比特币等波动较大的交易品种。目前我并未设置可以改变交易指标的颜色、线的大小的选项,我认为此这些都是不重要的,重要的指标的准确率以及帮助交易者能够更改好的获取利润。如果有认为需要改变颜色或者线大小的选项?可以私信我,我单独为您定制你需要的设置。

"Smart Panel" is a powerful tool for traders and analysts that combines convenience, speed, and functionality. The program allows you to instantly add popular indicators such as Moving Average and Bollinger Bands to your chart, as well as provides access to open order data and market information with just one click. Key Features: Instant Indicator Addition :
Click a single button to add Moving Average or Bollinger Bands to your chart. No more manual parameter setup—the program does it

Smart Market Structure Simple is a powerful indicator that helps traders identify market structure based on the Smart Money Concept (SMC) . This indicator automatically detects Break of Structure (BOS), Change of Character (CHoCH), Fair Value Gaps (FVG), Order Blocks (OB), Liquidity Zones (LQZ), and key swing points Higher High (HH), Higher Low (HL), Lower High (LH), Lower Low (LL) . Main Objective: Assist traders in tracking institutional flow ( Smart Money ) and finding high-p
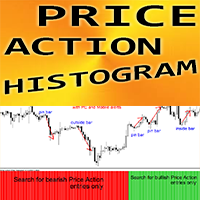
Crypto_Forex インジケーター「プライス アクション フィルター ヒストグラム」は、プライス アクション トレーディングのための効率的な補助トレーディング ツールです。再描画はありません。
- このインジケーターは、トレーダーにエントリーの方向を示します。トレーダーは、その方向のプライス アクション シグナルを検索するだけです。 - プライス アクション フィルター ヒストグラムは、プライス アクション パターンおよびサポート/レジスタンス レベルと組み合わせる必要があります。 - 緑色のヒストグラム - 買いエントリーを探します。 - 赤色のヒストグラム - 売りエントリーを探します。 - このインジケーターを使用すると、標準戦略をアップグレードする機会が数多くあります。 - インジケーターには、モバイルおよび PC アラートが組み込まれています。
高品質のトレーディングロボットとインジケーターをご覧になるにはここをクリックしてください! これは、この MQL5 Web サイトでのみ提供されるオリジナル製品です。

GO Multi Oscillator Divergence Entry is a unique divergence indicator that is different from all other divergence indicators on the market.
After purchase, leave a review, a comment or make a screenshot of your purchase and contact me to receive for free the Trade Entry Manager utility !
The uniqueness of the indicator consists of two key elements :
unlike other divergence indicators, this indicator does not use an oscillator subwindow, thus you can search for divergence of multiple oscilla

Candle Volume Strength は、買い手と売り手の間で進行中の戦いについての洞察を提供する高度なボリューム分析インジケーターです。リアルタイムのボリューム シフトを計算して視覚化し、トレーダーがブレイクアウト、トレンド、リトレースメント、反転をより正確に確認できるようにします。
主な特徴: ボリュームベースの確認 – このインジケーターはティックボリュームの変化を監視し、買い手と売り手の間で市場力が移行したときに警告を発します。 トレンドとブレイクアウトの検証 – ボリューム分布を分析することで、トレーダーは市場トレンドとブレイクアウト シグナルの強さを確認できます。 反転とリトレースメントの検出 – ボリューム パターンは、価格変動の潜在的な転換点を特定するのに役立ちます。 サポートとレジスタンスの洞察 – 主要レベル付近でのボリュームの増加により、信頼性が向上します。 シンプルで効果的な視覚化 - 買いと売りの強さをヒストグラム バーとして表示し、簡単に解釈できるようにします。 Candle Volume Strength は、トレーダーがボリューム分析を活用し

PUMPING STATION – あなた専用の「オールインワン」戦略
PUMPING STATIONは、あなたのトレードをより楽しく、そして効果的に変えてくれる革新的なFXインジケーターです。ただの補助ツールではなく、強力なアルゴリズムを備えた本格的なトレーディングシステムで、より安定したトレードのスタートをサポートします。 この商品をご購入いただくと、以下の特典を無料でお付けします: 専用セットファイル:自動設定による最大パフォーマンスを実現。 ステップバイステップのビデオマニュアル:PUMPING STATION戦略の使い方を学べます。 Pumping Utility:PUMPING STATION専用の半自動トレードボットで、より快適かつシンプルな運用を可能にします。 ※ご購入後すぐにご連絡ください。追加リソースへのアクセスを提供いたします。 PUMPING STATIONの仕組み: トレンド管理:市場のトレンド方向を即座に判断。トレンドはあなたの最高の味方です。 エントリーサイン:チャート上の矢印で、取引のタイミングと方向を明確に示します。 明確な目標設定:インジケーターが自

Nice Try Super Diddy Trend – 経験豊富なトレーダー向けに設計された革新的なテクニカル分析ツールです。本インジケーターは、流動性フローと市場のモメンタムを計算する高度なアルゴリズムを活用し、トレンドの反転ポイントや継続の可能性を特定します。 独自性と価値 Nice Try Super Diddy Trend は単なるシグナル発生ツールではありません。市場の隠れた構造を分析し、価格変動の振幅と方向性を時間サイクルとともに評価します。 量子的ボラティリティ分析 – 市場の変動強度を測定し、誤ったブレイクアウトをフィルタリングするのに役立ちます。 変化する市場環境への柔軟な適応 – 移動平均と RSI 指標を基にした動的な閾値レベルを使用します。 多様なトレード戦略に最適化 – トレンドフォロー戦略にも、ローカルな高値・安値の特定にも適用可能です。 動作原理 Nice Try Super Diddy Trend は、過去のデータと現在の価格変動を分析し、市場のモメンタムを評価する高度なアルゴリズムを使用します。本インジケーターは、上昇・下降マーカ
このインジケーターは主に手動取引向けに設計されています。直近の価格変動を分析し、独自のアルゴリズムを用いて処理します。 この分析に基づき、インジケーターは最も重要な価格レベルを計算します。これらのレベルは、価格を「買い」、「売り」、「中立」の3つのゾーンに分割します。価格が対応するゾーンにある場合にのみ、新規ポジションを開設してください。価格が中立ゾーンにある場合は、ポジションをクローズするか、損益分岐点に移動することを検討してください。インジケーターは、ポジション開設に関する独自の推奨事項も提供します。これらのポイントは、チャート上にドットで示されます。
インジケーター設定: Indicator period – インジケーター期間 Type – このパラメータで重み付け係数の種類を選択できます。 Sensitivity – インジケーターの感度(有効値の範囲は0~8です) Color of levels と Line style – インジケーターレベルの色とスタイルを選択できます。 Signal settings – インジケーターシグナル設定
インジケ
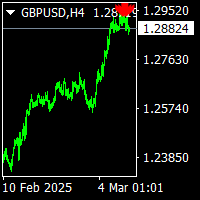
sinus arrows indicator is norepaint arrows indicator. it works all timeframes and all pairs. suitable for experienced traders and beginners. gives red arrows for sell.and gives blue arrows for buy. traders must check the all timeframes.i mean when trading 5m charts also need the check 15m charts and 1m charts. there is cnt number to see the how much bars back bars.
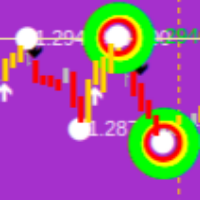
Revolutionize Your Trading with This Powerful Indicator-Based System Are you struggling to find accurate entry and exit points in trading? Do you want a proven, indicator-driven system that helps you maximize profits and minimize risks ? Introducing our Advanced Trading System —a powerful, easy-to-use technical analysis tool designed for forex, stocks, and crypto traders . Key Features & Benefits: Precision Buy & Sell Signals – Our system generates crystal-clear buy (green) and sell (red

3 Trading Strategies to Exploit Market Structure (Without Overcomplicating It)
Trading isn’t about predicting the future—it’s about spotting patterns, managing risk, and acting when odds favor you. Below are two timeless strategies (and one hybrid) that align with how markets actually move, not how we wish they would. Some of the strategies you can trade with the indicator [ Note] Higher timeframe should be 15x of the lower timeframe, for eg. htf 15min, ltf 1min. 1. The Breakout Trap: Trad

API BullBearPower mtf
Designed for traders who rely on BullBearPower, this tool provides a multi-timeframe (MTF) view of BullBearPower, helping you identify possible dominant trends.
Key Features: Multi-Timeframe Analysis – Analyze BullBearPower across different timeframes in real time. Dynamic Color Changes – Identify possible BullBearPower per individual timeframe with color changes. Volume Integration – Get a picture of possible trend strength with BullBearPower volume of each timefra

The Time_Price_SQ9_Degree indicator is based on the 9 Gann square. Using this indicator, you can identify strong time and price zones. The indicator displays the levels as a degree value. The degrees can be set in the settings. After launching, the MENU button appears. If it is highlighted, it can be moved to any point on the graph, and after double-clicking on it, it stops being highlighted and menu buttons appear. To hide the menu, just double-click on the button, it will become highlighted a
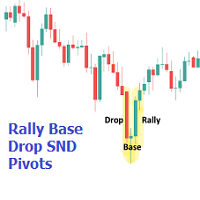
The Rally Base Drop SND Pivots indicator uses "Rally", "Base", and "Drop" Candles to determine pivot points at which supply and demand (SND) levels are drawn. (Figure 1) USAGE Figure 2 Rally, Base, and Drop (RBD) candles create a formula for seeing market structure through a fixed methodology. We are able to use this concept to point out pivot areas where Rallies and Drops directly meet.
The RBD SND Pivots are similar to traditionally identified "fractal" pivot points, with one key differ

Crypto_Forex MT4 用インジケーター「モーニング スター パターン」
- インジケーター「モーニング スター パターン」は、プライス アクション トレーディングに非常に強力なインジケーターです。再描画なし、遅延なし。 - インジケーターは、チャート上で強気のモーニング スター パターンを検出します。チャート上の青い矢印信号 (画像を参照)。 - PC、モバイル、および電子メール アラート付き。 - また、その兄弟である弱気の「イブニング スター パターン」インジケーターも利用できます (以下のリンクに従ってください)。 - インジケーター「モーニング スター パターン」は、サポート/レジスタンス レベルと組み合わせるのに最適です。
高品質のトレーディングロボットとインジケーターをご覧になるにはここをクリックしてください! これは、この MQL5 Web サイトでのみ提供されるオリジナル製品です。
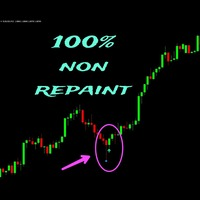
Forexo is an easy-to-use Forex indicator that gives traders clear and accurate signals based on clear trend retests . Forget about lagging indicators or staring at charts for hours because this Forexo indicator provides real-time entries with no lag and no repaint, so you can trade with confidence without analyzing the market. Working of indicator:
This indicator is based on price action with help of stochastic, RSI & SMA.
Setup Recommendation:
Recommended timeframes: Any timeframe works

FOREX FLIP ALERT - Show where the price will reverse with more than 95% probability. This information will help every trader to effectively open trades. The indicator on the chart draws arrows in which place and in which direction the price will reverse. The indicator does not redraw its arrows and shows price reversals for medium and long distances. This means that after the arrow appears, the price will go in the indicated direction for many points.
Benefits of the indicator: Gives sign

The ATR Trailing Stop Pro is a powerful trend-following indicator designed to help traders manage risk and maximize profits. Based on the Average True Range (ATR), this indicator dynamically adjusts stop-loss levels to lock in gains and minimize losses. Key Features : Dual ATR Trailing Stops : Combines fast and slow ATR trails for optimal performance. Dynamic Stop Loss : Automatically adjusts to market volatility. Buy/Sell Signals : Clear visual alerts for entry and exit points. Cust

The LOWESS is a sophisticated trend-following indicator designed to help traders identify, analyze, and act on market trends with precision and minimal lag. Built around the LOWESS (Locally Weighted Scatterplot Smoothing) algorithm, it filters out market noise to reveal the underlying price direction. Enhanced with dynamic visuals, volatility-based bands, momentum insights, and features like alerts and trend strength analysis, this indicator offers a comprehensive toolkit for navigating today’s

This is a true trend lines indicator for MT4/MT5.
This indicator draw real trend lines.
Usually the trend line is drawn as a solid line.
The next trend line that is likely to be valid is drawn as a dotted line.
The most recent invalidated trend line is drawn as a dashed line.
Three-touch lines is drawn as a bright colors.
If the starting point of the trend line is new, the blue line is displayed(call shortline),
if it is old, the gold line is displayed(call longline).
The number of bars border

Microsoft Word - Installation - TrendFollower-1 Trend Follower 1 This indicator consists of three key components: an upper band, a lower band, and a middle line. A buy signal is generated when the price closes above the upper band, indicating strong bullish momentum and a potential trend continuation. Conversely, a sell signal occurs when the price closes below the lower band, signaling bearish strength and a possible downward move. The middle line serves as a dynamic support or resistance leve

Microsoft Word - Installation - TrendFollower-2 Trend Follower 2 This trend-following indicator with upper and lower bands is a powerful tool for identifying market momentum and generating trade signals. This indicator consists of three lines: the upper band, lower band, and middle line. A buy signal is triggered when the price closes above the upper band, indicating strong bullish momentum and a potential continuation of the uptrend. Conversely, a sell signal is generated when the price closes

Parabolic SAR + Deviation [BigBeluga] is an enhanced Parabolic SAR indicator designed to detect trends while incorporating deviation levels and trend change markers for added depth in analyzing price movements. Key Features: > Parabolic SAR with Optimized Settings: Built on the classic Parabolic SAR, this version uses predefined default settings to enhance its ability to detect and confirm trends. Clear trend direction is indicated by smooth trend lines, allowing traders to easily visuali

Trend Risk Analyzer intelligently identifies trends, impulses, and corrections, calculating optimal trade volumes and safe levels for stop-loss and take-profit. Increase your accuracy, reduce risks, and boost your trading profits! This product is also available for MetaTrader 5 => https://www.mql5.com/en/market/product/134799 The key feature of Trend Risk Analyzer is its capability to calculate the average range of each market element, enabling traders to set justified stop-loss and take-profi

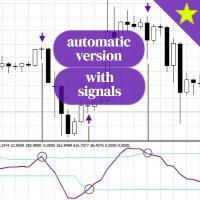
This is an advanced version of my RSI Cyclic indicator. The other version is already a very powerful tool but it requires a manual change of the dominant cycle each time it is used and it is not obvious or easy to do and it does not offer signals. This version uses a Fast Fourier Transform (FFT) to automatically detect the current dominant cycle and uses it as new input for the indicator each tick which dynamically updates the chart. It can be used without the signals simply looking at the color

这段代码是一个用于 MetaTrader 4 (MT4) 平台的MQL4指标脚本,主要功能是在图表上实时显示以下信息: 当前K线的剩余时间 (格式为 X分Y秒 )。 本地时间 (格式为 HH:MM:SS )。 代码的主要组成部分包括: 初始化函数 OnInit : 创建文本对象用于显示时间和剩余时间。 计算并打印本地时间与服务器时间的差异。 初始化定时器,每1秒触发一次 OnTimer 。 反初始化函数 OnDeinit : 删除文本对象。 销毁定时器。 计算函数 OnCalculate : 计算当前K线的剩余时间。 获取本地时间并格式化。 更新文本对象的内容和位置,确保显示信息实时更新。 定时器函数 OnTimer : 每1秒调用一次 OnCalculate ,强制更新时间显示。 辅助函数 FormatRemainingTime : 将剩余时间(秒)格式化为 X分Y秒 的字符串。

Contact me through this email address to download the FREE strategy PDF for this indicator tharindu999lakmal@gmail.com
Download MT5 version here -- >> https://www.mql5.com/en/market/product/119467
Introduction The "VIP Buy Sell Signals MT" is designed to provide BUY and SELL trade signals based on the current market conditions. A Trading Strategy (Chee sheet) has been provided for this trading indicator. (Read the description). This indicator has time tuned e ntry signals . so

Tired of being on the wrong side of the trend? MT4 ROADS puts the power of the Moving Average Channel in your hands. Dynamically plots buy and sell zones using a custom moving average Clearly identifies the current market trend for more confident trading Fully customizable settings to optimize performance for your strategy Visual signal potential trend changes before they happen The MT4 ROADS indicator is your personal market navigator, guiding you through the unpredictable ebb and flow of volat
MetaTraderマーケットはトレーダーのための自動売買ロボットやテクニカル指標を備えており、 ターミナルから直接利用することができます。
MQL5.community支払いシステムはMetaTraderサービス上のトランザクションのためにMQL5.comサイトに登録したすべてのユーザーに利用可能です。WebMoney、PayPal または銀行カードを使っての入金や出金が可能です。
取引の機会を逃しています。
- 無料取引アプリ
- 8千を超えるシグナルをコピー
- 金融ニュースで金融マーケットを探索
新規登録
ログイン