YouTubeにあるマーケットチュートリアルビデオをご覧ください
ロボットや指標を購入する
仮想ホスティングで
EAを実行
EAを実行
ロボットや指標を購入前にテストする
マーケットで収入を得る
販売のためにプロダクトをプレゼンテーションする方法
MetaTrader 4のためのテクニカル指標 - 20
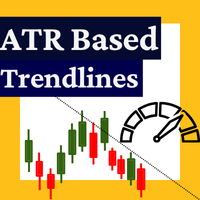
このインジケーターは、TradingViewの「ATR Based Trendlines - JD」by DuyckをMetaTrader 4用に変換したバージョンです。 特徴:
価格だけでなくATRで測定したボラティリティも考慮してトレンドラインを自動的に描画します。トレンドラインの角度はATR(の一定割合)によって決定されます。 ライン角度は、ピボットポイントが検出された時点のATR値に基づいて価格変動に追随します。ATRパーセンテージ設定により、ATR変化率(100%)、その分数(<100%)、または倍数(>100%)を追従します。 入力パラメータ:
・Lookback depth:ピボット検出に使用するローソク足の数
・ATR target percentage:トレンドライン方向へのATR感度
・Draw lines from wicks or real bodies:ピボット計算に実体/ヒゲのどちらを使用するか
・トレンドライン方向(上昇/下降/両方)
・全トレンドライン表示の有無
・表示ライン最大数('Show all trendlines'無効時)
・上昇/下降トレンド
FREE

Automatically detect bullish or bearish order blocks to optimize your trade entries with our powerful indicator. Ideal for traders following ICT (The Inner Circle Trader). Works with any asset type, including cryptocurrencies, stocks, and forex. Displays order blocks on multiple timeframes, from M2 to W1. Alerts you when an order block is detected, migrated, or a higher timeframe order block is created/migrated. Perfect for both scalping and swing trading in Smart Money Concepts. Enhanced by st

This indicator is an original view on volumes. It is known that volumes show the amount of buyers and sellers for a certain period of time. A candle is used a period of time. Volumes at a candle High show the buyers. Volumes at a candle Low show the sellers. A candle Open shows the Delta. Delta indicates who was dominant on a given candle, buyers or sellers.
Input parameters Distance - distance of the volumes text from High and Low. Font size - text font size. The indicator provides levels that
FREE

この指標は、ボラティリティと価格の方向性を同時に評価し、次のイベントを見つけます。 [ インストールガイド | 更新ガイド | トラブルシューティング | よくある質問 | すべての製品 ] 決定的かつ突然の価格変動 大きなハンマー/シューティングスターパターン ほとんどの市場参加者に支えられた強力なブレイクアウト 優柔不断だが不安定な市場状況 それは非常に使いやすいインジケータです... 青いヒストグラムは強気のインパルスを表します 赤いヒストグラムは弱気のインパルスを表します 灰色のヒストグラムは現在のボラティリティを表します 移動平均は平均ボラティリティです このインジケーターは、あらゆる種類のアラートを実装します インジケーターは再描画もバックペイントもしません ...簡単な取引の意味を持ちます。 強気の衝動が平均ボラティリティを超えたときに購入できます 弱気の衝動が平均ボラティリティを超えたときに売ることができます この指標は、市場のボラティリティとすべてのバーの強気と弱気の衝動を追跡します。強気の衝動が平均的なボラティリティを超える場合、おそらくショートのために長く行く良
FREE

ICT Silver Bullet
If you are searching for a reliable indicator to trade the ICT Silver Bullet concept, or ICT concepts, Smart Money Concepts, or SMC, this indicator will respond to your need! This indicator will help you identify the following: FVG - fair value gaps Market structure: BOS and CHOCH. It is based on ZIGZAG as it is the most subjective way to do it. ICT Silver Bullet windows and related notifications when it starts and when an FVG appears Swing High and low that are potential bu

The free version of the Hi Low Last Day MT4 indicator . The Hi Low Levels Last Day MT4 indicator shows the high and low of the last trading day . The ability to change the color of the lines is available . Try the full version of the Hi Low Last Day MT4 indicator , in which additional indicator features are available : Displaying the minimum and maximum of the second last day Displaying the minimum and maximum of the previous week Sound alert when crossing max . and min . levels Selecting an arb
FREE

The BinaryFortune indicator has been developed and adapted specifically for trading short-term binary options. The algorithm of the indicator analyzes numerous factors before generating a signal. The indicator is installed in the conventional way. The indicator consists of an information window, which displays the name of the trading instrument, support and resistance levels, and the signal itself ( BUY , SELL or WAIT ). A signal is accompanied by a sound and a pop-up Alert. Advantages of the in
FREE

What is the Super Ichi Indicator? Super Ichi is an advanced combination of Ichimoku Kinko Hyo and SuperTrend indicators. This powerful technical analysis tool is designed to identify market trends and generate trading signals. What Does It Do? Dual-Level Trend Analysis : Uses customized versions of Tenkan-sen and Kijun-sen lines Automatic Signal Generation : Displays visual markers (arrows) at crossover points Real-Time Alert System : Provides audio and visual alerts when new signals occur Dynam
FREE
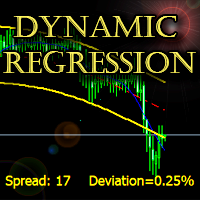
The indicator builds a dynamic regression channel with high accuracy without lagging.
Channel deviation is calculated using a unique formula and displayed on the graph.
Support: https://www.mql5.com/en/channels/TrendHunter
Can be used on any timeframe and any instrument. MT5-version: https://www.mql5.com/en/market/product/64257 Can be used as a ready-made trading system, as well as an addition to the existing one.
Settings: Fast Period - Fast smoothing period; Slow Period - Slow smoothin

Key Levels + Zones
Indicator cleanly displays even numbered price levels: “00s” and “50s” . Additionally, you can display “Mid-Lines” which are preset distance levels on both sides of the even numbered price levels (set to 12.5 pips by default). This 25-pip zone that straddles each even numbered price relates to where many traders place their stops and therefore can be a risk “Zone” to steer clear of when placing your stops. The zone also acts as support and resistance. Indicator p rovide
FREE

Unleash Your Trading Potential with the Golden Fractal Cross Are you tired of second-guessing your trades? Do you wish you had a clear, reliable system to guide your decisions? Introducing the Golden Fractal Cross —a powerful and user-friendly indicator designed to help you spot high-probability trading opportunities. This isn't just another average indicator; it's a complete strategy that combines the precision of fractal patterns with the dynamic power of Exponential Moving Averages (EMAs). Th
FREE

Early Bird Breakout: Capture the Power of the London Open Are you tired of trading in choppy, unpredictable markets? The Early Bird Breakout is your essential tool for exploiting one of the most reliable and explosive patterns in Forex: the Asia Session Breakout . This smart indicator automatically identifies the crucial price levels set during the quiet Asian hours and alerts you the moment the major volume of the London/European session ignites a trend! Key Features and Market Edge Precision
FREE

チャネルインジケータはトレンドであり、再描画されません。 反対のボラティリティ境界を持つATR価格チャネルを作成します。 この指標は、インパルスレベルと偽のブレイクアウトで取引する戦略で十分に証明されています。 指標線の修正でエントリポイントを探し、反対側の境界にテイクプロフィットを設定する必要があります。 Blog-Link - Retest and Fake Breakout with UPD1 。
入力パラメータ 。
Bars Count - 表示する履歴 。 ATR - 計算期間 。 Coefficient - 動的価格チャネルの高さに影響を与える係数 。
Visual Channel - 一行または二行表示 。 Simple Line Visual Width - 単純な線の太さ 。 Simple Line Buy Color - シンプルなラインカラー Buy 。 Simple Line Sell Color - シンプルなラインカラー Sell 。
Reverse Channel - 反対のチャンネルを表示するかどうか 。 R
FREE

This indicator displays pivot points in the chart, including historical vales, and supports many calculation modes for Pivot Points and S/R levels. [ Installation Guide | Update Guide | Troubleshooting | FAQ | All Products ] It plots historical levels for backtesting purposes
It allows you to select the reference timeframe It implements different Pivot Point calculation modes It implements different SR calculation modes
It implements customizable colors and sizes
Calculation Modes The indicator
FREE

The MA ribbon is not a single indicator but rather an overlay of multiple moving averages (typically four to eight or more) of varying lengths plotted on the same price chart. Visual Appearance: The resulting lines create a flowing, ribbon-like pattern across the price chart. Components: Traders can use different types of moving averages, such as Simple Moving Averages (SMA) or Exponential Moving Averages (EMA), and adjust the time periods (e.g., 10, 20, 30, 40, 50, and 60 periods) to suit t
FREE

The "Yesterday High Low" indicator for the MetaTrader 4 (MT4) trading platform is a powerful tool designed to help traders identify key price levels from the previous trading day. This indicator provides a visual representation of the high prices, low prices, high/low price averages, and intermediate average levels on the chart.
Primarily used by institutional and professional traders, this indicator offers an instant view of price levels that are often considered crucial in financial markets.
FREE
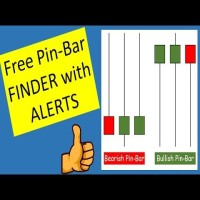
Pinbar Detector is a MetaTrader indicator that tries to detect Pinbars (also known as "Pin-bar" or "Pin bar") and marks them by placing a "smiling face" symbol below the bullish Pinbars and above the bearish Pinbars. It is a pure price action indicator, which is not using any standard technical indicators in its code. The configuration of Pinbar detection can be done via the indicator's input parameters. Pinbar Detector can issue platform alerts and email alerts on detection.
As you can see o
FREE

Supreme Stoploss is an indicator for metatrader 4 that is based on the ATR indicator , it gives stoploss/takeprofit as lines drawn above and below the price , this indicator does not repaint/back paint and is not delayed. can be used to determine the stop loss or take profit of a trade using ATR value multiplied by the number set by user. ====================================================================================================== Parameters : ATR SL period : ATR period identity : leave
FREE
Features List 1:
FVG->iFVG Order Block High Transaction Line (Personal strategy) Premium Discount 50% and 61% Previous day high low Previous week high low Candle end countdown Feature List 2 : (Implemented based on feedback from community groups) trend identification Hide FVG, Order Block, Large Transaction line below 50% equilibrium. Hide all/Individual texts/features FUTURE Feature List (Will be implemented only if at least 5 people request for it.)
Asia, London, NY lq zones (Implemented) Def

The indicator displays overbought and oversold levels, calculating them using the Fibonacci golden ratio formula.
It enables both trend-following and counter-trend trading, accommodating breakouts and rebounds from these levels.
It operates on all timeframes, across various currency pairs, metals, and cryptocurrencies.
Suitable for binary options trading.
Key Features: Based on the Fibonacci golden ratio Shows overbought and oversold levels Suitable for market and pending orders Simple
FREE

This is a multitimeframe RSI indicator defining trends, oversold/overbought zones, as well as all intersections of signal lines from different timeframes on a single chart using arrows and audio alerts. When working with standard RSI, we often need to examine data from all necessary timeframes simultaneously. RSI 7TF solves this issue. If you are only interested in audio signals when signal lines are crossed, then have a look at RSI Alerts . Attention! The indicator uses seven timeframes - M5, M
FREE

THE ONLY CURRENCY STRENGTH INDICATOR THAT IS BASED ON PRICE ACTION. DESIGNED FOR TREND, MOMENTUM & REVERSAL TRADERS
This indicator reads price action to confirm trend and strength . Advanced multi-currency and multi-time frame indicator that shows you simply by looking at one chart, every currency pair that is trending and the strongest and weakest currencies driving those trends.
For full details on how to use this indicator, and also how to get a FREE chart tool, please see user manual HERE

TickFlow はティックデータを解析し、チャート上で重要なゾーンを視覚的に強調するツールです。現在および過去のティックを集計し、買い/売りの比率を表示し、サポート/レジスタンスレベルやクラスター領域の把握に役立ちます。 MetaTrader 5 用バージョンです。 動作概要(簡潔) TickFlow はティックデータを収集し、価格ステップとローソク足(キャンドル)ごとに集計します。
蓄積されたデータに基づいて、アップ/ダウンのティックカウンター、買い/売り比率、履歴レベル、クラスターといった可視化を構築します。
ユーザーは設定で感度や分析期間を調整できます。本ツールはトレードの判断を行うものではなく、分析用のデータを提供します。 特長 ローソク足ごとのティック活動表示(tick counters) 買い/売りの割合(パーセンテージ表示) ティック出来高に基づく履歴のサポート/レジスタンスレベル構築 価格領域のクラスター分析(cluster analysis) スキャルピング、デイトレード、中期取引など用途に応じた柔軟な感度設定 チャートの煩雑化を抑えるためのティック履歴の表示・非表
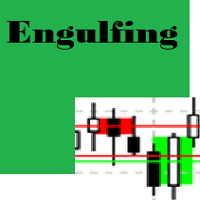
Engulfing Candle Detector
Detectable pattern Double Candlestick Patterns Bullish Engulfing
The first candle is black candle. The second candle opens with a gap below the real body of the black candle but rallies upwards to close above the real body of the black candle. In other words, the second candle's real body completely engulfs the first candle's real body Bearish Engulfing
The first candle is white candle. The second candle opens with a gap above the real body of the white candle but dec
FREE

FREE

Footprint Hunter – MT4で努力と結果を見極めるレーダー Tape Hunterは、MetaTrader 4で価格の裏にある真実の動きを見たいトレーダーのための究極のインジケーターです。POC(ポイント・オブ・コントロール)に基づく買いと売りのアグレッシブな出来高を明確かつ直感的に表示し、各ローソク足の市場の努力と実際の結果を視覚化します。 ️ なぜ重要なのか?
すべての出来高が価格を動かすわけではありません!Footprint Hunterは、努力(アグレッシブな出来高)が価格を本当に動かしているかを示し、以下を見極めるのに役立ちます: 本当のアグレッションとトラップの位置 市場が吸収されているのか押し込まれているのか 支配的な出来高と価格の方向性の一致 Tape Hunterを使えば、プロのテープリーディング視点を得て、より精度の高いエントリーとエグジットの判断が可能になります。 関連インジケーター – フロー分析を強化 より効率的なトレードのために、Tape Hunterと以下の強力なインジケーターを組み合わせて使いましょう:

The indicator looks for buying and selling zones, where a deal can be opened with a minimal stop loss and a better Risk Reward Ratio. The indicator is based on qualitative search of the Double top/Double bottom pattern. This version works only on USDCAD! The full version of the indicator can be purchased here - https://www.mql5.com/en/market/product/29820
Indicator operation principle Looks for local tops/bottoms which can potentially become a Reversal zone It waits for an impulse movement that
FREE
Signal Mastery: Your Edge in the Market Tired of lagging indicators and missed opportunities? Meet Signal Mastery (EMA20-MACD System) —the powerful, non-repainting indicator designed to deliver high-probability trading signals right when you need them. This isn't just another MACD or EMA tool. It's a professional-grade system that intelligently combines EMA 20 and MACD Crossover logic to pinpoint optimal entry and exit points. Best of all, it includes an optional EMA 200 filter to ensure you on
FREE

Many Forex traders assume there is no volume in the foreign exchange market. And they would be correct. There is no central exchange, not yet anyway. And even if there were, what would it report? What there is however is activity, and this is captured as tick volume. After all, volume is simply displaying activity, the buyers and sellers in the market. So for volume read activity, and for activity read volume – simple. The MT4 platform delivers tick data which the Quantum Tick Volumes indicator

The ATR Arrows MTF indicator is built based on the Average True Range (ATR). It provides entry signals as arrows. All signals are generated at the current bar. Signals do not redraw! All signals in MTF mode correspond to the signals of the period specified in the MTF. It is very easy to use both for trading based on one indicator and for use in your trading systems. The indicator timeframe can be set independently of the main window, so you can combine several indicators in one window.
Paramet

This indicator is very useful for day traders or short term traders. No need to calculate the number of pips manually, just look at the chart and you will see the Virtual Take Profit / Virtual Stop Loss target line and evaluate whether the entry point is feasible to reach the intended target or not.
Enter the intended Take Profit / Stop Loss pips for your trade. The indicator will display Virtual Take Profit / Virtual Stop Loss lines for you to easily see if the target is feasible or not.
FREE

This automated DOJI BAR FINDER INDICATOR can be utilized to manage trades and identify potential areas of support and resistance for both buying and selling. It is designed to identify zones for Sell/Buy trades and can be effectively used in conjunction with other indicators, such as order block indicators, and more. Currently designed for MT4, it will later be adapted to function on MT5. We also offer the opportunity to customize the robot according to your trading strategy.
FREE

This indicator demonstrates that the price change of financial instruments is NOT a random walk process, as advocated by the "Random Walk Hypothesis", and as popularised by the bestselling book "A Random Walk Down Wall Street". I wish that were the case! It is shown here that the real situation with price change is actually much worse than a random walk process! Deceptive market psychology, and the bulls-bears tug of war, stack up the odds against traders in all instruments, and all time frame
FREE

Have you ever wanted to be able to catch a trend just as it is beginning? This indicator attempts to find the tops and bottoms of a trend. It uses in-built indicators and studies their reversal patterns. It cannot be used on its own it requires Stochastic(14) to confirm signal. Red for sell, Blue for buy. There are no parameters required just attach to a chart and it is ready to go. Check out other great products from https://www.mql5.com/en/users/augustinekamatu/seller A Winning Trading Stra
FREE

Blahtech Moving Average indicator is a multitimeframe version of the standard Moving Average indicator. It is also enhanced with customisable alerts, period breaks and other configuration options. The 50 day and 200 day moving averages are widely followed by investors and traders, with breaks above and below the MA lines considered to be signals of interest. Links [ Install | Update | Training | All Products ]
Feature Highlights Up to three timeframes Configurable calculation variabl
FREE

Updates
9/12/2023 - If you are looking for the Spock EA, I don't sell it anymore. DM me for more info.
24/10/2023 - Check out my other products. Starting to roll out some EAs & indicators based on this range.
Currently there is no MT5 version. I am using MT4 myself.
So I will spend my time mostly to develop more extensive stats for the Stats version and maybe even an EA. But I might develop a MT5 version.
All depends on the demand. Meaning, the more people request it, the bigger the chan
FREE

Arrow indicator without redrawing and delay The indicator shows the best trend entry points on the chart. It is better to use it in conjunction with other trend indicators as a filter. The indicator shows good results on lower timeframes. The signal is generated inside the candle and appears as blue and red arrows. Displays signals at the zero bar
Settings
Step : Calculation of bars in history
Bar : Shows bars in history
Delta : Offset of the signal from the candle
FREE
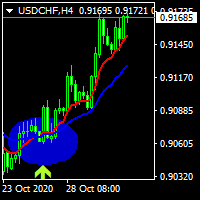
hi dear today i write an indicator of crossing 2 moving averages and show a label for the signals of it . .......................you can select the period of movings and the method of moving............... ......................and also method of apply price and see the movings and signals.................. ................also you can turn off showing movings to see just signal labels.......................... ................................................wish the best for you................
FREE

このアルゴリズムは、Currency PowerMeterインジケーターのアイデアに基づいています。このバージョンでは、表示される値の数は無制限であり、そのコードはよりコンパクトで高速であり、現在のバーの値はインジケーターバッファーを介して取得できます。 インジケーターが示すもの :細いバンドと通貨の前の上の数字は過去N時間の相対力指数を示し(Nは変数「時間」のパラメーターで設定されます)、広いバンドは日次インデックスを示します。入力パラメーターで指定するこの通貨を使用する通貨ペアが多いほど(ブローカーがペアの見積もりを提供すると仮定)、インデックスの重みが大きくなります(ただし、「非メジャー」通貨またはエキゾチック通貨のペアには注意してください。全体像を歪める)。たとえば、EURUSDのみを指定した場合、ユーロの相対インデックスはこのペアのみに基づいて計算されます。EURGBPを追加すると、ユーロインデックスは2つのペアに基づいて計算され、より重み付けされた値が取得されます。 データの使用方法 :重要なニュースがない場合、インデックス値が低い/高いほど、技術的な修正またはトレンドの継
FREE
ヒートマップインジケーター:高度なボリューム分析ツール このインジケーターは、マーケットのボリューム活動を視覚的に表示し、トレーダーが変化をより明確に把握できるようにサポートします。 主な機能 1. ヒートマップ表示 ボリュームの強度を色で表現: • 青:低い活動 • 緑:中程度の活動 • オレンジ:高い活動 • 赤:非常に高いボリューム 2. カスタマイズ可能なインターフェース • ユーザーの好みに応じた色設定 • リアルタイムのパーセンテージ表示(任意) • 見やすく、直感的なデザイン 3. アラート機能 • 市場条件に応じた通知設定 • 重要な変化に対するリアルタイムアラート 4. 最適化されたパフォーマンス • 低リソース消費 • すべての時間足に対応 利用シーン • デイトレード:ボリュームの急増やボラティリティの検出 • スイングトレード:蓄積・分配ゾーンの分析支援 • スキャルピング:市場の急変に素早く対応 設定オプション • 分析期間の調整 • ティックボリュームまたは実際の取引量の選択 • 様々なトレードスタイルに対応する柔軟な設定 利点 • シンプルで使いやすいイ

Recommended on M15 and higher timeframes
Sends alerts and notifications when the zone is create
Sends alerts and notifications if zones are retested
You will see the trading zones and identify the most profitable points to open positions. The indicator marks the supply and demand zones.
With this show you will now make profitable trades that will set the trends.
Shows all support and resistance zones.
Can work in all time zones.
No need to mess with complicated settings, all settings are
FREE

This indicator shows the latest untouched support and resistance as horizontal lines. The indicator can show support/resistance from higher timeframes. With this indicator you can e.g. easily see the support/resistance of the timeframes H4, D1 and W1 on a H1 chart, which can be a big advantage while time your entry on H1. This is the FREE version of the indicator: Support Resistance Multi Time Frame The free version works only on EURUSD and GBPUSD!
Parameters referenceTF: the timeframe from whi
FREE

Ska ZigZag Line indicator determines the overbought and oversold regions within a trend. The indicator determines the overbought region by the candlestick high and the oversold region by the candlestick low in a form of a line. To utilize the full strategy i recommend using "Ska ZigZag Line" together with "Ska ZigZag BuySell". NOTE: This indicator is a line based indicator. HOW TO USE: Sell Signal; Place a sell trade when the Ska ZigZag BuySell indicator arrow appear on top of the Ska ZigZag Lin
FREE

"Capture the sleeping and waking alligator." Detect trend entrance/exit conditions - this indicator can also be tuned according to your trading style. You can adjust a confidence parameter to reduce false positives (but capture less of the trend). This is based on a modification of the Alligator indicator by Bill Williams, an early pioneer of market psychology. 2 main strategies: either the " conservative" approach to more frequently make profitable trades (at a lower profit), or the " high r
FREE

Trend Reversal Catcher with Alert MT5 Trend Reversal Catcher with Alert MT5 は、 リペイントなし・再描画なし・遅延なし のプライスアクション系インジケーターで、市場の正確な反転ポイントを捉えるために設計されています。 ピボット検出、ローソク足パターン(ピンバーや包み足)、そしてATRベースのボラティリティフィルターを組み合わせ、明確で信頼性の高い反転シグナルを提供します。 MT5 https://www.mql5.com/en/market/product/150541?source=Site +Market+My+Products+Page
チャート上に買い/売りの矢印を表示し、リアルタイムでアラートを送信。スキャルピング、デイトレード、スイングトレードに最適で、FX・株価指数・金属・仮想通貨など幅広い市場で利用可能です。 主な特徴
リペイントなし・遅延なし – シグナルはすべて確定。矢印が出現したら消えません。 純粋なプライスアクションベース – 遅行系

FREE TopClock Indicator: This indicator is an Analog Clock That Shows: Local Time Of Pc or Time Of Broker Server or sessions(Sydney -Tokyo London -NewYork)Time or custom Time( with GMT -Base) this can shows Candle Time Remainer with Spread live. You can run this indicator several times for different times and move it to different places on the chart. If you would like, this indicator can be customized for brokers and their IB based on customer needs. For more information contact us if you
FREE

The indicator displays price distribution on a horizontal histogram. Horizontal histogram help find out key levels of price so that you can make good decision on setting point of take profit, stop loss... You can improve exist trading strategy or get new trading idea with the histogram of price.
Outstanding features Support multiple time frame : you can choose to work with history data in any time frame you want. It does not depend on current display time frame.
Support weighting by volume and/
FREE

FTU カラス mt4 プラットフォーム用のインジケーター。取引のみに使用でき、他のインジケーターと組み合わせるのが最適です。 macd、adxなどのさまざまなインジケーターを使用して開発され、エントリーやトレンドの変化を示唆する矢印を描画します このインジケーターは FTU Idioteque に似ています。FTU Predictor などの他のインジケーターを参照してください。 YouTube で短い紹介ビデオをご覧ください: https://youtu.be/n_nBa1AFG0I 特徴: 矢印の販売と購入 視覚と音による警告 トレンド継続 / 早期トレンド転換シグナル 新機能: 履歴内のバーの数を制限する バーから矢印までの距離を変更する 使用法: このインジケーターは、ほとんどの資産グループ、外国為替、商品、指数、暗号通貨で使用できます。 すべてのタイムフレーム、再描画なし、高速読み込み 私の FTU Predictor と組み合わせると、確実に優位性が得られます。 いくつかのアドバイス: 資金管理と規律が鍵であり、単一の戦略や指標が成功をもたらすことはありません。損失は発
FREE
HTF Candle Plus Timer Upgrade your trading experience with HTF Candle Plus Timer, a smart indicator that displays higher timeframe candles directly on your current chart. It allows you to stay aligned with the bigger market picture while focusing on your preferred trading timeframe. Key Features: Higher Timeframe Candles
Plot custom higher timeframe (HTF) candles such as H1, H4, D1, W1, or MN directly on lower timeframe charts for a clearer market overview. Current Candle Timer
A live countdown

MAD Bands(Moving Average Deviation Bands) MAD Bands は、
ボリンジャーバンドの考え方を拡張することを目的として設計された、
ボラティリティベースのバンド系インジケーターです。 一般的なボリンジャーバンドは単純移動平均(SMA)を前提としていますが、
本インジケーターでは EMA、WMA、SMMA、ZLMA など、
複数の移動平均を中心線として標準偏差バンドを計算できます。 ボラティリティ計測を SMA に限定しないことで、
相場環境や時間足、分析スタイルの違いに応じた
柔軟な設定が可能となっています。 主な機能: 任意の移動平均を中心とした標準偏差バンドの表示 複数の移動平均方式に対応(SMA、EMA、WMA、SMMA、ZLMA など) 偏差倍率のカスタマイズが可能 トレンド相場、ボラティリティ変化、スクイーズ/エクスパンション局面の分析に使用可能 高値・安値更新時の価格推移を確認するための補助的な参照として利用可能 確定足ベースで計算され、過去バーの再描画は行いません 注意事項: 本インジケーターは、
従来のボリンジャーバンドをその
FREE

is designed to enhance the visual representation of financial charts in MetaTrader 4 by dynamically altering the colors of various chart elements, including candlesticks, bars, line charts, and volume bars. Its primary purpose is to improve trader intuition and engagement during market analysis by introducing smooth, cyclical color transitions that can highlight momentum shifts, trends, or volatility without overwhelming the display. This functionality is particularly beneficial for traders who
FREE
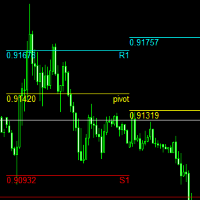
pivot points using by many traders and pivot levels most of the times are very helpfull . this indicator is a custom with internal parameters. it can show two times pivot (weekly and daily). you can choose periods total for each time showing pivots.( 1 week , 2 week ,...1day , 2day ,...) when use weekly and daily pivots , it can show you many support and resistance zones. if have proposal comment too me for upgrading indicator.
FREE
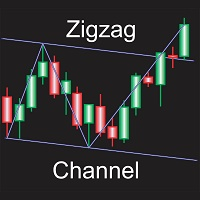
Automatically draws channel base on zigzag, with option to draw zigzag based on candle wicks or close prices. All zigzag parameters can be adjusted in settings, option to display or hide zigzag also available, every other adjustable settings are self explanatory by their name, or at least so I believe. Only download this indicator if you need a program to automatically plot channels for you based on zigzag of any specific settings.
FREE

RSI Candle Signal Indicator will change bars’ color when set overbought or oversold levels reach.
How to Use RSI Candle Signal Uptrend/Downtrends - RSI may be used to detect trending markets. For example, the RSI may stay above the mid line 50 in an uptrend. Top and Buttoms - RSI may help in identifying the tops around the overbought readings (usually above 70), and the bottoms around the oversold area (usually below 30). Divergence - divergence occurs when RSI directional movement is not co
FREE
Unlock Unstoppable Signals : Your Edge in Trading Stop guessing and start trading with confidence! The Unstoppable Signals (BB-AO-MACD System) indicator is your all-in-one tool for catching high-probability moves in the market. We've fused the power of three proven indicators— Bollinger Bands (BB) , Awesome Oscillator (AO) , and MACD —into one simple system that gives you confirmed, non-repainting signals right on your chart. Why You Need This Indicator This isn't just another average tool; it'
FREE

“Gold Miner Robot” is a very powerful AI-Based robot designed and built to accurately analyze the market and trade on gold. Developed by “Keyvan Systems” after more than 3 years of research and development on each tick of the gold chart. "Gold Miner Robot" uses a complex algorithmic approach based on price analysis, trend analysis. We have also provided two other personalized indicators called "GoldMinerRobot SI 1" and "GoldMinerRobot SI 2" for better market analysis, which you can download free
FREE

Indicator Description GOLD TITAN KING SIGNAL INDICATOR High-Precision Gold Scalping Buy/Sell Signals – Manual Trading Assistant Overview The Gold Titan King Signal Indicator is a manual trading assistant tool designed for high-frequency scalping on Gold (XAUUSD) and other major pairs.
It generates clear BUY/SELL signals with precise entry levels, along with adjustable Stop Loss and Take Profit levels displayed directly on the chart. ️ This tool is NOT an EA. It does not execute trades

The principle of this indicator is very simple: detecting the candlestick pattern in M30 timeframe, then monitoring the return point of graph by using the pullback of High-Low of M5 Candlestick and finally predicting BUY and SELL signal with arrows, alerts and notifications. The parameters are fixed and automatically calculated on each time frame. Example:
If you install indicator on XAUUSD, timeframe M5: the indicator will detect the reversal, pullback, price action on this timeframe (for exa
FREE

ADX Channel is an indicator that plots the channel depending on the values of the ADX (Average Directional Movement Index) indicator. The resulting channel is a little similar to the Envelopes, but its lines depend on the market volatility. The sell trade is usually executed fast when the price touches and bounces from the upper line of the channel, buy - from the lower. It is recommended to trade when there is no significant news. The recommended timeframes: M5 - H1. The indicator is not design
FREE
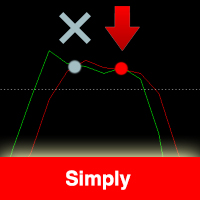
The indicator is based on the Stochastic indicator. I also recommend to see my EA Night Zen Strategy: It contains a strategy for crossing the K and D lines in the overbought (for sales) and oversold (for purchases) zones. The indicator gives a signal at the second intersection.
The signals are not rewritten, they appear after confirming the intersection of the K and D lines.
Settings: Stochastic Indicator Settings Indicator period Notification and Alert Settings
FREE
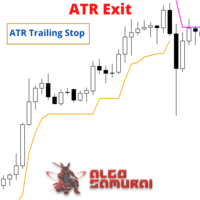
The ATR Exit indicator uses the candle close + ATR value to draw trailing stop lines (orange under buys, magenta over sells) that advance with the trend until the trend changes direction. It uses a multiple of the Average True Range (ATR), subtracting it’s value from the close on buy, adding its value to the close on sell. Moreover, the trailing stop lines are generated to support the order’s trend direction (long or short): In an upward trend, the long trailing stop line (orange line under bu
FREE

製品名 Smart Bollinger Bands (MT4) – SmartView シリーズ 短い説明 MetaTrader プラットフォームで独特なユーザー体験を提供する Bollinger Bands インジケーター。以前は利用できなかった高度な機能を提供し、ダブルクリックで設定を開く、削除せずにインジケーターを非表示/表示する、インジケーターウィンドウをチャート全体のサイズで表示するなどの機能を備えています。SmartView Indicators シリーズの残りの部分とシームレスに連携するように設計されています。 概要 SmartView シリーズは、革新的な機能を通じて MetaTrader プラットフォーム上のインジケーターに独特で特徴的なユーザー体験を提供し、インジケーター管理をより速く、より簡単にします。各インジケーターには、チャート上のスマートコントロールパネルが装備されており、基本情報を表示し、すべての重要な機能への迅速なアクセスを提供します。 以前は利用できなかった独自の機能 SmartView シリーズは、インジケーターでの作業をより簡単で迅速にする高度な機
FREE

Esse indicador mede o 1º Canal de referencia e a 1º Zona Neutra * configurar o canal macro para verificar a frequencia MAIOR H1 H4 1D * configurar o canal micro para verificar a frequencia Menor 1M 5M 15M Como instalar o Indicador fimathe. E uma pré mentoria tem uma estrategia Secreta bonus nesse video . assitao o video para enteder as logicas que podemos iniciar com esse indicador.
https://www.youtube.com/playlist?list=PLxg54MWVGlJzzKuaEntFbyI4ospQi3Kw2
FREE

このプロジェクトが好きなら、5つ星レビューを残してください。 機関が大きなボリュームを取引するので、それらが試してみることは珍しくありません
特定のパーセンテージレベルでポジションを守る これらのレベルは、あなたが使用できる自然なサポートと抵抗として役立ちます
取引を入力するか、ポジションに対する危険性を認識する。 一般的に使用されるパーセンテージの例は、EURUSDの0.25%と0.50%です。
毎週、スクリーンショットでこの例を見ることができます。 このインジケータを使用すると、以下の割合の変動を描画することができます。 日。 週。 月 日 クォーター。 生年月日
FREE
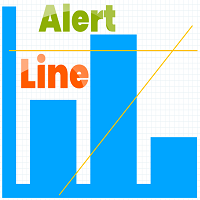
Indicator Rua Alert Line. This indicator will notify when the High-price of candle breaks any TrendLine or HorizontalLine on the chart. Notifications will be sent to the phone and on MT4. And it have ArrowBuy/ArrowSell on chart. It is very useful for those of you who use the TrendLine or HorizontalLine but do not have time to observe the chart. Timeframe M1 to W1 Symbol: All
FREE

[各指標の偏差MT4]は18個の指標の集合であり、そのうちの1つを任意に選択して計算に参加させることができます。それは各指標の偏差形を計算することができアラームを促すことができます。
パラメータ設定の説明
[指標]は、計算に参加する18の指標のうちの1つを選択することです (このパラメーターは非常に重要です) 。
[period]は各指標に共通の周期です。
[方法]はいくつかの指標のMAモードです。
[Apply_to]はいくつかの指標の適用価格です。
[Fast_EMA] [Slow_EMA] [MACD_SMA] [K_period] [D_period] [Slowing]これらはいくつかの指標に必要なパラメータですが、これらのパラメータを必要とする指標はほとんどありません。
[Forward_disparity]は、Kラインから現在のローまたはハイまでの最小距離です。
[Forward_count]は前方検索の最大数です。
[***表示形式***]下向きは矢印と線のサイズと色を設定することです。
[alert_NO_OFF]:これはアラームスイッチで、tr
FREE
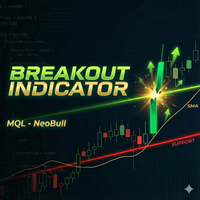
NeoBullブレイクアウトインジケーター - プロフェッショナルなブレイクアウトトレードを簡単に NeoBullブレイクアウトインジケーターは、 MetaTrader 4 向けの強力なテクニカルインジケーターで、ブレイクアウトトレーダー専用に設計されています。実証済みの最高値/最安値レベルとSMA 200トレンドフィルターを組み合わせて、高確率のブレイクアウトセットアップを識別します。 主な機能: ステップ型最高値(20)ライン - 過去20期間の最高値を明確な水平線として表示(TradingViewのように) ステップ型最安値(20)ライン - 過去20期間の最安値を明確な水平線として表示 SMA 200トレンドフィルター - より正確なシグナルのために全体的なトレンドを識別 インテリジェントなブレイクアウトアラート: HHブレイクアウトアラート:価格が最高値を突破し、かつSMA 200より上にある場合に発動(上昇トレンド) LLブレイクダウンアラート:価格が最安値を突破し、かつSMA 200より下にある場合に発動(下降トレンド) モバイルプッシュ通知 - どこにいてもチャンスを
FREE

This indicator scans for you up to 30 trading instruments and up to 8 timeframes for occurrences of the high probability reversal patterns: Double Tops/Bottoms with fake breakouts . Please read also the blog post " Professional Trading With Double Tops/Bottoms And Divergences! " which explains the concepts behind the ULTIMATE Double Top/Bottom indicator and how you can use a professional top-down approach. This FREE Version of the Scanner scans only EURUSD and GBPUSD. The full version of the sca
FREE

このプロジェクトが好きなら、5つ星レビューを残してください。 大規模なボリュームを取引するには、複数の楽器/チャートを調べる必要があります
新しい機会を見つける, このインジケータは、特定の特定のプロットによってあなたを助ける
数またはそのサフィックスの複数のレベルによって、それらを自動的に更新します
価格が変更されると、そうでなければ退屈なタスク。 例えば、GBPUSDでは、インジケーターの4つのインスタンスを
チャートをプロットする: 線長100バーの各0.01間隔。 線の長さ25バーの0.0075間隔で終わる各価格。 線長50バーの0.0050間隔で終わる各価格。 25バーの線長で0.0025間隔で終わる各価格。 このようにして、定規に似ているので、この例が非常に見られます。
スクリーンショット。 また、色やラインのスタイルを異なるスタイルで設定できます。
レベルを視覚化しやすいようにします。
FREE

The Correlation Matrix indicator shows the actual correlation between the selected instruments. The default setting is set to 28 currency pairs, gold, and silver, but the indicator can compare any other symbols.
Interpretation of the indicator Positive correlation (correlation is above 80 %). Negative correlation (correlation is below -80 %). Weak or no correlation (correlation is between -80 and 80 %).
Main features The indicator shows the actual correlation between the selected instrumen
MetaTraderプラットフォームのためのアプリのストアであるMetaTraderアプリストアで自動売買ロボットを購入する方法をご覧ください。
MQL5.community支払いシステムでは、PayPalや銀行カードおよび人気の支払いシステムを通してトランザクションをすることができます。ご満足いただけるように購入前に自動売買ロボットをテストすることを強くお勧めします。
取引の機会を逃しています。
- 無料取引アプリ
- 8千を超えるシグナルをコピー
- 金融ニュースで金融マーケットを探索
新規登録
ログイン