YouTubeにあるマーケットチュートリアルビデオをご覧ください
ロボットや指標を購入する
仮想ホスティングで
EAを実行
EAを実行
ロボットや指標を購入前にテストする
マーケットで収入を得る
販売のためにプロダクトをプレゼンテーションする方法
MetaTrader 4のためのテクニカル指標 - 110

I recommend you to read the product's blog (manual) from start to end so that it is clear from the beginning what the indicactor offers. This multi time frame and multi symbol supply and demand zone dashboard indicator sends alerts when the price has reached a supply/demand zone. It is also possible to use it to be alerted about regular double tops/bottoms instead of zones. It can be used with all time frames from M1 to MN. It is possible to use RSI, divergence (MACD, OsMA, RSI or Awesome) a

The “Market maker move" indicator is written for trading GOLD on M5 The indicator perfectly confirms the rebound or breakdown of the support and resistance levels. The indicator does not lag, does not redraw, and does not change values during testing. With proper use of the “Market maker move" indicator, you can trade almost without drawdown. To do this, you just need to plot the support and resistance levels on the chart. The “Market maker move" indicator is a powerful assistant for trading. Th

The indicator implements a kind of technical analysis based on the idea that the market is cyclical in nature. Tracks the market trend with good reliability, ignoring sharp market fluctuations and noise around the average price. Thus, all intersection points will be optimal points at which the movement changes taking into account the indicator period. It catches the trend and shows favorable moments of entering the market with arrows. Crossing points can be used as potential market reversal poin

Determining the market trend is an important task for traders. The Inside indicator implements an improved algorithm for visualizing the market trend. The main purpose of the indicator is to evaluate the market on small timeframes (i.e. M1, M5 and M15) for scalping. If you are a scalper looking for a reliable indicator to improve the quality of your trading, Inside is what you need. The indicator works in a separate window, showing red and green bars on the histogram. Two consecutive green (red

Greetings to you!
I want to present to your attention a new product. It's not just an indicator - it's a whole system: a mix of several CCI oscillators , a signal moving average (MA) , an additional oscillator index (optional) and matrix calculations .
You don't have to do a complex analysis of the indicator. This system is equipped with arrows notifying about entering the position. It have are signals that will allow you not to follow the chart, in fear of missing the entrance to the mark
[ MT5 Version ] How to trade using the Fear and Greed Indicator: Click here Uncertain about when to take total or partial profits? The Fear and Greed is your reliable companion for making confident trading decisions. This innovative tool offers unparalleled insights into market sentiment, helping you identify key pivot zones and optimize your trading strategy. Why Choose Fear and Greed? Revolutionary Market Insight: Sentiment Analysis: The first indicator for that reveals the market's Fear and

The correlation coefficient reflects the relationship between two values. It shows the dependence of changes in one value on changes in another. For example, from changes in the price of EURUSD and EURNZD. The correlation coefficient in trade, currency relations is constantly changing. Special indicators of correlation help to define it, trace changes, draw correct conclusions. One of them is the Hubbles Correlator indicator. The indicator allows you to simultaneously display several other char

Colored candlesticks showing the trend based on two moving averages and the slope of the slow moving average. For long term trends use Period2 = 200. Convenient to filter trends according to your trading strategy The time unit also depends on your trading style Gives you a signal for each trend, displayed on the screen coloring the candlesticks. No sound signal; no push notification; these functions will be there in the next updates

A technical indicator that calculates its readings based on trading volumes. It has an oscillatory line that follows the change in volumes.
Large arrows on the line indicate reversal values. A channel is built around the line with small arrows showing the strengthening of price movement in the direction of increasing volumes.
The indicator does not redraw values. Works on any instrument and timeframe. It can complement any trading strategy by finding a trend or make entries in the direction of a

the indicator will show signal arrows on the graph at the crossing two EMA it has push and audible alerts. By crossing above each others , a blue arrow will come out for the BUY, at the same time an audible signal will sound. By crossing Below each others, a red arrow will come out for the SELL, at the same time an audible signal will sound. Possibility to deactivate push and audible alerts.

the indicator will show signal arrows on the graph at the crossing of Awesome Oscillator base level it has push and audible alerts and Email alert. By crossing above base level , a blue arrow will come out for the BUY, at the same time an audible signal will sound. By crossing Below base level, a red arrow will come out for the SELL, at the same time an audible signal will sound. Possibility to deactivate push and audible alerts. MT5 version : Buy the 'Awesome cross MT5' Technical Indicator fo

the indicator will show signal arrows on the graph at the crossing of MACD level it has push and audible alerts. By crossing from low to high level 0, a blue arrow will come out for the BUY, at the same time an audible signal will sound. By crossing from low to high level 0, a red arrow will come out for the SELL, at the same time an audible signal will sound. Possibility to deactivate push and audible alerts.
MT5 : Buy the 'MACD Arrow' Technical Indicator for MetaTrader 5 in MetaTrader Marke
Forex indicator for day trading for beginners. This indicator shows with arrows when the price turns in the other direction. At this moment, you can conclude deals. The indicator trades on H1, H4 timeframes. The indicator also shows the trend direction with lines. During the day, you can open deals in the direction of the trend and set a minimum 15-20 points of TakeProfit. When one deal is closed by take profit, you immediately open another deal in the direction of the indicator line.
How the D

Royal Wave is a Trend-Power oscillator which has been programmed to locate and signal low-risk entry and exit zones. Its core algorithm statistically analyzes the market and generates trading signals for overbought, oversold and low volatile areas. By using a well-designed alerting system, this indicator makes it easier to make proper decisions regarding where to enter and where to exit trades. Features Trend-Power Algorithm Low risk Entry Zones and Exit Zones Predictions for Overbought and Over

High Probability Reversal Indicator The indicator looks for trend exhaustion areas, and plots Buy/Sell arrow after confirmation of trend exhaustion. Signals can also be shown as popup alerts, or be sent as e-mail or mobile phone notification. Trades can be taken on breakout of the signal candle. Inputs
Signal Type: Aggressive/Normal History Bars : Can be set to 0 (zero) to show all historical signals, or can be set to a limited number of bars for faster execution. Show Alert : True/Fal

Meta Trend Indicator is an efficient way to forecast and detect the trend in any market. It reveals the trend, support and resistance levels, volatility and the maximum potential target, all in one indicator. To adapt to the price and to decrease consecutive trend failures, the internal trend detector algorithm studies the market and dynamically chooses the right values for the internal parameters. This indicator is a perfect trend filter for any strategy or expert advisor. Features Super Adapti
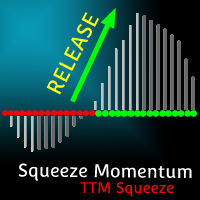
MT5 Version TTM Squeeze Momentum
TTM Squeeze Momentum is an enhanced indicator ideal for recognizing consolidation periods in the market and the start of the next explosive move. This improved version is a volatility indicator based on John Carter's "TTM Squeeze" in which the histogram is based on a linear regression rather than a simple momentum indicator. Red dots on the middle line indicate that the market has entered a "Squeeze" zone or consolidation period, indicated in this enhanced versi

the first release of the new year's special promo price.normal price 150 USD. important user guide is here https://heyzine.com/flip-book/62a16c6955.html indicator to speed up finding support and resistance price.very easy to use very neat interface.doesn't display unnecessary confusing things.uses basic trading strategies for professional traders.....happy trading if something is still not clear,please contact me personally,i will reply later

Qv² OBOS is an indicator that aims to identify overbought and oversold regions considering price standard deviation and volume analysis.
Oversold signals are indicated by arrows pointing upwards.
Overbought signals are indicated by arrows pointing downwards. Can be used in all timeframes. Can be used on all pairs. I use in H1 Important note, the histogram is displayed to improve the trader's analysis. But the signs of overbought and oversold are the arrows as mentioned above.
Important note:

Канальный индикатор "Snake" . Отлично показывает точки входа и выхода.
Не перерисовывает!
Хорошо подойдет для стратегий с сетками (усреднения), стратегий с пирамидами (стратегий добора), обычной торговли по тренду, торговли на коррекции.
Для любых типов инструментов: валюты, нефть, металлы, криптовалюты. Для любых таймфреймов: от M1 до D1 . Для любых стилей торговли: скальпинг, интрадэй, свинг, долгосрок .
Используйте в сочетании с трендовым индикатором, чтобы исключить риски входа про

Нестандартный индикатор определения текущего тренда. Альтернативный подход к определению текущей рыночной тенденции. В основе лежит уникальный алгоритм. Не используются скользящие средние , осцилляторы , супер-тренды и прочие стандартные индикаторы.
Для таймфреймов: от M15 до D1 . Для стилей торговли: интрадэй, свинг, долгосрок .
Может стать готовой торговой стратегией совместно с любым канальным индикатором. Например таким, как индикатор "Snake" . Внимание! Это индикатор, а не советник,
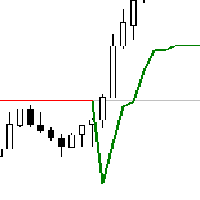
Based on supertrend indicator ,
get alert based on trend change of very popular SUPERTREND indicator..
Supertrend indicator can be used for both trend change setups or inline trend confirmation can be seen as trend continuation. providing as better entries and exits. or you can use supertrend indicator also as dynamic support and resistance zone.
When applied to chart Dashboard will scan and show current position of price with respect to supertrend indicator , and you will be able to get

The Qv² Trend is an indicator that aims to identify trends.
Buying trend signals are indicated by arrows pointing up.
Selling trend signals are indicated by arrows pointing down.
It can be used in all deadlines.
It can be used in all pairs.
I use it on the H1 with a period of 24.
Important note: I recommend using it in markets that naturally show trends. For in range markets I present my other indicator on this link OBOS
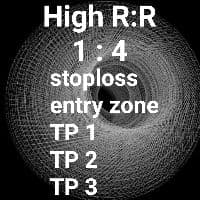
フィボナッチブレイクアウトは、フィボナッチリトレースメントを使用した取引戦略です。このテクニックは、実際にはトレンドの始まりに入ることができるテクニックです。初心者でもわかりやすいです。 戦略は、自動カスタムフィボナッチが表示されるのを待ってから、手動で保留中の注文を出し、損失を止めてフィボナッチのレベルで利益を得る必要があるということです。価格が再テストに成功すると、ポジションがオープンします。外国為替、暗号通貨、株式に適したフィボナッチブレイクアウト。 フィボナッチブレイクアウトレベルの詳細: 1-トレードの監視= 0(ストップロスレベルになる可能性があります) 2-エントリーゾーン= 0.50 – 1.00(ゾーン内の価格の場合のエントリー) 3-利益ゾーンを取る TP1= 1.618 TP2= 2.618 TP3= 4.236
標準操作手順(SOP) •SOPは非常にシンプルで、理解しやすいものです。システムは以下の存在を識別します: 1.イニシャルブレイク(IB)またはドミナントブレイク(DB) 2.キャンドルブレイク1(CB1)-X記号の青または赤の色でマーク(実

Coral Trade Planner is a 3-in-1 tool for making smart trades. The Lot Size Calculator lets you determine the appropriate lot size based on risk, and see the impact on your risk as you change the stop loss distance and/or lot size. The Trade Planner is an innovative tool for visualizing your planned trades on the chart, and gives you immediate feedback on the value of the trade (both the risk of hitting your stop loss and the reward of hitting your take profit). Both Market and Pending order

QV2 MA is an indicator that displays the results of two smoothed moving averages applied to Candles. Item 01 - Buy signal: Candle show color Aqua when the 4-period smoothed moving average is expanding and above the 24-period smoothed moving average. Item 02 - Sell Signal: Candle show color HotPink color when a 4-period smoothed moving average is expanding and below the 24-period smoothed moving average. Item 03 - The gray candle is an undefined region.
When the candle is gray, there are two rec
It seems like there might be a typo or incomplete request in your message ("japanese 'v'"). I assume you meant to request the text translated into Japanese, similar to your previous requests. Below is the translation into Japanese of the original text you provided, following the same pattern:
---
「ロシア語で書く『重要なお知らせ – ライセンスとアクティベーションが必要です』
アクティベーション手順:
ご購入が完了したら、すぐに弊社にご連絡いただき、ライセンスキー、パスワード、またはアクティベーションの詳細をお受け取りください。これらがないと、ソフトウェアは動作しません。スムーズなアクティベーションプロセスを確保し、ご質問にお答えするためにサポートいたします。
多言語カスタマ

This is a custom RSI of MA indicator consisting of 8 indices: AUDindex, NZDindex, CADindex, EURindex, CHFindex, GBPindex, USDindex and JPYindex. It can run on Forex brokers' servers having 28 currency pairs. No repaint.
How to Use When one of the 8 indices turns upwards, sell the strongest pair. When one of the 8 indices turns downwards, buy the lowest pair.
+ For newbies: Best trading has been detected on H1 chart in Euro session and US session to avoid sideways market Or use timeframe M5/M15

sarangani venom is 100% profitable, easy to use indicator, a chart without indicator is stressful and will lead you to many losses, this indicator is pleasing to the eye that will gives you more confident to trade when there is signal, your computer will gives sound and the spider will animate, it can be used to all time frame and to all currency, you have many options, when the candlestick touches to upper line it is buy, when it touches to lower line it is sell, when the rope is pull to buy ar

Xmasterインジケーターの新しいより正確なバージョン。最も効果的で正確な式を得るために、世界中の200以上のトレーダーが、PCでこのインジケーターのさまざまな組み合わせの15,000以上のテストを実施しました。そしてここでは、正確なシグナルを表示し、再ペイントしない「Xmasterフォーミュラインジケーター外国為替再ペイントなし」インジケーターを紹介します。このインジケーターはまた、電子メールとプッシュによってトレーダーにシグナルを送信します。新しいティックが到着するたびに、75以上のパラメーターで市場を常に分析し、トレーダーに正確な売買シグナルを示します。また、このインディケータの助けを借りて、正しい方向で取引を開始するためにトレンドが現在どの方向に進んでいるかを確認できます。 新しい「Xmasterフォーミュラインジケーターforexno repaint」インジケーターはどのように機能し、古いバージョンと何が違うのですか? まず第一に、それは世界中のさまざまなトレーダーによって15,000回以上テストされた最も最適化された市場分析アルゴリズムです。 第二に、このインジケーター

外国為替指標「鉄コンドル戦略」を使用すると、外国為替市場で非常によく知られているオプション戦略を適用できます。このインディケータの助けを借りて、いつ買い取引を開始し、いつ販売取引を開始するかを知ることができます。 「鉄コンドル戦略」インジケーターは、チャートの矢印を使用してこの情報を示します。これにより、5秒でインジケーターシグナルを確認することで、取引を開始するために必要な方向の情報を取得できます。チャートを1時間分析する代わりに、チャートを5秒間見るだけで、取引に必要なすべての情報を受け取ることができます。
「鉄コンドル戦略」指標による取引戦略: 赤い矢印-売ります。 TakeProfit15ポイント。 StopLoss25ピップ。 青い矢印-購入。 TakeProfit15ポイント。 StopLoss25ピップ。
「鉄コンドル戦略」インジケーターの設定: 期間-期間。信号間の距離を大きくします。 バー-シグナルが表示されるチャート上のバーの数。
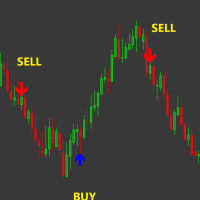
Buy sell indicator mt4 is a signal indicator that shows the price rollback points to the trader. At the points where the arrow appears, the indicator shows the trader that a price rollback is possible for a long or short distance. Thus, the trader can catch these moments and open trades. This works well for trading with a salping strategy. You see that an arrow appears, open an order in the direction of the arrow and place a TakeProfit in the amount of 15-25 points. Thus, you can open from 5 to
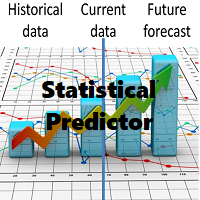
Waddah Attar Statistical Predictor
This indicator show you the Statistical Forecast for any symbol. it depends on a history data . the result show on a new day and still with no change until end of the day . with this indicator you can : know the main direction . know the range of the movement . know high and low in the current day . use indicator levels in any expert you made to auto trade .
Preferably used with main symbols like EURUSD, GBPUSD, AUDUSD, NZDUSD, USDJPY, USDCHF, USDCAD, Gold, S

Possible Price reversals levels - based on Fibonacci + Support + Resistance Levels Auto levels drawn based on input index (Bars Count ) ---->>> Price Over 50% Fibo line ---> UP TREND ---> BUY when price drop near Support Lines ---->>> Price Down 50% Fibo line ---> DOWN TREND ---> SELL when price goes up near Resistance Lines
--->>> The more close price levels ----> the more possibility for price reversals --->>> are you a scalper --> try it on M1 charts with big index like 5000 bars or

A trend indicator is a hybrid of several indicators that process data sequentially with signaling a trend change. Advanced net price action calculation to find LH and HL breakouts. Finishing the indicator data will give you excellent pivot points in the market. LH and HL signals can also be used for breakouts of the training. The indicator has proven itself well in a strategy based on impulse levels and false breakouts. When a breakout occurs, it indicates a strong reversal. A good filter for mo

Bella is one of the most popular indicators that allows you to timely identify a trend reversal, get an early entry point and pinpoint the place of profit taking. The Bella indicator implements the main idea of the trader and generates a point of entry into the market in the direction of the trend.
Bella is used when there are additional indicators. To filter such signals, you can use the same indicator on older timeframes. Thus, the work with the indicator is improved, while maintaining its

Here is a sensitive indicator for Dublgis professionals. It is built on completely new algorithms and is more efficient, on any timeframes, since it filters random price movements. Finds and visually displays price reversal points. This tool can be used as confirmation when making a deal, as well as to determine the direction of the trend and its strength. The indicator was developed as a complement to a number of our other trading tools.

The Context Aviation indicator analyzes the price behavior and if there is a temporary weakness in the trend, you can notice this from the indicator readings, as in the case of a pronounced change in the trend direction. It is not difficult to enter the market, but it is much more difficult to stay in it. The Context Aviation indicator makes it much easier to stay in trend! This indicator allows you to analyze historical data and, based on them, display instructions for the trader for further a

The advantage of working with the Brian signal indicator is that the trader does not need to conduct technical analysis of the chart on his own. The tool generates ready-made signals in the form of directional arrows. This tool is an arrow (signal) one and works without redrawing.
Its signals are based on a robust algorithm. When used simultaneously on multiple timeframes, this indicator will truly "make the trend your friend". With it, you can follow trends on multiple timeframes in real time

重力拋物線系統 (Mostafa System)
輕鬆判別趨勢走向
提示完美進場點位
交易輔助清單
順勢交易系統
系統介紹:
重力拋物線系統,使用多項式非參數回歸方法計算拋物線重心及趨勢方向,而價格有非常高的機率會按照拋物線的趨勢方向前進,在依個上升趨勢拋物線中,綠線將會是我們第一個進場點,橘線會是第二個進場點,止損位置僅需要放置在橘線下方。此系統可大幅增加趨勢交易的勝率,交易者可清楚分辨當前交易方向,以及系統建議的進場位置。
影片教學:
UncleForex 外匯大叔 ( https://youtu.be/G4Xahx2Mivg )
今天大叔跟大家分享一套由歐洲的分析師,同時也是交易冠軍的 Mostafa Belkhayate 大師所創建的重力拋物線系統策略。
在交易的道路上我們時常聽到"順勢而為" ,按著趨勢方向去交易,然而大部分的交易者很難了解當下的盤面,到底是上升趨勢還是下降趨勢呢? 而重力拋物線系統,卻可以一眼輕鬆辨別趨勢?!
且還能找到最佳的進出場點位!趕緊觀看影片了解吧 ~

Diamonds Min5 - DM5-
DM5 is an indicator that suggests entering levels (sell or buy) ,it always follow the trends using parabolic sar , working on is so easy, you need just to attach it to the chart and all the magic will show , this indicator does not repeat itself or redraw signals .
After months of testing, it provides a very good result it works on all pairs with no excaption

Super Signals Channel Indicator
Its channel is a non-repaint indicator that reacts more with recent price movements. For this reason, the Super Signals Channel Indicator is a better match for short-term or day trading strategy. The Super Signals Channel only plots swing trading opportunities. So most of its trade signals appear during consolidation or sidelined periods of the market. Super Signals Channel Indicator for MT4 Explanation The green band below the price shows the dynamic support le

Qv² Stdev is indicator developed based on standard deviation of prices and trading volume.
Buy signals are indicated by arrows up.
Sell signals are indicated by arrows down.
An important detail is that the Qv² Volume has two bands, an upper and a lower, both of which serve as a target for take profit.
It is recommended to use it in H1
Can be used in all pairs (I use in Gold).
Good Business, in the trending market To find out some more about my work please click here

超級剝頭皮系統 (Super Golden System)
短線交易的系統
超快速進出場獲取利潤
系統自帶提示功能
自動分析出場位置
系統介紹:
由Jasonforex團隊編寫的價格判斷系統 , 分析當前週期趨勢方向,並結合Parabolic SAR 中短期指標技術,確認明確的反轉位置 , 及推薦出場位置 , 形成高勝率的短線交易模式 ,超級 剝頭皮系統在符合進場條件時,會在MT4上即時通知提示,提醒最佳的短線交易機會。
進出場設定位置:
買單(BUY)
TP(止盈價位): 箭頭或提示訊息出現,當前價位 + GoldenK-TP * 自定義倍數
SL(止損價位): 當前價位 - GoldenK-TP * 自定義倍數
賣單(SELL)
TP(止盈價位): 箭頭或提示訊息出現,當前價位 - GoldenK-TP * 自定義倍數
SL(止損價位): 當前價位 + GoldenK-TP * 自定義倍數
參數設定: 1. ShowArrows: 買單及賣單箭頭訊號提示
2. alertsOn: 所有通知訊息總開關(Message訊息/Soun
MT5 Version
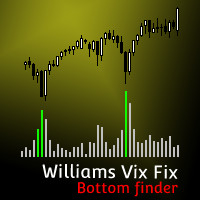
Williams Vix Fix MT4 Need help trying to time the bottoms in the market? Williams Vix Fix MT4 is based on the volatility of the market and grants a huge support for finding out when a correction is comming to its end. TRY IT FOR FREE NOW! Williams Vix Fix MT4 derivates from Larry Williams's VixFix indicator addapted for fitting every asset class . VIX reprensents the fear and greed in the market based on its volatility. A high VIX value shows fear in the market, this is usually a

Trend Indicator, a revolutionary trend trading and filtering solution with all the important trend tool features built into one tool! The Step Success indicator is good for any trader, suitable for any trader for both forex and binary options. You do not need to set up anything, everything is perfected with time and experience, it works great during a flat and a trend.

Piccoline is a very interesting trend indicator. The Piccoline indicator helps to identify either a new or an existing trend. One of the advantages of the indicator is that it rebuilds rather quickly and reacts to various changes in the chart. Of course, it depends on the settings, namely, the specified CalcBars period. The larger it is, the smoother the trend line will be. The shorter the period, the more market noise will be taken into account when forming the indicator.
The indicator wa

WIth this indicator you can find Engulfing pattern that touch bollinger bands + optional moving average rule. For bearish engulf to form, second body (bearish) must be bigger than first (bullish) and one of them must be touching upper bollinger band with closed price. For bullish engulf to form, second body (bullish) must be bigger than first (bearish) and one of them must be touching lower bollinger band with closed price. You can also use moving average rule, so bearish engulf must be below MA

WIth this multi time frame and pair Scanner, you can find Engulfing pattern that touch bollinger bands + optional moving average rule. For bearish engulf to form, second body (bearish) must be bigger than first (bullish) and one of them must be touching upper bollinger band with closed price. For bullish engulf to form, second body (bullish) must be bigger than first (bearish) and one of them must be touching lower bollinger band with closed price. You can also use moving average rule, so bearis
Extremums Max is an indicator of trend and trading signals, based on the principle of a combined analysis of calculated reference points within the channel as well as overbought and oversold levels.
The indicator forms arrows (by default, red and blue). The indicator is set in the usual way to any trading symbol with any time interval.
Indicator Benefits High accuracy; Work with any trade symbols; It works at any time intervals; Not redrawn. Input parameters Period - indicator period; Level
ABSOLUTELY DO NOT REPAINT, 100% GUARANTEED!!
With this indicator you will be able to identify the trend of the financial pairs in which it is loaded. By means of a graph of arrows that definitely do NOT repaint, this indicator shows you where the current trend is going.
It also has the plus that you can view the trend in the different time periods (as you can see in the screenshots) in a top bar where you can see the different time periods in green (bullish) or red (bearish) depending on the c

You can use the Viking Trend indicator as the main one to determine the trend. The indicator can work both for entry points and as a filter. This is a hybrid trend indicator, as it is based on the signals of elementary indicators and a special algorithm for analysis. The indicator reflects information in a visual form; it can be used both for pipsing on short periods and for long-term trading. The indicator does not redraw and does not lag. Take Profit is bigger than Stop Loss! Works on all curr
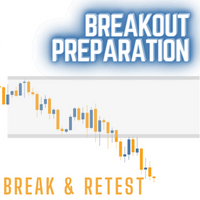
Breakout Preparation Choppy movement up and down on the opening range everyday. Trading breakouts on London session and New York session is recommended. Setting a bounce for a certain time zone and trade when the bounce reveals a break through. Input Parameter Indicator Name Days to Show Start Time to Analysis End Time to Analysis Bounce Show till Time Chart Setting Color Scheme Selection
Happy Trading and thanks for support.

The intelligent algorithm of the Calc Flagman indicator determines the trend well, filters out market noise and generates entry and exit levels. The indicator shows potential market reversal points. Works on all currency pairs and on all timeframes. Ready trading system. Uses only one parameter for settings. Simple, visual and effective trend detection. The indicator does not redraw and does not lag. You can set up message alerts as sound or email.
The principle of this indicator is very simple: detecting the trend with Moving Average, Predicting BUY and SELL signals with arrows, alerts and notifications. The parameters are fixed and automatically calculated on D1 timeframe. You can trade with small timeframe or using Dash DIY Ai Robot, Dash Smart Majors Strategy for autotrading on any timeframe and any currency pairs. You can download template and the presets file for autotrading with Dash Smart Majors Strategy . Example: If you install i

** All Symbols x All Time frames scan just by pressing scanner button ** *** Contact me to send you instruction and add you in "Divergence group" for sharing or seeing experiences with other users. Introduction MACD divergence is a main technique used to determine trend reversing when it’s time to sell or buy because prices are likely to drop or pick in the charts. The MACD Divergence indicator can help you locate the top and bottom of the market. This indicator finds Regular divergence for pul
The principle of this indicator is very simple: detecting the trend with Moving Average, Predicting BUY and SELL signals with arrows, alerts and notifications. The parameters are fixed and automatically calculated on M30 timeframe. You can trade with small timeframe or using Dash DIY Ai Robot, Dash Smart M30 Strategy for autotrading on any timeframe and any currency pairs. You can download template and the presets file for autotrading with Dash Smart M30 Strategy . Example: If you install indica

Top Trader Indicator
This is an arrow reversal indicator. This is with deviations and arrows. Trade a blue arrow for buy and trade a red arrow for sell. Change the time period and the deviations of the bands. This is similar to others but these arrows don't repaint. Load in back tester and study which periods and deviations work the best. It works on all time frames. 15 min to 1 hr would give good results for take profits. Try according to your own risk management.

Result look on https://t.me/BonosuProBinary Pair : All Forex Pairs Time Frame : M1 Expaired : 1-2 Minutes Trade Time Once Time a Day Backtester, Alert Avaliable Average Signals Generate 5 - 20 Signals All Pair A Day Broker Time Zone GMT+3 Default Setting [Example Broker GMT+3 : Alpari, FBS, XM] Support Broker : Deriv, IQOption, Alpari, Binomo, Olymtrade, Qoutex, GCoption, etc Support Auto Trading : MT2 Trading, Binary Bot, Intrade Bot, Binomo Bot, Olymptrad Bot, MX2 trading, Price Pro, etc Ind

Result look on https://t.me/BonosuProBinary Pair : All Forex Pairs Time Frame : M1 Expaired : 1-2 Minutes Trade Time Once Time a Day Backtester, Alert Avaliable Average Signals Generate 5 - 20 Signals All Pair A Day Broker Time Zone GMT+3 Default Setting [Example Broker GMT+3 : Alpari, FBS, XM] Support Broker : Deriv, IQOption, Alpari, Binomo, Olymtrade, Qoutex, GCoption, etc Support Auto Trading : MT2 Trading, Binary Bot, Intrade Bot, Binomo Bot, Olymptrad Bot, MX2 trading, Price Pro, etc Ind

Result look on https://t.me/BonosuProBinary Pair : All Forex Pairs Time Frame : M1 Expaired : 1-2 Minutes Trade Time Once Time a Day Backtester, Alert Avaliable Average Signals Generate 5 - 20 Signals All Pair A Day Broker Time Zone GMT+3 Default Setting [Example Broker GMT+3 : Alpari, FBS, XM] Support Broker : Deriv, IQOption, Alpari, Binomo, Olymtrade, Qoutex, GCoption, etc Support Auto Trading : MT2 Trading, Binary Bot, Intrade Bot, Binomo Bot, Olymptrad Bot, MX2 trading, Price Pro, etc Ind
The principle of this indicator is very simple: detecting the trend with Moving Average, Predicting BUY and SELL signals with arrows, alerts and notifications. The parameters are fixed and automatically calculated on M30 timeframe. You can trade with small timeframe or using Dash DIY Ai Robot, Dash Smart Boxing5 Strategy for autotrading on any timeframe and any currency pairs. You can download template and the presets file for autotrading with Dash Smart Boxing5 Strategy . Example: If you instal
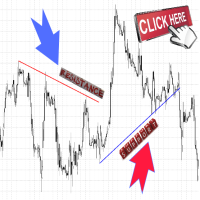
Готов продать исходный код, за подробностями обращайтесь в личные сообщения.
Индикатор чертит горизонтальные линии поддержки и сопротивления,наклонные линии поддержки и сопротивления,треугольники.Работает на любых инструментах и таймфреймах.
Данный индикатор можно использовать в торговле ориентируясь на отбой и пробой уровней, а так же для ориентиров выставления стоп лоссов.
Индикатор не удаляет уровни , они остаются на истории графика , что очень удобно для анализа его работы.
Для удобств

It will perfectly complement your working Expert Advisor or manual trading with up-to-date information.
There is a sound notification of exceeding the established profit and loss limits of open SELL and BUY orders.
Moreover, for each currency pair EURUSD, GBPUSD, XAUUSD, and others, various sound alerts are activated in English. Results are displayed on a special panel on the chart from the moment the indicator is activated: Elapsed time Fixed profit
Current profit SELL
Current profit BUY
Maximu
Индикатор Powerful trend indicator превосходно показывает текущую тенденцию. Индикатор Powerful trend indicator не перерисовывает не меняет свои значения. Советую пользоваться тремя периодами индикатора для фильтра сигналов. The Powerful trend indicator perfectly shows the current trend. The Powerful trend indicator does not redraw or change its values. I advise you to use three periods of the indicator to filter signals.

Odyssey is a global trend indicator. If you do not yet have your own trading strategy, you can use our ready-made trading strategy. This is a hybrid trend indicator, as it is based on the signals of several internal algorithms. The indicator also uses the oscillator algorithm in recalculations. The indicator also calculates the oversold and overbought levels of a trading instrument. Thus, having all the necessary information, the indicator generates signals when the trend changes.
Despite the

The intelligent algorithm of the Godfather indicator accurately determines the trend, filters out market noise and generates entry and exit levels. The indicator will help in finding entry points when analyzing the price chart. The program first receives a "snapshot" of the graph, then analyzes it. The results are reported to the trader in the form of signals. The main purpose of this indicator is to determine the moments of entries and exits from transactions, so the indicator displays only th

This strategy is best used for Scalping and Binary Options. Strategy: There are 3 EMAs: Faster, Medium and Slower. When Price is Trending, wait for Price to bounce an EMA and scalp at each bounce. Features: - Check if 3 MAs are Stacked - Check Price Bounce Off MAs (Faster, Medium, Slower) - Min Distance Between Faster and Medium MA Filter - Max Distance Between Entry Price and Faster MA Filter - High Volume Check - Heiken Trend Check - Volatility Check - Higher/Lower Timeframes MA Stacked check

Indicator that shows you at any time the current number of closed deals as well as profit and loss totals of the closed deals of the account that you're logged into for a configurable period.
To do this, it is best to load "Complete history" in the account history in the terminal and then enter the desired period in the indicator (e.g. 2022.01.01-2023.01.01 would be for calendar year 2022).
Input options:
- Period (Attention: corresponding data must be loaded into the account history of the

Индикатор превосходно показывает экстремумы цены. Для торговли по данному индикатору рекомендую торговать по сигналам старших таймфреймов. Индикатор не перерисовывается и не меняет значения в истории. The indicator perfectly shows price extremes. To trade on this indicator, I recommend trading on the signals of the higher timeframes. The indicator does not redraw and does not change the values in the history.
MetaTraderマーケットは、開発者がトレーディングアプリを販売するシンプルで便利なサイトです。
プロダクトを投稿するのをお手伝いし、マーケットのためにプロダクト記載を準備する方法を説明します。マーケットのすべてのアプリは暗号化によって守られ、購入者のコンピュータでしか動作しません。違法なコピーは不可能です。
取引の機会を逃しています。
- 無料取引アプリ
- 8千を超えるシグナルをコピー
- 金融ニュースで金融マーケットを探索
新規登録
ログイン