PivotTide

Pivot Tide — ウェーブのピボット、自動トレンドライン、ラインに基づくトレンド方向の判定

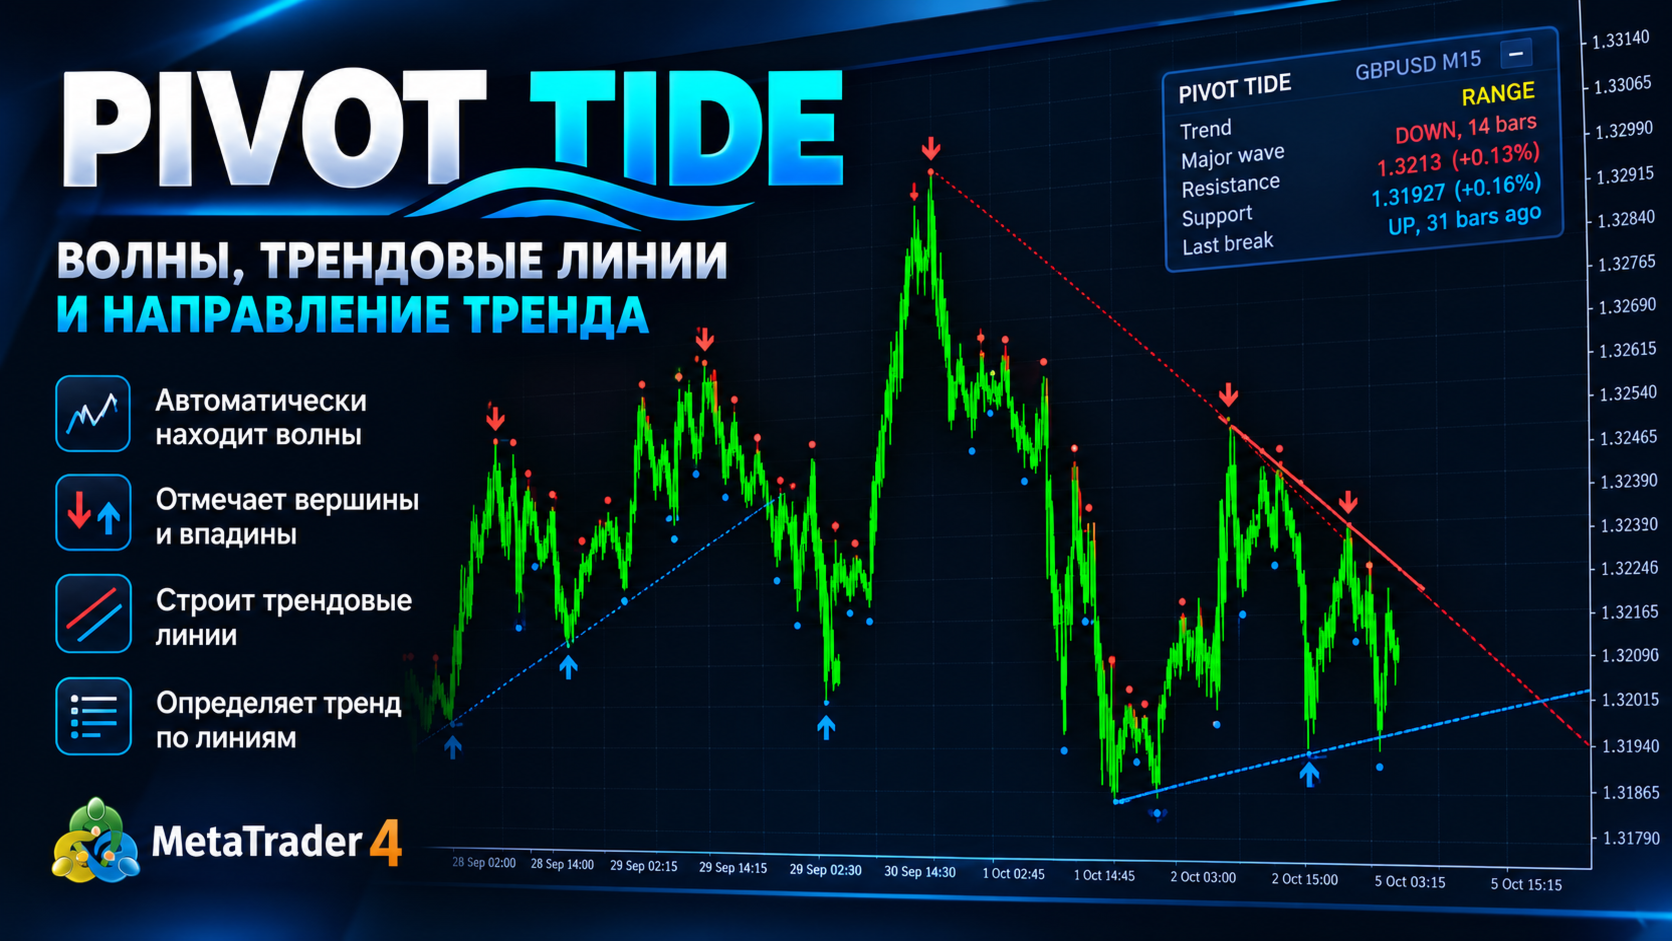
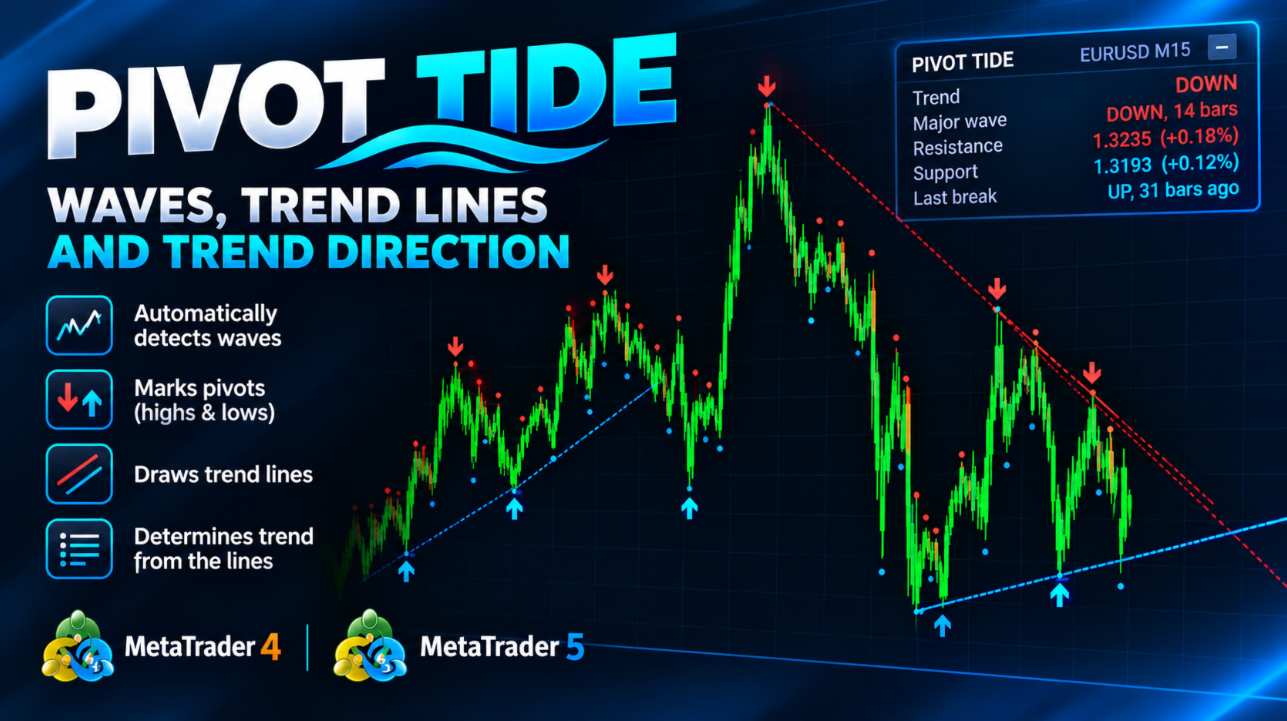
Pivot Tide は MetaTrader 4 用のインディケータです。チャートを自動的にウェーブに分割し、各ウェーブの高値と安値にマーカーを付け、それらを結んでトレンドラインを引き、ラインの状態からトレンドの方向を判定します。すべてチャート上に直接表示され、コンパクトな情報パネルも備えています。

あらゆる銘柄、あらゆる時間足で動作します。

MT5-version: https://www.mql5.com/en/market/product/199662

機能

  1. ウェーブを検出します。 ウェーブは 2 本の移動平均線の関係で定義されます。短期の SMA と長期の LWMA です。短期線が長期線の上にある間は上昇ウェーブ、下にある間は下降ウェーブです。
  2. ピボットをマークします。 ウェーブが終了すると(移動平均線が交差すると)、その極値にマーカーを置きます。上昇ウェーブの高値、または下降ウェーブの安値です。
  3. トレンドラインを引きます。 連続する同種のピボット 2 点を結びます。
  4. ラインのブレイクを監視します。 価格がラインの外側で終値を付けると、そのラインはブレイクされたものとみなされ、ブレイクしたローソク足で切られます。
  5. ラインからトレンドを判定し、パネルに表示します(UP、DOWN、RANGE)。

ウェーブは 2 つのレベルで計算されます。メジャー(大きなウェーブ、デフォルトの長さ 70)とマイナー(小さなウェーブ、デフォルトの長さ 21)です。

チャート上の表示

ピボットマーカー

  • ローソク足の上の赤い下向き矢印:メジャーなピーク(ローカルの高値)。
  • ローソク足の下の青い上向き矢印:メジャーなトラフ(ローカルの安値)。
  • 赤と青の小さなドット:マイナーウェーブの同様のピボット(非表示にできます)。

トレンドライン

  • レジスタンスライン(赤):直近 2 つのピークのうち、2 つ目が 1 つ目より低い場合に、その 2 点を通ります。
  • サポートライン(青):直近 2 つのトラフのうち、2 つ目が 1 つ目より高い場合に、その 2 点を通ります。
  • ブレイクされていないラインは右方向に延長されます。
  • ブレイクされたラインは、ブレイクしたローソク足で切られ、点線になります。こうしたラインは履歴としてチャートに残ります。
  • メインのラインはメジャーウェーブから作られます。マイナーウェーブのラインは個別に有効にできます(細い破線で表示されます)。

色(ピークとレジスタンスは赤、トラフとサポートは青)は設定で変更できます。

トレンドの判定方法

トレンドは、直近のピボットのペアから作られた 2 本の現在のライン(レジスタンスとサポート)から判定されます。

ラインの状態 パネルのトレンド
両方のラインが有効(価格が 2 本の間に挟まれている) RANGE:収束、持ち合い
サポートラインのみ有効 UP:上昇トレンド
レジスタンスラインのみ有効 DOWN:下降トレンド
有効なラインがない 最後のラインブレイクの方向

考え方はシンプルです。レジスタンスラインを上抜けるブレイクは買い手の強さを示し、サポートラインを下抜けるブレイクは売り手の強さを示します。

情報パネル

パネルには次の項目が表示されます。

  • Trend:現在のトレンド(UP、DOWN、RANGE)
  • Major wave:現在のメジャーウェーブの方向と、継続しているバーの本数
  • Resistance:現在のレジスタンスラインの価格と、そこまでの距離(パーセント)
  • Support:サポートラインについての同様の情報
  • Last break:最後のラインブレイクの方向と、何本前のバーで発生したか

パネルはマウスでドラッグでき(最上段をつかみます)、 - / + ボタンで最小化できます。位置と状態はチャートごとに記憶されます。デフォルトではチャートの上部中央に表示され、初期座標はパラメータで設定できます。パネルは完全に非表示にもできます。

パラメータ

パラメータ デフォルト 説明
MQL5.com account 作者のプロフィールへのリンク 情報表示用の欄で、インディケータの動作には影響しません
Major wave length 70 メジャーウェーブの長さ。大きいほどピボットが少なく、ウェーブが大きくなります
Minor wave length 21 マイナーウェーブの長さ。小さいほどマーカーが頻繁に出ます
Show minor pivots はい マイナーピボット(小さなドット)を表示します
Draw trend lines (major) はい メジャーウェーブに基づくラインを描画します
Draw trend lines for minor waves いいえ マイナーウェーブに基づくラインも追加で描画します
Lines kept per side 4 チャートに残すレジスタンスラインとサポートラインの直近の本数(それぞれ)
Extend unbroken lines to the right はい ブレイクされていないラインを右方向に延長します
Bullish color 青 トラフとサポートラインの色
Bearish color 赤 ピークとレジスタンスラインの色
Show info panel はい 情報パネルを表示します
Panel X -1 パネルの水平位置(ピクセル、-1 = 中央)
Panel Y 22 パネルの上端からの垂直位置(ピクセル、-1 = 中央)
Alert on trend change いいえ トレンドが変化したときにポップアップアラートを表示します
Push notification on trend change いいえ トレンドが変化したときにスマートフォンへプッシュ通知を送ります
Bars to analyze 1500 分析する過去のバーの本数(少ないほど高速)

使い方

  • 相場の背景を把握する。 パネルを確認します。UP と DOWN はラインに基づくトレンドの方向を示し、RANGE は収束してブレイクを待っている状態を示します。
  • ライン周辺で取引する。 有効なサポートラインやレジスタンスラインは、価格が反応しやすいゾーンです。ブレイク(ラインの外側での終値)は、価格の動きの変化を示すサインです。
  • ブレイクでのエントリー。 多くのトレーダーは、ローソク足がラインの外側で確定するのを待ち、その後、ブレイクしたラインへのリテストなどの確認を待ちます。
  • フィルターとして使う。 ラインに基づくトレンドを、ご自身のシステムのフィルターとして使えます。UP または DOWN の方向にのみ取引し、RANGE は見送ります。
  • 感度を調整する。 Major wave length と Minor wave length を小さくすると、ピボットは頻繁になりますが重要度は下がります。大きくすると、ウェーブは少なく大きくなります。銘柄と時間足に合わせて調整してください。
  • 上位の時間足のほうが、下位の時間足よりも信頼性の高いラインになります。
  • 通知。 Alert on trend change または Push notification on trend change を有効にすると、常にチャートを見続ける必要がなくなります。

ご注意

  • ピボットは移動平均線が交差した後にはじめて確定するため、実際の極値よりも遅れてマーカーが表示されます。これは、確定したマーカーが消えたり動いたりしないことの代償です。
  • このインディケータはそのまま使える売買シグナルを提供するものではなく、売買システムでもありません。相場の構造を分析するためのツールです。ご自身のエントリー、エグジット、リスク管理のルールと併せてご使用ください。
  • 計算は新しいバーごとに 1 回だけ行われるため、動作は軽量です。
  • 金融市場での取引には損失のリスクが伴います。

EA 向けのデータ(iCustom)

インディケータには 4 つのバッファがあります。

バッファ 内容
0 メジャーなピーク
1 メジャーなトラフ
2 マイナーなピーク
3 マイナーなトラフ

空の値は EMPTY_VALUE です。バッファに値が入るのは、ピボットがあるバーだけです。

作者のその他のプロダクト
インディケータは、最も可能性の高いトレンドストップ/反転エリア、自信のあるトレンド移動エリアを計算します。 計算では次のことが考慮されます。 価格変動率; チャートの相対偏差角度。 価格変動の平均振幅。 その「コンフォートゾーン」を離れる価格。 ATRインジケーターの値。 インジケーターは、価格がストップ/リバーサルエリアに入るとアラートを生成できます。 設定 全長を描きますか? -チャートの最後まで領域を描画します。 Show StopUP-trend-上昇トレンドのストップ/反転エリアを表示します。 上昇トレンドを表示-自信を持って上昇トレンドの領域を表示します。 下降トレンドを表示-自信を持って下降トレンドの領域を表示します。 Show StopDOWN-trend-下降トレンドのストップ/反転エリアを表示します。 エリア変更のアラート-価格がトレンドストップ/変更エリアに入ったときにアラートを生成します。 次は、各商圏の色設定です。
フラットとトレンドを決定するための指標。 価格が2つのヒストグラムと2つの線(赤と青)のいずれかを下回っている場合、これは売りゾーンです。 このバージョンのインジケーターを購入するときは、1つの実際のアカウントと1つのデモアカウント用のMT4バージョン-ギフトとして(受け取るには、プライベートメッセージを書いてください)! 価格が2つのヒストグラムと2つの線(赤と青)のいずれかを上回っている場合、これは購入ゾーンです。 MT4バージョン: https//www.mql5.com/en/market/product/3793 価格が2つの線の間、またはいずれかのヒストグラムのゾーンにある場合、市場に明確な傾向はありません。簡単に言えば、市場は横ばいです。 インジケーターの動作は、スクリーンショットでより明確に示されています。
SuperTrend
Evgeniy Zhdan
2.5 (2)
The Supertrend Expert Advisor The Supertrend Expert Advisor with averaging elements. It has been developed during three months until I finally got good results. It is not a scalper. The minimum balance to start trading - 100 $. Is automatically adjusted to the 4 and 5-digit prices. Has an efficient risk management system. The lot and limit on the maximum lot is automatically calculated based on the settings specified in the EA. As a result, you have a complete automated trading system. Download
StarDust searches for divergences in the values of several indicators considering them as signs of flat and enters the market if a relatively steady trend is detected. The Expert Advisor trades "basic" symbols with a low spread. The best results are achieved on М15. The EA automatically adjusts to 4 and 5-digit quote flows. Settings Comment_to_orders – comment to a placed order. The field can be left blank if no comment is required. MM – enable money management with automatic setting of a worki
The EA catches the price when it moves against the trend in an effort to open an order in an opposite direction (direction of the main trend). Screenshots illustrate examples of entries and the strategy gist. The EA uses stop losses depending on values of ATR. Settings: Lot_ - if Risk_ = 0, the EA will trade this lot; Risk_ - risk per one trade. Stop loss is taken into account; koeff_ATR - coefficient multiplied by the ATR value to calculate stop loss (the bigger the value, the bigger stop loss
The FastBoom EA finds the most probable points of price pullback/reverse and places an order. It places averaging orders if the price moves further against take profit. Settings of the EA: Lots - initial lot; LotExponent - multiplier for following orders (Martingale). 1 - no multiplier. TakeProfit - take profit in points; Stochastic Settings InpKPeriod - K Period of Stochastic InpDPeriod - D Period of Stochastic InpSlowing - Stochastic Slowing LevHigh - level for sell positions of Stochastic L
The Expert Advisor calculates the double/triple divergence of volumes, and starts trading. It uses a unique formula of lot calculation, which greatly improves stability of trading. Recommended TF - 1h. Currency pair - EURUSD , but the EA can be used on any trading instruments which are not subject to high volatility. Settings mode - trading direction can be set manually; close - order close level (details on the screenshot); Step between orders - step between orders in points; Maximum orders -
The Expert Advisor opens orders from the horizontal line, the a trader can set on any level by dragging using the mouse or by changing the line properties. For example, when a horizontal line is above the current price, the EA will open a Buy order once the horizontal line is reached. And vice versa: If the line is below the current price, the EA will open a sell order once the line is crossed. A buy crossover of the line is: opening of the current candlestick below the horizontal line; the curr
SellerATR
Evgeniy Zhdan
5 (1)
The Expert Advisor only sells. Recommended currency pairs : EURUSD; GBPUSD; USDCHF; USDJPY; USDCAD; AUDUSD; EURGBP; EURAUD; EURCHF; EURJPY; GBPCHF; CADJPY; GBPJPY; AUDNZD; AUDCAD; AUDCHF; AUDJPY; CHFJPY; EURNZD; EURCAD; CADCHF; NZDJPY; NZDUSD. Timeframe: H1. Percent% manages closing both loss-making and profitable deals based on the account overall status. Using the EA on 23 symbols mentioned above allows the robot to cope with the drawdown in case of a long trend. While positions on some pairs
Illusion
Evgeniy Zhdan
3 (2)
The Illusion EA uses the probability theory - after a series of consecutive virtual losses - i.e. right during a flat the EA already starts trading in the trend. In addition, the EA considers the ratio of bullish/bearish candles on the higher timeframes to determine the greatest probability of the price movement direction. Only 1 order can be opened at a time. In case of a loss the following order will be placed with an increased lot (the multiplication coefficient is set in the parameters). The
The indicator plots a trend line and determines the levels for opening trades, in case the price goes "too far" away from the trend level. More detailed information is available in the screenshots. Settings Away from the trend line - distance from the trend line to the trades level; Arrow Signal for deals - enable displaying an arrow when the price reaches the trades level; Size of Arrow - size of the arrow; Alert Signal for deals - enable generating alerts when the price reaches the trades lev
Turbina
Evgeniy Zhdan
5 (4)
The axiom of the Forex market is that any trend will be broken. The Expert Advisor determines trend direction (the pink line), and calculates levels for opening opposite orders depending on the settings. The value of Away from the trend line for Deal will be different for each pair and timeframe, depending on the volatility of the trading instrument. Next orders can be opened with an increased lot (a static lot is used by default). See the screenshots to understand the idea of the Expert Advisor
The Expert Advisor determines the moments of strong movements and opens a position in the direction of the most probable price movement. The strategy always uses stop loss and take profit. Several independent orders can be in the market (the maximum number is set in parameters). The goal of the EA's underlying trading system is the quantitative excess of the number of profitable deals over the number of losing ones. Recommended: EURUSD 5m; GBPUSD 5m; USDJPY 5m. The Expert Advisor is able to work
Vise is a trend indicator. The upper and lower lines follow the price showing the prevailing price direction. Frequent breakthroughs of the upper line indicate a bullish trend, while frequent breakthroughs of the lower line indicate a bearish one. Parameters Points for UpLine - initial number of points for the upper line; Points for DownLine - initial number of points for the lower line. During the breakthrough of the upper level (line), this level shifts upwards by Points for UpLine. If the up
Twinkle is a trend-based scalper using stop loss and take profit invisible to the broker. The EA does not look for trend reversals. The EA catches strong market movements and opens orders in the direction of the trend. Your broker will not see the order closing levels. The EA closes orders independently when reaching the take profit or stop loss levels specified in the settings. Recommended trading symbols: EURUSD M5, GBPUSD M5. ECN accounts with 5 digits quotes are recommended. Expert Advisor
Shine
Evgeniy Zhdan
4.75 (4)
This Expert Advisor implements elements of the Martingale system. Orders are opened at a specified distance from the moving average. The Parabolic SAR indicator and certain technical details are used to ensure the most accurate entries. The EA is highly customizable. It is recommended for simultaneous use on 4 currency pairs: EURUSD M15; GBPUSD M15; USDJPY M15; USDCAD M15. Despite good stability, it is advisable to disable the EA operation during the days rich in news releases. Configurations P
LuckyCase is an Expert Advisor with martingale elements. The EA strategy is based on a significant "deviation" of the price from SAR inadicator and the Bands levels breakthrough point. The money management system is an essential part of the EA. It starts working after a trade is opened. Trades are closed after accumulating specified points of market orders, by deposit % or after an opposite side of the channel is broken through. The default EA settings are meant for: EURUSD M15; USDJPY M15. The
The Elize Expert Advisor has been designed to work with the EURCHF currency pair. It considers the peculiarities of this trading instrument, its behavior and dependence on the behavior of other currencies. In particular, when the currencies of the European countries (EURUSD, GBPUSD, EURNOK, EURCHF) move in the same direction, the EA starts its operation and opens a deal in the trend direction of the European currencies. In the event of price rollbacks, the EA uses a unique method for making the
Brief Description of the All Trend Lines Indicator The indicator analyzes the wave structure of the market. What it displays on the chart: First. Wave pivots (semaphores) • Red markers – wave highs • Yellow markers – wave lows • Yellow-green markers – additional local extremes Second. Trend lines • Purple/blue lines – trends based on highs (resistance/support) • Beige/green lines – trends based on lows • Lines are built automatically by connecting wave pivots of the same type Third. Main trend
The Expert Advisor has been specifically developed for trading gold (Spot Gold). The strategy is based on Fibo levels calculated from the previous (first) candle High/Low and the width of the current and lower timeframes channel. If important Fibo levels of different orders are located in a single price channel (within a spread), the EA defines this channel as the target for price movement and starts operation. Martingale and averaging are not used. Each order is independent and is accompanied b
The algorithm of this Expert Advisor determines the significant price levels, where the trend often turns into a flat or reverses. Stochastic Oscillator serves as an additional filter of overbought/oversold zones. The EA sets stop loss and take profit after opening an order. The underlying trailing strategy applies a trailing stop. The EA is recommended for simultaneously use on three trading instruments: EURUSD M5, GBPUSD M5, EURCHF M5. Settings: Comment to order - comment to orders. MaxRisk -
The Expert Advisor looks for technical analysis patterns formed on the higher (hourly) timeframe to start working on the 5-minute chart. Technical analysis patterns used: double top/double bottom, head/shoulders, flag, expanding/narrowing triangles. The Relative Vigor Index technical indicator is used as the filter for opening deals. It is based on the idea that on the bull market the closing price is, as a rule, higher, than the opening price. It is the other way round on the bear market. This
The Expert Advisor calculates the divergence on the current and higher timeframes. In case the divergences coincide, the EA starts its operation. Deals have strict take profit and stop loss levels. Each deal is managed by trailing stop. The strategy involves the use of a tight stop-loss. Therefore, losing deals and/or series of losing deals are not uncommon. This EA is not suitable for those who have difficulties coping with losing deals. The EA is recommended for simultaneous use on the followi
The Expert Advisor has been developed specifically for the features of the CHFJPY currency pair. The EA's algorithm determines the direction of the current trend and starts operation. In case of a price reversal within the current trend, the EA adds additional orders. If trend changes, the EA starts to work in the direction contrary to the initial grid of orders. If there were no conditions for closing orders and the trend direction changed again, the EA continues to work with the "first" grid o
The Expert Advisor algorithm determines on daily charts those candlestick patterns, which set the intraday trading direction. The trading EA determines how long the price is moving in overbought/oversold zones and starts working in the direction of the expected trend movement. Each position is accompanied with a tight stop loss and take profit. Only one active position can be open in the market. The EA was developed and tested using 99% quality quotes. The Expert Advisor has a built-in news filt
The strategy of this Expert Advisor is based on a hedging system, which implies placing opposite orders. The EA algorithm determines trend beginning and opens a position in the trend direction. In case of a wrong entry, the EA tries to neutralize the drawdown through opposite (hedging) orders at a preset interval (Coefficient of counter orders). Orders are closed when one of the two values ​​is reached - profit in percent or profit in points. The EA does not use lot increase. The EA wast tested
Советник работает по принципу хеджирования с периодическими "перекосами" в сторону трендовых направлений. Направления тренда советник определяет на основании стандартного индикатора Parabolic Stop and Reverse system (SAR). Уникальная стратегия установки балансирующих позиций позволяет избегать больших просадок даже при самых не благоприятных рыночных условиях. Параметры по умолчанию рекомендуется использовать на торговом инструменте: GBPJPY 15m. Разработка и оптимизация параметров производились
Snoot
Evgeniy Zhdan
5 (1)
This Expert Advisor works using a grid in the direction of a trend movement with the step between opened positions defined in the settings. The positions are closed by the total take profit. The Parabolic SAR standard indicator is used to filter order opening, which comes in the MetaTrader 4 package. The EA has been developed and tested using 99,9% quality of quotes. Operation of the EA in real time can be viewed in the signals . The best trading results have been achieved on CHFJPY M15. Settin
The Expert Advisor builds channels based on the data obtained using ATR and MA indicators according to the equations: Upper channel border = MA + ATR * (FIBO); Lower channel border = MA - ATR * (FIBO), where FIBO has the following values: Style of Trade - Aggressive = 1.61852; Style of Trade - Average = 3.26704; Style of Trade - Calm = 4.85556. Trades are opened inside the channel with the intervals defined in the settings. Long and short positions are opened independently. Positions are closed
The trading statistics indicator notifies the trader of the aggregate income of the trading account for different time intervals. The indicator has wide display settings on the graph. There is a choice of one of the two display languages on the chart- English and Russian. Settings Indicator language (ENG, RUS) - Select the language to display on the chart; To control the magic (-1: any magic) - Entering the Magic for control (-1: any Magic); Angle of indicator tie - Selecting the angle of the c
フィルタ:
レビューなし
レビューに返信