Gold Signal Pro XAUUSD with Auto TP SL
- インディケータ
- バージョン: 7.21
- アップデート済み: 25 6月 2026
- アクティベーション: 5

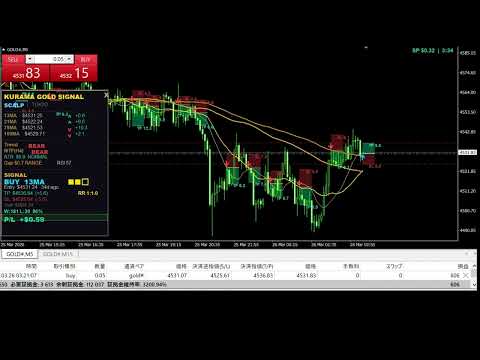
KURAMA GOLD SIGNAL PRO(MT4版)— 7層フィルター・自動TP/SL・品質スコア・サイン履歴保存搭載 XAUUSD完全トレードシステム
リアルタイムでリペイントしません。サインが出た瞬間、矢印・エントリー・TP・SLはその場で固定され、後から動きません。あなたがトレードするのは、この「リアルタイムで出たサイン」です。さらにv7.20では、実際に通知されたサインを自動保存し、再起動後もそのまま復元します。
━━━━━━━━━━━━━━━━
購入者限定特典
━━━━━━━━━━━━━━━━
買い切りライセンスをご購入いただいた方に、AI Zone Radar($59相当)+完全PDFマニュアルを無料プレゼント。本体価格に$59相当の特典が付いてきます。購入後にMQL5でメッセージをお送りください。
AI Zone Radar: https://www.mql5.com/en/market/product/175834
ゴールドトレーダーのコミュニティで実際に使用され、精度と使いやすさで高く評価されています。
━━━━━━━━━━━━━━━━━━━━
あなたの問題 — そしてその解決策
━━━━━━━━━━━━━━━━━━━━
ゴールドは1日$30〜$50動く。チャンスがあるのは分かっている。でもこういう経験はないか:
- エントリーが早すぎて、$10逆行してから思った方向に動く
- MAタッチのたびに入って、半分は負ける
- TP/SLの基準がないから、持ちすぎるか早すぎる決済をする
- 動かない時間帯にトレードして、なぜ上手くいかないのか悩む
KURAMA GOLD SIGNAL PROは、これらすべてを解決するために作られた。1つのフィルターではなく、7つのフィルターで。
━━━━━━━━━━━━━━━━━━━━
使い方 — 3ステップ
━━━━━━━━━━━━━━━━━━━━
1. チャートに矢印サインが表示される
2. パネルでTP価格、SL価格、品質スコア、リスクリワード比を確認
3. 注文を入れて待つ
推測不要。複雑な分析不要。矢印に従い、数字で管理する。
━━━━━━━━━━━━━━━━━━━━
エントリーだけじゃない — 決済計画も完全表示
━━━━━━━━━━━━━━━━━━━━
ほとんどのインジケーターはエントリーだけ教えて、あとは放置。
このインジケーターはサイン発生時にすべてを表示する:
- 矢印:エントリー方向と価格
- 緑ゾーン:利確目標と正確な価格
- 赤ゾーン:損切りレベルと正確な価格
- パネル:TP、SL、リスクリワード比、品質スコアを数値で表示
表示された数字をそのまま注文に入力するだけ。計算不要。
━━━━━━━━━━━━━━━━━━━━
7つの独立フィルター — 本当のエッジ
━━━━━━━━━━━━━━━━━━━━
サインが表示される前に、相場は7つのフィルターを同時に通過する必要がある:
フィルター1 — ボラティリティ異常検知:ATRスパイクとデッドマーケットでサインをブロック。
フィルター2 — MA構造チェック:SMA 13/21/75/100の配列を検証。
フィルター3 — トレンド方向フィルター:MAの傾きと価格位置の複合判定。
フィルター4 — MA角度フィルター:実際のMA角度を計測。フラットなMA=サインなし。レンジ相場の損失を排除。
フィルター5 — 上位足フィルター(H4):M5/M15エントリー前にH4トレンドを確認。
フィルター6 — RSIフィルター:買われすぎ/売られすぎの極端な位置でのエントリーをブロック。
フィルター7 — 貫通ブロック:本物の押し目とブレイクアウトを区別。
フィルター未通過 = サインなし = トレードしない。市場のXAUUSDインジの多くは1〜2個のフィルター。これは7つ。
━━━━━━━━━━━━━━━━━━━━
3段階フィルターレベル
━━━━━━━━━━━━━━━━━━━━
SAFE [S] — 最大フィルタリング。ファーストタッチフィルターON。サイン最少、精度最高。
STANDARD(デフォルト) — バランスモード。品質と頻度の最適バランス。推奨。
ACTIVE [A] — フィルター緩和。サイン増加。低スプレッド口座専用。品質スコアで手動フィルタリング推奨。
パラメータからワンクリックで切替。TP/SL計算はどのレベルでも同一。
━━━━━━━━━━━━━━━━━━━━
すべてのサインに品質スコア
━━━━━━━━━━━━━━━━━━━━
★★★ — すべての条件完璧。強いセットアップ。TP広め。
★★ — 堅実なセットアップ。標準TP/SL。メインのトレード。
★ — 条件不確実。TP/SL狭め。ロット縮小または見送り推奨。
スコアを通じてリスク管理が自動で行われる。
【v7.20 NEW】さらにパネルには★別の勝敗集計が表示されます。どの品質スコアのサインが今の相場で機能しているか、自分の目で確認できます。
━━━━━━━━━━━━━━━━━━━━
【v7.20 NEW】根拠タグ — なぜこのサインが出たのか
━━━━━━━━━━━━━━━━━━━━
すべてのサインに、発生根拠がタグで表示されます。ブラックボックスではありません。
FT — ファーストタッチ(そのMAへの初回タッチ)
RT — リタッチ(2回目以降)
TREND — トレンド方向と一致
H4 — 上位足(H4)の方向と一致
PO — パーフェクトオーダー成立中
VOL — ボラティリティが健全な範囲
タグが多いほど複数の根拠が重なったサイン。品質スコアとあわせて、自信を持ってエントリー判断ができます。タグはスマホへのプッシュ通知にも表示されるので、チャートを見なくても根拠が分かります。
━━━━━━━━━━━━━━━━━━━━
動的TP/SL — 毎回市場に適応
━━━━━━━━━━━━━━━━━━━━
固定TP/SLは相場が毎日変わるため機能しない。このインジは以下に基づいて毎回新規計算:
- どのMAにタッチしたか
- 品質スコア
- 現在のボラティリティ
- サイン連続回数
今の相場に合ったTP/SLが出る。
━━━━━━━━━━━━━━━━━━━━
4本のMA — 4種類のトレード
━━━━━━━━━━━━━━━━━━━━
13MA — 浅い押し目。クイックスキャル。狭いTP/SL。完璧な並び順のみ。
21MA — 標準的な押し目。最も多いサイン。バランスの取れたTP/SL。
75MA — 深い押し目。広いTP/SL。
100MA — 最も深い押し目。主要サポレジ。広いTP/SL。
パネルがどのMAがトリガーされたか教えてくれる。
━━━━━━━━━━━━━━━━━━━━
完全パネル — 必要な情報がすべて一画面に
━━━━━━━━━━━━━━━━━━━━
- 4本のMA値・傾き・価格からの距離
- フィルターレベル:[S]、[A]、または空欄
- トレンド:Strong Bull / Bull / Range / Bear / Strong Bear
- H4上位足コンテキスト
- ATR(Normal/Spike/Lowステータス付き)
- RSI値
- ENTRY ENV:現在のエントリー環境を総合判定(GOOD/CAUTION/NG)
- 現在のサイン:方向、MAタイプ、品質、根拠タグ、TP、SL、リスクリワード比
- 21MAでのトレーリングSL参照値
- ★別の勝敗カウンター
- スプレッドモニター:緑/黄/赤
- ローソク足カウントダウンタイマー
━━━━━━━━━━━━━━━━━━━━
【v7.20 NEW】サイン履歴の自動保存・復元
━━━━━━━━━━━━━━━━━━━━
これまで多くのサインインジの不満は「再起動するとサインが消える」ことでした。v7.20で解決。
- 発生したすべてのサインを自動でファイルに記録
- MT4の再起動、チャート再読み込み、インジ再適用の後も、矢印・TP/SL・ゾーンを自動復元
- 復元されるのは「実際に通知されたサイン」そのもの
- VPS移転やPC変更の際も、履歴ファイルをコピーすれば引き継ぎ可能
過去のサインが残るから、自分の目で実績を検証できます。隠れた結果はありません。
さらにv7.20では、チャート再読み込み時に同じサインが重複通知される現象も解消。新しいサインだけが通知されます。
━━━━━━━━━━━━━━━━━━━━
スクロールして検証
━━━━━━━━━━━━━━━━━━━━
すべての過去サインがTP/SLゾーンと一緒にチャート上に残る。緑ゾーン到達=TPヒット。赤ゾーン到達=SLヒット。隠れた結果なし。自分で確認できる。
━━━━━━━━━━━━━━━━━━━━
2つのモード
━━━━━━━━━━━━━━━━━━━━
SCALP M5 — 高速。狭いTP/SL。トレンドセッション中のアクティブトレード。
DAY M15 — 大きなターゲット。厳しいフィルター。サイン少ないが高品質。
最強のセットアップ:両方を並べて表示。M15で方向確認。M5でタイミング。
━━━━━━━━━━━━━━━━━━━━
アラート
━━━━━━━━━━━━━━━━━━━━
PCでサウンドアラート。MT4モバイルにプッシュ通知。メールも設定可能。高品質サインには専用サウンド。プッシュ通知には根拠タグも表示。
━━━━━━━━━━━━━━━━━━━━
ゴールド専用。ゴールドだけ。
━━━━━━━━━━━━━━━━━━━━
すべてのフィルター、閾値、TP/SL計算がXAUUSD専用にゼロから設計。セッションパターン、ATRスパイク、指標発表前の動き — すべて考慮済み。
FXインジにゴールド設定を入れたものではない。ゴールド専用インジケーター。
━━━━━━━━━━━━━━━━━━━━
セッション自動検出
━━━━━━━━━━━━━━━━━━━━
シドニー、東京、ロンドン、ニューヨーク — ブローカーのサーバー時間に関係なく自動検出。
━━━━━━━━━━━━━━━━━━━━
スプレッドモニター
━━━━━━━━━━━━━━━━━━━━
緑 = GO。黄 = 注意。赤 = 待機。常にチャート上に表示。
━━━━━━━━━━━━━━━━━━━━
リアルタイムでリペイントしません — そして再計算について正直にお伝えします
━━━━━━━━━━━━━━━━━━━━
【リアルタイムの動作】
確定足に一度表示されたサインは、その足の中で消えたり位置が変わったりしません。矢印・エントリー・TP・SLは表示された瞬間に固定され、後から動きません。あなたが実際にトレードするのは、この「リアルタイムで出たサイン」です。ここにラグもリドローもありません。
【再計算について — 隠さずお伝えします】
インジを再適用・再起動・時間足切替すると、過去バーは内部状態(クールダウン等)をゼロから再計算します。このとき、過去の「参考矢印」の出方がわずかに変わることがあります。これはリペイントではなく、内部状態を持つインジに共通する再計算挙動で、プラットフォームを問わず標準的なものです。重要なのは、これがリアルタイムのトレード結果に一切影響しないことです。あなたはサインが出た瞬間にトレードするのであって、過去バーの再描画でエントリー・TP・SL・損益が変わることはありません。
そしてv7.20では、実際に通知されたサインを自動でファイルに保存し、再起動後も同じ位置に復元します。通知済みのサイン履歴は書き換わりません。
【実際のユーザーの声】
この点について、購入者のVioletteさんはレビューでこう書いています(MQL5レビューより):
「リフレッシュ後に履歴が変わったとしても、それは全く問題ではありません。私は2週間ずっと利益を出し続けているのですから。おすすめします。」
リアルタイムでトレードしている実ユーザーにとって、再計算は実用上の問題にならない — これが現場の評価です。
━━━━━━━━━━━━━━━━━━━━
トレーリングSL
━━━━━━━━━━━━━━━━━━━━
パネルが21MAベースのTrail値を表示。SLを移動して利益を確保。手動執行。
━━━━━━━━━━━━━━━━━━━━
より良い結果のための3つのルール
━━━━━━━━━━━━━━━━━━━━
1. M5とM15の方向が一致する時だけトレード
2. ★★と★★★に集中。★はスキップまたは最小ロット
3. トレンドがRangeの時はスキップ。トレンドなし=エッジなし
━━━━━━━━━━━━━━━━━━━━
このインジケーターの背景 — 12年の経験
━━━━━━━━━━━━━━━━━━━━
売るために作ったのではない。自分に必要だから作った。12年間ゴールドだけをトレード。2回の口座破綻。すべてのフィルター閾値は実際の資金で検証済み。
毎日自分のトレードで使っている。今度はあなたが使う番。
━━━━━━━━━━━━━━━━━━━━
仕様
━━━━━━━━━━━━━━━━━━━━
プラットフォーム:MetaTrader 4
銘柄:XAUUSDのみ
時間足:M5およびM15
推奨スプレッド:$1.0以下
━━━━━━━━━━━━━━━━━━━━
よくある質問
━━━━━━━━━━━━━━━━━━━━
Q: FX通貨ペアに使える? — いいえ。XAUUSDのみ。
Q: M30やH1で使える? — いいえ。M5とM15のみ。スイングをご希望ならGold Signal Swing Pro(M30/H1/H4)をご覧ください。
Q: パラメータの調整は必要? — デフォルトが最適化済み。フィルターレベルのみ変更可能。
Q: サインが出ない? — フィルターが正常に機能している。適切なセットアップを待つ。
Q: リペイントする? — リアルタイムではしません。出たサインのエントリー・TP・SLはその場で固定。再適用や再起動をすると過去バーの参考矢印は再計算されますが、これはトレード結果に影響しません。通知済みサインはv7.20で保存・復元されます。
Q: 再起動するとサインは消える? — いいえ。v7.20から自動保存・復元されます。
Q: マニュアルは? — あり。購入後にメッセージをいただければ、PDFマニュアルとAI Zone Radar特典をお渡しします。
━━━━━━━━━━━━━━━━━━━━
買い切りライセンス購入者特典
━━━━━━━━━━━━━━━━━━━━
買い切りライセンスをご購入いただいた方に以下を無料で提供:
- AI Zone Radar($59相当):5層強度スコアリング搭載の自動サポート&レジスタンス検出インジケーター
- 完全PDFマニュアル:設定方法とトレードルールの完全ガイド
レンタルは対象外です。購入後にMQL5で直接メッセージをお送りください。両方をお渡しします。
AI Zone Radar: https://www.mql5.com/en/market/product/175834
━━━━━━━━━━━━━━━━━━━━
ラインナップ
━━━━━━━━━━━━━━━━━━━━
MT5版もご用意しています:https://www.mql5.com/ja/market/product/170916
M30/H1/H4スイング版もあります — M5/M15では取りきれない大きな波を狙いたい方へ。Gold Signal Swing Pro(M30/H1/H4対応)。1トレードで$20〜$80+の値幅を狙う。
https://www.mql5.com/en/market/product/177643
━━━━━━━━━━━━━━━━━━━━
レビュー
━━━━━━━━━━━━━━━━━━━━
このインジケーターが役に立ったと感じたら、ぜひレビューをお書きください。あなたのフィードバックが他のトレーダーの判断材料になります。
━━━━━━━━━━━━━━━━━━━━
リスク開示
━━━━━━━━━━━━━━━━━━━━
意思決定支援ツールであり、投資助言ではありません。過去の実績は将来の結果を保証しません。XAUUSDはボラティリティが高く、大きな損失が発生する可能性があります。失っても問題ない資金でのみトレードしてください。低スプレッド環境を強く推奨します。


Sniper entrance,High profit exit...Thank you...