YouTubeにあるマーケットチュートリアルビデオをご覧ください
ロボットや指標を購入する
仮想ホスティングで
EAを実行
EAを実行
ロボットや指標を購入前にテストする
マーケットで収入を得る
販売のためにプロダクトをプレゼンテーションする方法
MetaTrader 4のためのテクニカル指標 - 7
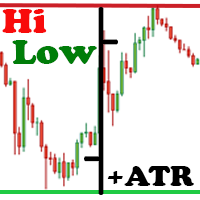
The Hi Low Last Day ( Hi Lo Last Day ) indicator shows the high and low of the last trading day and the second trading day, as well as the minimum and maximum of last week . There are many trading strategies on the daily levels. This indicator is indispensable when using such trading strategies. In fact, everything is simple in trading, you just need to understand and accept it for yourself. There is only price!!! What is price? This is the level on the chart. The level is the price that the

This indicator is another variant of the famous powerful indicator Fibonacci-SS https://www.mql5.com/en/market/product/10136 but has different behaviour in placing Pending Order and TP Line. Automatically places Fibonacci retracement lines from the last highest and lowest visible bars on the chart with: An auto Pending Order (Buy/Sell). Taking Profit 1, Taking Profit 2 is pivot point and Taking Profit 3 for extended reward opportunity. The best risk and reward ratio.
Simple and powerful indicat
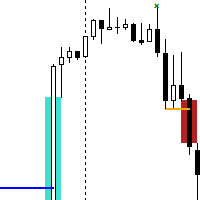
The Break of Structure (BoS) and Change of Character indicator with Fair Value Gap (FVG) filter is a specialized tool designed to enhance trading strategies by pinpointing high-probability trading opportunities on price charts. By integrating the BoS and Change of Character concepts with the FVG formation, this indicator provides traders with a robust filtering mechanism to identify optimal entry and exit points. The indicator identifies instances where the structure of price movements is disrup
FREE
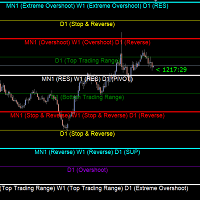
Gold Levels MTF - this is a fine stock technical indicator. The indicator algorithm analyzes the movement of the asset price, displays price levels of support and resistance from all time frames (TF) using the Murray method based on the Gann theory. The indicator indicates overbought and oversold fields, giving an idea of possible reversal points and at the same time giving some idea of the strength of the current trend. Description of levels: (Extreme Overshoot) - these levels are the ultimat
FREE
Hi Trader, ================================================================================ If you like my indicator, please do not hesitate to give a review and/or comment. Thank you! ================================================================================
This indicator draws trade entry zone and target levels based on the levels of the previous day.
A blue zone (BUY) or red zone (SELL) is drawn and two targets. The optimal trade entry value is also indicated.
A second gray zone is
FREE

"Wouldn't we all love to reliably know when a stock is starting to trend, and when it is in flat territory? An indicator that would somehow tell you to ignore the head fakes and shakeouts, and focus only on the move that counts?" The Choppiness Index is a non-directional indicator designed to determine if the market is choppy (trading sideways) or not choppy (trading within a trend in either direction). It is an oscillating indicator between -50 (very trendy) and +50 (very choppy). There are man

无重绘、无滞后。 修正趋势步长 (CTS) 是由 A. Uhl 设计的一种快速自适应移动平均线,旨在作为交易中的响应指标,通常与速度较慢的修正移动平均线 (CMA) 结合使用,构建交叉系统。它能够适应市场波动,从而减少横盘整理或区间震荡行情中的虚假信号。
修正趋势步长的关键特性包括:
目的:旨在通过调整以适应当前价格走势,从而改进传统的移动平均线。
方法:基于指数平均,它最大限度地减少了传统平均线在非趋势市场中产生虚假交叉的问题。
功能:它被设计为完整交叉系统中的“快速”自适应组件。 • 更贴近价格 • 更适合作为 快线 • 在趋势中反应迅速 • 在震荡中自动“钝化” InpLength (14) : 计算方差的周期,默认100。与 CMA 配合使用时常用相同周期或更短周期 InpMult (1.0) : 乘数,通常保持1.0 InpPrice (PRICE_CLOSE) : 应用价格类型,可选择收盘价、开盘价、高低点等

MT4マルチタイムフレームオーダーブロック検出インジケーター。
特徴
-チャートコントロールパネルで完全にカスタマイズ可能で、完全な相互作用を提供します。
-必要な場所でコントロールパネルを表示および非表示にします。
-複数の時間枠でOBを検出します。
-表示するOBの数量を選択します。
-さまざまなOBユーザーインターフェイス。
-OBのさまざまなフィルター。
-OB近接アラート。
-ADRの高線と低線。
-通知サービス(画面アラート|プッシュ通知)。
概要
注文ブロックは、金融機関や銀行からの注文収集を示す市場行動です。著名な金融機関と中央銀行が外国為替市場を牽引しています。したがって、トレーダーは市場で何をしているのかを知る必要があります。市場が注文ブロックを構築するとき、それは投資決定のほとんどが行われる範囲のように動きます。
注文の構築が完了すると、市場は上向きと下向きの両方に向かって急激に動きます。注文ブロック取引戦略の重要な用語は、機関投資家が行っていることを含むことです。それらは主要な価格ドライバーであるため、機関投資家の取引を含むあらゆる戦

Volumatic Fair Value Gaps is a precision-engineered indicator for identifying, analyzing, and visualizing Fair Value Gaps (FVGs) backed by volume intelligence. This tool goes beyond standard FVG plotting by dissecting volume dynamics inside each gap using lower-timeframe sampling , offering clear insight into whether bulls or bears dominate the imbalance. Designed for technical traders, this indicator overlays high-probability gaps only, visualizes bullish vs. bearish volume compositio

enom Trend Pro — マルチタイムフレーム対応トレンド分析ツール Venom Trend Pro は、あらゆる通貨ペアと時間足において明確な方向性の動きを特定するために設計された、トレンドフォローおよびスイングトレード用インジケーターです。FX、ゴールド、仮想通貨、指数などのデイトレードやスイングトレードに適しています。 このインジケーターは、直近の価格構造とモメンタムを分析して、新たなトレンドまたは継続中のトレンドを検出します。トレンドが確認されると、シグナルはローソク足の確定後も再描画されることはありません。 主な特徴: すべての時間足に対応(M1〜MN) 一度確定したシグナルは再描画されない安定性 対応資産:FX、メタル、仮想通貨、指数など トレンドエントリーとエグジットの両方に対応 チャートを見やすくするミニマルな表示 Venom Trend Pro は、ノイズの少ない構造化されたマーケット判断を提供します。
明確な視覚的シグナルを求める、落ち着いたルールベースのトレードスタイルに最適です。
FREE
Welcome to enhanced pattern detection with the Double Top and Bottom Pattern Scanner ! Transform your trading approach with this powerful MT4 indicator designed for efficient pattern scanning and actionable alerts. Key Features: Advanced Zig Zag Pattern Detection : The Double Top and Bottom Pattern Scanner uses the zig zag pattern to detect tops and bottoms. It identifies points where the price bounces back twice from the same level after a long trend, signaling potential market reversals. Real

Consolidation Zone Indicator is a powerful tool designed for traders to identify and capitalize on consolidation patterns in the market. This innovative indicator detects consolidation areas and provides timely alerts when the price breaks above or below these zones, enabling traders to make informed trading decisions. MT5 Version : https://www.mql5.com/en/market/product/118748 Join To Learn Market Depth - https://www.mql5.com/en/channels/suvashishfx
Key Features:
1. Consolidation Detecti
FREE

これは無料でご利用いただける製品です。お客様のニーズに合わせてご利用ください。
また、肯定的なフィードバックをいただければ幸いです。どうもありがとうございます。
高品質のトレーディングロボットとインジケーターをご覧になるにはここをクリックしてください!
Crypto_Forex インジケーター: MT4 用 Heiken Ashi Candles。再描画なし。 - Heiken_Ashi_Candles は、画像にあるように、トレンドライン MA インジケーターとの組み合わせが優れています。 - インジケーター Heiken_Ashi_Candles は、トレンドをより目立たせるための非常に便利な補助インジケーターです。 - ローソク足チャートをより読みやすくし、トレンドを分析しやすくするのに役立ちます。 - 利益のほとんどは、市場がトレンドのときに発生するため、トレンドを正しく予測する必要があります。 - 平均足チャートは、各バーを計算するための式が異なることを除いて、通常のローソク足チャートと同様に構築されています - 平均足は、基本的に動きの平均を取っているため、より滑ら
FREE

Renko Charts with Heiken Ashi Filter now have the alerts and the Win-rate . Now you can know which signal will give you that edge your trading needs. Risk to Reward Settings Wins versus Losses Count There are four alert types to choose from for notification on screen, email or phone notification. The alert types also have buffers for use with automation. This indicator can be incorporated with any system that requires renko charts. The four (4) alert types are: Three-bar Formation ; Pinbar

ご紹介 Quantum Breakout PRO は 、ブレイクアウト ゾーンの取引方法を変革する画期的な MQL5 インジケーターです。 13年以上の取引経験を持つ経験豊富なトレーダーのチームによって開発された Quantum Breakout PROは 、革新的でダイナミックなブレイクアウトゾーン戦略により、あなたの取引の旅を新たな高みに押し上げるように設計されています。
クォンタム ブレイクアウト インジケーターは、5 つの利益ターゲット ゾーンを備えたブレイクアウト ゾーン上のシグナル矢印と、ブレイクアウト ボックスに基づいたストップロスの提案を提供します。
初心者トレーダーにもプロのトレーダーにも適しています。
量子EAチャネル: ここをクリック MT5バージョン: ここをクリック 重要!購入後、インストールマニュアルを受け取るためにプライベートメッセージを送ってください。 推奨事項:
時間枠: M15 通貨ペア: GBPJPY、EURJPY、USDJPY、NZDUSD、XAUUSD アカウントの種類: ECN、Raw、またはスプレッドが非
このインジケーターは、チャート上に需要と供給のゾーンを描画します。独自のルールやテクニックと組み合わせることで、このインジケーターを使用して独自の強力なシステムを作成 (または強化) できます。さらに多くの機能を提供する 有料版 もぜひご確認ください。私の推奨は、少なくとも 25 バー後に最初のゾーン テストが発生する取引機会を探すことです。 特徴 ゾーンには 3 つの色があります (入力によって調整可能)。テストされていないゾーンは暗い色、テスト済みのゾーンは中くらいの色 、壊れたゾーンは明るい色です 。 各ゾーンにはゾーン外枠の価格とゾーンテストの金額が記載されています。 入力パラメータ 最初の極値を検索するための最大バックバー数 - デフォルトは 3000 です。最初の極値を xx バー分遡って検索します。値が大きいほど、より多くのシステム リソースが必要になります 。遅いコンピューターの場合は、500 ~ 1000 の値が適している場合があります。 ゾーンテスト間のキャンドルの最小数 未テストの需要色 テスト済みの需要色 壊れた需要の色 未テスト供給色 テスト済みの供給
FREE

価格波形パターン MT4へようこそ --(ABCD パターン)-- ABCD パターンは、テクニカル分析の世界で強力で広く使用されている取引パターンです。
これは、トレーダーが市場での潜在的な売買機会を特定するために使用する調和的な価格パターンです。
ABCD パターンを使用すると、トレーダーは潜在的な価格変動を予測し、いつ取引を開始および終了するかについて十分な情報に基づいた決定を下すことができます。 EA バージョン : Price Wave EA MT4
MT5バージョン: Price Wave Pattern MT5
特徴 :
ABCDパターンの自動検出。
強気パターンと弱気パターン。
任意のシンボルと任意の時間枠で機能します。 主要なレベルと価格目標。
カスタマイズ可能な設定と繊維レベルの調整。 アラートと通知。 今後さらに多くの機能が追加される予定です。
FREE

MACD indicator in MetaTrader 4/5 looks different than MACD does in most other charting software. That is because the MetaTrader 4/5 version of MACD displays the MACD line as a histogram when it is traditionally displayed as a line. Additionally, the MetaTrader 4/5 version computes the Signal line using an SMA, while according to MACD definition it is supposed to be an EMA. The MetaTrader 4/5 version also does not compute a true MACD Histogram (the difference between the MACD/Signal lines). This
FREE
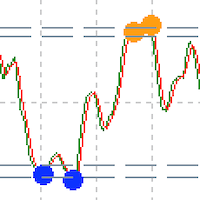
Custom Relative Strength Indicator with multiple timeframe selection About RSI The relative strength index is a technical indicator used in the analysis of financial markets. It is intended to chart the current and historical strength or weakness of a stock or market based on the closing prices of a recent trading period. Features
Indicator gives alert when reached oversold or overbought levels Gives dot indication while reaching levels. Can set indicator bar alert intervals for alerts Can choos
FREE
MT5バージョンはこちら: https://www.mql5.com/en/market/product/50255
Telegramチャンネル&グループ: https://t.me/bluedigitsfx
VIPグループアクセス: 支払い証明を私たちの受信箱に送信してください
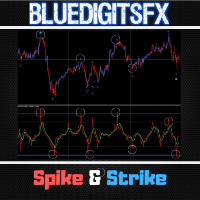
推奨ブローカー: https://bit.ly/BlueDigitsFxStarTrader BlueDigitsFx Spike And Strike Reversal — 正確な市場反転検出のための強力な複合オシレーター BlueDigitsFx Spike And Strike Reversalは、複数のインジケーター信号を組み合わせた複合オシレーターで、市場の反転を正確に予測するのに役立ちます。 このインジケーターは、基本的なオシレーターを含む2つのモジュールを統合し、最適なエントリーポイントを示す矢印で明確な視覚的シグナルを提供します。 主な特徴 簡単で視覚的、効果的な反転検出 既存の取引戦略のフィルタリングと強化 バークローズ時にのみシグナルを発生させ、信頼性を確保 すべての銘柄および時間枠
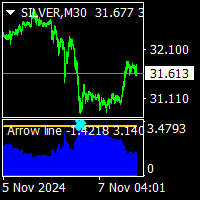
Arrow line indicator is no repaint trend indicator. it works on all time frame and all pairs. it is a pi number ( π) trigger based trend indicator. suitable for experienced traders and beginners. easy to understand. there is a trigger line and 2 histograms. red histogram is ower trigger that is top signal.. blue histogram is over trigger that is bottom signal. minimum bar number is 500. processed value must be setled between 500-3000. max value is depend to chart you are using.
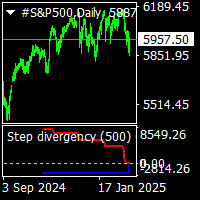
step divergency indicator is a buy sell divergency indicator.include sinus wave indicator. it work all timeframes and all pairs. red line gives step divergency sell formations. blue line gives step divergency buy formations. suitable for experienced and beginners. when prices is moving up and red lines step down ..this is sell divergecy formation and if prices moving down but blue line moving step up this is buy divergency formation. increased cnt value show more back side. gold line is sinus w

The indicator plots higher timeframe Kijun-sen (of Ichimoku ) on lower timeframes.
To change timeframes, in the timeframe field enter the number:
M1 PERIOD_M1 1 1 minute. M5 PERIOD_M5 5 5 minutes. M15 PERIOD_M15 15 15 minutes. M30 PERIOD_M30 30 30 minutes. H1 PERIOD_H1 60 1 hour. H4 PERIOD_H4 240 4 hour. D1 PERIOD_D1 1440 Daily. W1 PERIOD_W1 10080 Weekly. MN1 PERIOD_MN1 43200 Monthly.
By default, the Kijun is shifted 3 periods forward but if you wish to have it exactly as

The GGP Squeeze Momentum MT4 Indicator is a volatility and momentum tool designed to help traders optimize their trading performance and providing traders with actionable insights to make well-informed trading decisions. This indicator is MT4 conversion of the Squeeze Momentum Indicator by “LazyBear “ in Trading View website and some alert methods are added to provide real-time alerts when a trading signal is generated, in order to allow traders to act quickly and efficiently. For MT5 version p

Presenting the uGenesys Break of Structure and Change of Character Indicator The uGenesys Market Structure Indicator is the advanced solution designed specifically for forex traders seeking a competitive edge. This innovative tool goes beyond merely identifying Break of Structure (BoS) and Change of Character (CHoC); it also illuminates optimal entry and exit points on your forex charts, transforming your trading experience.
While the uGenesys Market Structure Indicator can reveal pivotal pat

COMMERCIAL SESSIONS This indicator shows in the selected graph divided by tables each of the sessions ASIA, JAPAN, LONDON, NEW YORK: Allows you to configure: Session Color ASIA, JAPON, LONDRES, NEW YORK Hide and show each session It works in the lowest timeframes on the market, among which H4, H1, M15, M5 and M1 are recommended. (Don't forget to check out our other indicators)

Introducing Auto Trendline Pro : Your Ultimate Trading Companion Are you tired of manually drawing trendlines on your forex charts? Do you wish for a tool that can simplify your trading while providing timely alerts? Look no further, because Auto Trendline Pro is here to revolutionize your trading experience. In the fast-paced world of forex trading, staying ahead of the curve is essential. Identifying trends, both upward and downward, can be a game-changer. This is where Auto Trendline Pro s
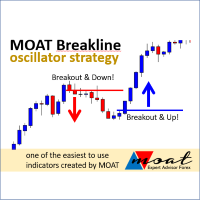
The indicator will provide a breakout line or price stop guide, we recommend M5 or H1 timeframes. Trade signal: Buy Signal: if the closed price (according to the timeframe) breaks the blue line and is already above it or if the lowest price stops above the red line. Sell Signal : if the closing price (according to the timeframe) breaks the red line and is already below it or if the highest price stops below the blue line. Feature: You will get time (hours) and price values for the lines

*This is tradingview indicator converted to mql4*
The Chandelier Exit Indicator is a popular technical analysis tool developed by Chuck LeBeau. It is designed to help traders identify potential exit points for their trades based on market volatility and the concept of trailing stops. The Chandelier Exit Indicator consists of three main components: Average True Range (ATR): The indicator utilizes the Average True Range, which measures market volatility. The ATR calculates the average range betwe
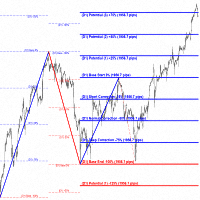
"Impulses and Corrections 4" is created to help traders navigate the market situation. The indicator shows multi-time frame upward and downward "Impulses" of price movements. These impulses are the basis for determining the "Base" , which is composed of zones of corrections of price movements, as well as "Potential" zones for possible scenarios of price movement.
Up and down impulses are determined based on a modified formula of Bill Williams' "Fractals" indicator. The last impulse is always "U

The KT 4 Time Frame Trend is an invaluable forex indicator for traders seeking to identify the trend direction across 4-time frames accurately. This innovative indicator allows users to simultaneously observe and analyze price trends across four different timeframes. Whether you're a beginner or an experienced trader, this tool offers an enhanced understanding of trend dynamics, leading to improved trading strategies on your trading platform. The capability to concurrently monitor multiple timef

Super Trend Button Super Trend is a trading strategy according to which one should trade Forex or Stocks when its price trend goes up, and trend goes down, expecting price movements to continue. “The trend is your friend” agree? Features - Special Button : Quick hide/show Super Trend chart. ( Make your Chart more clean and clear easily) - Color : You have the option of customising your favourite colour of Up Trend or Down Trend . - Super Trend Periods : You have the option to c

Introducing the "Extreme Exhaustion Levels": A powerful tool for traders looking to identify market exhaustion and potential trend reversals. The Exhaustion Indicator is an advanced technical analysis tool that helps traders identify when markets are overbought or oversold, potentially indicating an imminent reversal in the trend. With a unique combination of price action, moving averages, and Bollinger Bands, the Exhaustion Indicator provides traders with a comprehensive view of market condit
The Ichimoku indicator is an entire system by itself with an amazing win rate many traders feel that the chart looks like a mess when we add the indicator to the chart this is because there are too many elements present in the indicator we have a solution for that now "TT Ichimoku on off button indicator" ABOUT THIS INDICATOR This is an Ichimoku indicator that has the toggle feature separately for every element ie. Kumo cloud button, kijun button, etc... you can also hide/show the indicator

40% off. Original price: $50 (Ends on February 15) Advanced Bollinger Bands Scanner is a multi symbol multi timeframe Bollinger bands dashboard that monitors and analyzes the Bollinger Bands indicator from one chart. This panel monitors the Bollinger bands indicator in up to 28 configurable instruments and 9 timeframes for price overbought/oversold, price consolidation (Bollinger bands squeeze), and consolidation breakout (squeeze break) with a deep scan feature to scan all market watch symbo
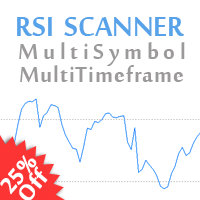
25% off. Original price: $40 (Ends on February 15) RSI Scanner is a multi symbol multi timeframe RSI dashboard that monitors Relative Strength Index indicator for price entering and exiting overbought and oversold in up to 28 symbols and 9 timeframes.
Download Demo here (Scans only M1 and M5) Settings description here MT5 version here
RSI Scanner features: Signals RSI entering and exiting the overbought and oversold zones. Monitors 28 customizable instruments and 9 timeframes at the sam

クオンツ移動平均勾配は、方向性と勢いを与える非常に強力な指標です。 インジケーターは塗り直しではありません。ma角度を効率的に計算してトレンドを見つけることができます。
シグナルキャンドルが閉じられると、利益カウントが始まります。 したがって、ライブで行われるのは正確な結果です。
提案されたTimeFrameはH1でそれを使用しています。 インジケーターのすべてのオプションは編集可能です。
ヒント:トレードスイングとトレンドブレイクアウトの方向。 フラクタル、練行足、ボリンジャーバンドは、精度と収益性を向上させることができます。
高低は、角度線の発散アプローチを使用して見つかる可能性があります。 このインジケータは、サポート抵抗、供給需要インジケータの追加確認として使用できます。
Ma勾配情報は、トレンドの方向と出口点を使用して入力するのに非常に役立ちます。 それは外国為替、株式、インデックスのために働きます。
PushNotifications / Email / SoundAlerts / PopUpAlertsでアラートを受け取ることができます。
改善が必要な場合はい
FREE

Trading doesn’t have to be complicated. With the right visual guidance, market decisions become clearer, calmer, and more confident.
Nebula Arrow is designed to help traders focus on what truly matters: high-quality entries based on refined market behavior. Just load it on your chart and let the arrows guide your trading decisions. Trade With Confidence We believe that simplicity is power. Nebula Arrow was created after extensive market observation and practical research, transforming complex
FREE

Free automatic Fibonacci is an indicator that automatically plots a Fibonacci retracement based on the number of bars you select on the BarsToScan setting in the indicator. The Fibonacci is automatically updated in real time as new highest and lowest values appears amongst the selected bars. You can select which level values to be displayed in the indicator settings. You can also select the color of the levels thus enabling the trader to be able to attach the indicator several times with differe
FREE

ADRアラートダッシュボードは、価格が通常の1日の平均範囲に関連して現在取引されている場所を一目で示します。価格が選択した平均範囲とレベルを超えると、ポップアップ、電子メール、またはプッシュを介して即座にアラートを受け取るため、プルバックと逆転にすばやくジャンプできます。ダッシュは空白のチャートに配置されるように設計されており、バックグラウンドに座ってレベルに達したときに警告を発するので、座って見たり、まったく見たりする必要はありません。 ここで利用可能なMT5バージョン:https:// www.mql5.com/en/market/product/66316
NEW:毎週と毎月の平均範囲とそれらへのアラートも表示されるようになりました!
ここでチャートのレベルを下げるADRリバースインジケーターを入手してください:https:// www.mql5.com/en/market/product/62757
通常の1日平均レンジ(ADR)内で価格が取引され、これらのレベルを上回っている時間の約60%は、通常、その後の引き戻し(利益確定)の動きを伴う急激な価格の動きの指標です。毎

A simple indicator that automatically highlights all FVGs (Fair Value Gaps) formed on the chart, as well as FVGs on history. It is possible to select colors for FVGs of different directions (long or short), select the time interval, select the color of middle point and you can also choose whether to delete filled FVGs or leave them on the chart (the option is beneficial for backtesting). The indicator can be very useful for those, who trade according to the concept of smart money, ICT, or simply
FREE
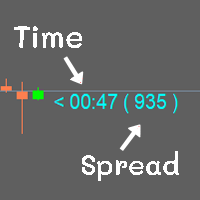
Show the time of candlesticks and spread. All data will be displayed in a rod. Can change color Can fix the size as needed
MT4 : Link https://www.mql5.com/en/market/product/102742 MT5 : Link https://www.mql5.com/en/market/product/102834
Most free code on various websites I didn't write it myself. I only do a little bit.
If you like it, please give 5 stars with it. Thank you.
FREE

MACD divergence indicator finds divergences between price chart and MACD indicator and informs you with alerts (popup, mobile notification or email). Its main use is to find trend reversals in the chart. Always use the divergence indicators with other technical assets like support resistance zones, candlestick patterns and price action to have a higher possibility to find trend reversals. Three confirmation type for MACD divergences: MACD line cross zero level Price returns to previous H/L Creat
FREE
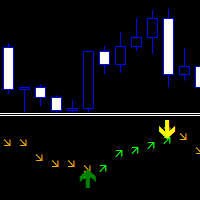
Direction Change Detector - 強気の動きと弱気の動きのバランスを分離するトレンドインジケーター。方向を確認する信号が付いた 2 列の矢印があります。
トレンドを見つけるためのスタンドアロンインジケーターとして、または取引を開始してシグナルの方向に従うための追加ツールとして機能します。
あらゆる市場と時間枠に適応します。 歴史に彼の証言を塗り替えることはない。 通知にはいくつかの種類があります。 上向きの緑の矢印は、価格が強気の方向であることを示します。 下向きのオレンジ色の矢印は、価格が弱気な方向であることを示しています。 読み取り値を変更するためのカスタマイズ可能なパラメータが 1 つあります。方向の数が増えると、価格はよりスムーズになり(低いタイム フレームに使用)、方向の数が減ると、価格はより早くなります(高いタイム フレームに使用)。
Length Directions - 方向の変化を計算するためのローソク足の数。
FREE

YOU CAN NOW DOWNLOAD FREE VERSIONS OF OUR PAID INDICATORS . IT'S OUR WAY OF GIVING BACK TO THE COMMUNITY ! >>> GO HERE TO DOWNLOAD
The Volatility Ratio was developed by Jack D. Schwager to identify trading range and signal potential breakouts. The volatility ratio is defined as the current day's true range divided by the true range over a certain number of days N (i.e. N periods). The following formula is used to calculate the volatility ratio: Volatility Ratio (VR) = Today's True Range/Tru
FREE
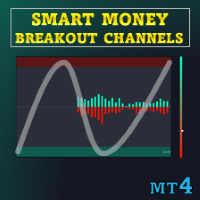
特別オファー : ALL TOOLS 、各 $35 ! 新しいツール は 最初の1週間 または 最初の3件の購入 について $30 です! MQL5 の Trading Tools チャンネル :最新情報を受け取るために私の MQL5 チャンネルに参加してください 本インジケーターは、“Smart Breakout Channels” と呼ばれるブレイクアウト検出ゾーンを描画します。これはボラティリティで正規化された価格の動きに基づいています。これらのゾーンは出来高オーバーレイを備えた動的なボックスとして表示されます。本ツールは、カスタムの正規化ボラティリティ計算を用いて一時的な蓄積または分配レンジを検出し、価格がそのレンジを上方または下方に抜けた瞬間をマークします。各チャネルは構造化されたレンジを表し、出来高デルタ、上昇/下降出来高、そしてモメンタムバイアスを示すグラデーションのビジュアルゲージによる追加コンテキストを提供します。 MT5 版はこちら: Smart Breakout Channels MT5 Scanner
MT4 版はこちら: S

VR ドンチャン インジケーターは、ドンチャン チャネルの改良版です。改善はチャネルのほぼすべての機能に影響を与えましたが、主要な動作アルゴリズムとチャネル構造は維持されました。現在のトレンドに応じてレベルの色の変化がボールインジケーターに追加されました。これは、トレーダーにトレンドまたはフラットの変化を明確に示します。スマートフォン、電子メール、または MetaTrader ターミナル自体で 2 つのチャネル レベルのうちの 1 つのブレイクアウトについてトレーダーに通知する機能が追加されました。値札が追加されており、これを利用してトレーダーはチャート上の価格レベルを確認できます。古典的なドンチャン指標の操作アルゴリズムは、トレーダーが指標が計算する期間を自分で設定できるという事実により、最適化され高速化されています。古典的な Donchian インジケーターは、MetaTrader ターミナルで利用可能な履歴全体を計算します。これにより、MetaTrader ターミナルに数学的計算の負荷が大きくかかります。 VR Donchian インジケーターは、トレーダーが設定で設定した金額の
FREE
False Breakout MT4 は、価格が最近のサポートまたはレジスタンスレベルを一時的に突破したように見えて、すぐに元のレンジに戻る「偽のブレイクアウト」を検出するためのインジケーターです。これらの偽のブレイクアウトは、裁量的な分析や逆張り戦略に有用で、予測的な自動シグナルを出すことなく視覚的な手がかりを提供します。 主な機能: 直近の高値・安値付近での偽のブレイクアウトを自動検出(例:2日間にわたる拡張された日足レベル)。 失敗したブレイクアウトを矢印やトレンドラインで明確に可視化。 ポップアップおよびプッシュ通知によるカスタマイズ可能なアラート(デバイスの設定が必要)。 ユーザー設定可能なパラメータ:スキャンするバー数、ピップ許容度、矢印のオフセット、色など。 高速動作とバックテストに最適化された軽量実装。 予測アルゴリズムは使用せず:保証されたシグナルは出さず、テクニカル判断を支援するツール。 互換性: タイムフレーム:M1 から H4。 対象:FX、インデックス、株式、コモディティ。 注意: 本バージョンは False Breakout MT4 と名付けられています。
FREE

このインジケーターは有名なフラクタルインジケーターに基づいていますが、多くのカスタマイズ と柔軟性があり、
これは、トレンドの反転を特定し、潜在的な利益を最大化するための強力なツールです。
高度な機能とユーザーフレンドリーなインターフェイスを備えた、あらゆるレベルのトレーダーにとって究極の選択肢です。 MT5 バージョン : Ultimate Fractals MT5 特徴 :
カスタマイズ可能なフラクタル キャンドルの数。 反転ライン。 カスタマイズ可能な設定。 ユーザーフレンドリーなインターフェイス。 主なパラメータ: 左側のキャンドル - フラクタルを形成する左側のバーの数。 Candle On Right - フラクタルの右側のバーの数。
市場の不確実性によって行動を妨げないようにしてください。 「究極のフラクタル」インジケーターでトレーディング ゲームをレベルアップさせましょう。
このツールを利用して自信を持って意思決定を行い、財務目標を達成する成功したトレーダーの仲間入りをしましょう。 特定の「Ultimate Fractals MT4」インジケーターの独自の機
FREE
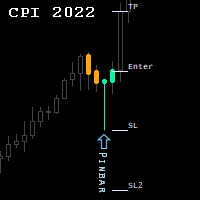
Candlestick Patterns Indicator.
NEW! FREE Candlestick Patterns Expert Advisor > https://www.mql5.com/en/market/product/105634?source=Site +Profile
The Indicator draws colored candlestick patterns, their description and future levels of Stop Loss / Take Profit. Combined with other market analysis, can greatly improve trading results. Indicator can be highly customized by the user including change of colors, fonts, levels, candle sizes etc...
developed, tested and optimized on " VantageMark
FREE
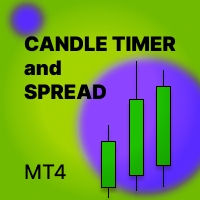
Candle_Timer_and_Spread インジケーターは、選択したシンボルのスプレッドとともに、ローソク足の終了までの時間と価格変化の割合を 1 つのチャートに表示します。
現在の時間枠のローソク足の終わりまでの時間と、その日の始値に対するパーセンテージでの価格変化のタイマーは、デフォルトでチャートの右上隅に表示されます。 パネルには、選択したシンボルのその日の始値に対する現在の価格のスプレッドと変化率が表示されます。パネルはデフォルトで左上隅に配置されます。
入力設定: Candle_Time_Lable_Settings - ローソク足の終わりまでの時間と現在のシンボルの価格の変化に関するタイマーのタイプの設定。 Font_Size - フォント サイズ。 X_offset - 横軸に沿ってシフトします。 Y_offset - 縦軸に沿ってシフトします。 Text_color - フォントの色。 Multi_Symbol_Settings - マルチシンボル パネルの設定。 Symbols_to_work - パネルに表示するシンボルをカンマで区切って手動で入力します
FREE
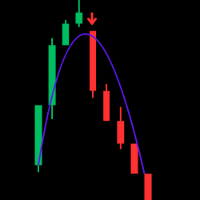
Trend WTS — Advanced Modular Trend & Signal Indicator for XAUUSD (M5 Optimized) Unlock precise trading insights with Trend WTS , a powerful and modular trend and signal indicator designed specifically for XAUUSD on the M5 timeframe. Built for traders seeking accuracy and clarity, Trend WTS combines fast moving average crossovers with a long-term EMA filter to deliver reliable buy and sell signals tailored for the gold market. Key Features: Dual Moving Average Trend Detection: Detect strong trend
FREE
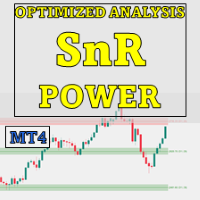
Special offer : ALL TOOLS , just $35 each! New tools will be $30 for the first week or the first 3 purchases ! Trading Tools Channel on MQL5 : Join my MQL5 channel to update the latest news from me 概要
OA SnR Powerは、サポートおよびレジスタンスレベルの強度を識別して評価するために設計された強力なツールです。取引量、反発頻度、再テスト回数などの重要な要素を組み込むことで、このインジケーターは市場の重要な価格ゾーンを包括的に可視化します。 その他の製品を見る: すべての 製品 OA SnR Powerの仕組み 高値と安値の特定 このインジケーターは、ローカル高値と安値を計算するための高度なアルゴリズムを使用します。 ユーザーはゾーン幅の設定を調整でき、サポートおよびレジスタンスの潜在的なレベルを正確に検出します。 主要レベルのフィルタリングと統合
FREE
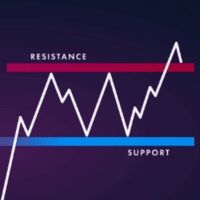
MT4 バージョン: https://www.mql5.com/ja/market/product/157679 MT5 バージョン: https://www.mql5.com/ja/market/product/157680
サポート・レジスタンス — スマートな市場構造レベル
プロのトレーダーと自動システム向けに開発された、シンプルでインテリジェント、かつ信頼性の高いサポート&レジスタンスインジケーターです。
サポート・レジスタンスは、フラクタル、ATRベースの価格セグメンテーション、マルチタイムフレーム分析を組み合わせた高度なクラスタリングアルゴリズムを用いて、真の市場レベルを検出するように設計されています。
このインジケーターは、ランダムなラインやノイズの多いラインを描くのではなく、価格が繰り返し反応した統計的に検証されたレベルを生成します。そのため、裁量取引、アルゴリズム取引、リスク管理、ブレイクアウト検証に最適です。
主な機能 高度なサポート・レジスタンス・エンジン ATRスケールのグリッドセグメンテーションを使用 上方フラクタルと下方フラクタルをクラスター化し
FREE

Introducing Volume Orderflow Profile , a versatile tool designed to help traders visualize and understand the dynamics of buying and selling pressure within a specified lookback period. Perfect for those looking to gain deeper insights into volume-based market behavior! MT5 Version - https://www.mql5.com/en/market/product/122657 The indicator gathers data on high and low prices, along with buy and sell volumes, over a user-defined period. It calculates the maximum and minimum prices during this

自動アンカードVWAPでトレーディングの洞察を解き放つ: 自動アンカードVWAP は、トレーディングの世界でのあなたのガイドとなります。これらの指標は、重要な市場の転換ポイントを特定し、VWAPラインを使用してチャート上に示します。これは、アンカードVWAP戦略を採用するトレーダーにとってのゲームチェンジャーです。 どのように動作するのか? 高値の特定: 現在のキャンドルの最高価格が前のキャンドルの最高価格よりも低い場合、 そして、前の高値がそれより前の高値よりも高い場合、 私たちはピークを特定しました。 この重要なポイントは、これらの三本のローソク足の中央に位置しています。 安値の認識: 現在のキャンドルの最低価格が前のキャンドルの最低価格よりも高い場合、 そして、前の低値がそれより前の低値よりも低い場合、 私たちは底を発見しました。 この底の焦点は、その中央部にあります。 アンカードVWAPのプロット: 各トップとボトムには、対応するVWAPラインがあります。ただし、制約があります:指標の計算要求により、チャート上に同時に表示できるラインは8本だけです。 追加のラインが現れると、古

Auto Optimized MFI は、自動で最適なMFIの買い・売りレベルを調整するインジケーターです。過去のデータに基づいて実際のトレードシミュレーションを行い、あなたの市場や時間足に合わせて最も効果的なエントリーポイントを見つけ出します。従来の80/20といった固定的なMFI基準ではなく、実際の価格と出来高の動きに適応するのが特徴です。 動作の仕組み 指定した範囲の過去のローソク足を分析し、MFIシグナルに基づくエントリーとエグジットをシミュレーションします。勝率、ドローダウン、TP/SL(利益確定/損切り)などの成績を記録し、これらの結果から最適なMFIレベルを毎日、毎週、または毎月自動で更新します。 主な機能 設定可能なMFI期間(デフォルト:14) 最適化するローソク足の範囲を指定可能 買い/売りレベルの範囲をカスタマイズ可能 細かい調整が可能なステップサイズ設定 最小利益ターゲットの設定で弱い戦略を排除 MFIラインとシグナル矢印のスタイル設定が可能 このツールは、市場の変化に柔軟に対応したいトレーダーに最適で、固定ルールに頼らず常に市場に適応する戦略を実現します。

It identifies the pivot, support, and resistance price levels of the selected timeframe and then draws lines onto the chart. FEATURES: Option to specify the Timeframe Period in the PivotSR calculation. Option to display the PivotSR of the last candle, of every candle, or of the current candle. Options for displaying labels, line thickness, and line color. PivotSR can be interpreted as reversal levels or past price reactions that can be used as the basis for current price analysis. Some traders b
FREE

PUMPING STATION – あなた専用の「オールインワン」戦略
PUMPING STATIONは、あなたのトレードをより楽しく、そして効果的に変えてくれる革新的なFXインジケーターです。ただの補助ツールではなく、強力なアルゴリズムを備えた本格的なトレーディングシステムで、より安定したトレードのスタートをサポートします。 この商品をご購入いただくと、以下の特典を無料でお付けします: 専用セットファイル:自動設定による最大パフォーマンスを実現。 ステップバイステップのビデオマニュアル:PUMPING STATION戦略の使い方を学べます。 Pumping Utility:PUMPING STATION専用の半自動トレードボットで、より快適かつシンプルな運用を可能にします。 ※ご購入後すぐにご連絡ください。追加リソースへのアクセスを提供いたします。 PUMPING STATIONの仕組み: トレンド管理:市場のトレンド方向を即座に判断。トレンドはあなたの最高の味方です。 エントリーサイン:チャート上の矢印で、取引のタイミングと方向を明確に示します。 明確な目標設定:インジケーターが自
Our modernised version of the popular Order Blocks Indicator for MT4 identifies major trend reversal and momentum exhaustion points by providing arrow signals on the chart. As a result, traders can identify bullish and bearish price reversal zones and BUY and SELL accordingly. Moreover, the indicator provides Buy and Sell Arrow signals.
An order block is a market structure that is defined as the last bearish candle before a bullish price move and vice versa. These order blocks act as support a
FREE
Engulfing Candle Signal Alert: Elevate Your Trading Strategy Unlock the full potential of your trading with the Engulfing Candle Signal Alert, the ultimate tool for identifying market reversals and enhancing your trading precision. Designed specifically for traders who value accuracy and timely alerts, this powerful indicator detects engulfing candle patterns, a key signal in technical analysis that often indicates a potential shift in market direction. What is an Engulfing Candle? An engu
FREE
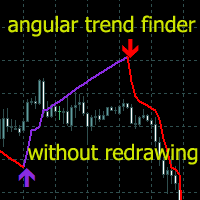
トレンド指標は、金融市場での取引に使用されるテクニカル分析の領域の 1 つです。
Angular Trend Lines ー - トレンドの方向を総合的に判断し、エントリー シグナルを生成します。ろうそくの平均方向を平滑化するだけでなく
トレンドラインの傾斜角度も使用します。傾斜角の基礎として、ガン角を構築する原理が採用されました。
テクニカル分析インジケーターは、ローソク足の平滑化とチャートの形状を組み合わせたものです。
トレンド ラインと矢印には 2 つの種類があります。赤い線と矢印は強気方向、紫の線と矢印は弱気方向です。
インジケーターの機能
このインジケーターは使いやすく、パラメータの設定も簡単で、トレンド分析や注文開始のシグナルの受信に使用できます。
インジケーターは再描画されず、ローソク足の終値に矢印が表示されます。
信号が発生したときに複数の種類のアラートを提供します。
あらゆる金融商品(外国為替、暗号通貨、貴金属、株式、指数)に使用できます。
このインジケーターは、どの時間枠やチャートでも機能します。
このインジケーターはプロセッサに負荷をかけない軽量アルゴリズム
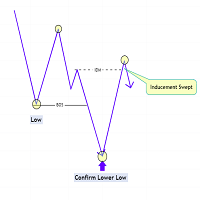
The Market Structure with Inducements & Sweeps indicator is a unique take on Smart Money Concepts related market structure labels that aims to give traders a more precise interpretation considering various factors.
Compared to traditional market structure scripts that include Change of Character (CHoCH) & Break of Structures (BOS) -- this script also includes the detection of Inducements (IDM) & Sweeps which are major components of determining other structures labeled on the chart.
SMC & pri
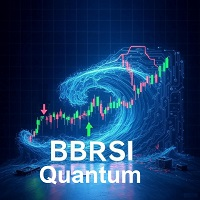
BBRSI Quantum (Free Edition) BBRSI Quantum is a powerful, 100% Non-Repainting indicator for MetaTrader 4 that generates clear Buy and Sell arrows based on an advanced momentum strategy. This tool is designed for traders who want to identify precise entry points during overbought or oversold conditions. This is the fully functional FREE edition. The Core Strategy: Bollinger Bands on RSI Unlike standard indicators, BBRSI Quantum does not apply Bollinger Bands to the price. Instead, it applies th
FREE

KT Trend Trading Suite は、トレンドフォロー戦略と複数のブレイクアウトポイントを組み合わせた多機能インジケーターです。
新たなトレンドが形成されると、このインジケーターは複数のエントリーチャンスを提供し、トレンドにうまく乗ることが可能になります。あまり重要でないエントリーポイントを避けるために、プルバックの閾値が使用されます。
MT5 バージョンはこちらで入手可能です https://www.mql5.com/en/market/product/46270
機能
市場のさまざまなダイナミクスを1つの方程式にまとめ、トレンドの全体像を明確に描写します。 エントリーシグナルに基づいて、局所的な高値と安値を視覚的に示す長方形を描画します。 シグナルの精度を自動的に測定し、パフォーマンス指標をシンプルに表示します。 複数時間足対応のダッシュボードを搭載し、すべての時間軸をスキャンして、それぞれのトレンド方向を表示します。
入力パラメータ
History Bars: 過去のシグナル分析に使用する履歴バーの数。 Signals Period: エントリ

ACB Breakout Arrows インジケーターは、特別なブレイクアウトパターンを検出することで、市場における重要なエントリーシグナルを提供します。このインジケーターは、特定の方向に勢いが定まりつつある状況を常にスキャンし、大きな値動きの直前に正確なシグナルを表示します。
複数通貨ペア・複数時間軸スキャナーはこちら - ACB Breakout Arrows MT4 用スキャナー
主な特徴 ストップロスとテイクプロフィットの水準を自動で表示します。 すべての時間足に対応したMTFスキャナーダッシュボード付き。 デイトレーダー、スイングトレーダー、スキャルパーに適しています。 シグナルの精度を高めるために最適化されたアルゴリズムを採用。 損益分岐点やスキャルピングの目標として利用できる特別な「クイックプロフィットライン」を搭載。 勝敗、成功率、平均利益などのパフォーマンス分析機能を搭載。 リペイントなし(シグナルは表示後に変更されません)。
トレードの確認 - ACB Trade Filter インジケーター を併用し、低確率の取引を除外しましょう。 強い買い: 上向き矢印
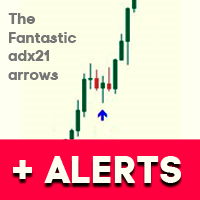
.See screenshots of the indicator. Uses information about the current trend. It is based on the classic ADX indicator. Gives a signal to enter a trade using a non-standard strategy.
Settings: Name Description Period of ADX The period of the classic ADX indicator Distance between +D & -D lines Distance between + D and -D lines . Determines the strength of the trend. Freshness of the signal (bars) Checking the freshness of a buy or sell signal.
Selects the very first signal in the span.
The numbe
FREE

AMD適応型移動平均線 (AAMA)
AAMAはMetaTrader 4用の適応型移動平均インジケーターで、市場の状況に応じて自動的に反応速度を調整します。 主な特徴: カウフマン効率比に基づく適応型移動平均 – トレンド相場では素早く反応し、レンジ相場ではノイズを除去 AMDの4つの市場フェーズを自動検出:蓄積期(Accumulation)、上昇期(Markup)、分配期(Distribution)、下降期(Markdown) ATRによるボラティリティ適応 – 現在の市場状況に応じて感度を調整 リアルタイム情報パネルで検出されたフェーズ、自信レベル、適応速度を表示 複数インジケーターを統合:ADX、RSI、MACDを使用して市場フェーズを正確に識別 Fast/Slow参照ゾーンで適応動作を視覚化 使用方法:
このインジケーターは市場状況に応じて自動的に適応速度を調整します。強いトレンドでは反応が速く、レンジでは遅くなります。ビジュアルパネルは現在の市場フェーズの解釈をサポートします。すべてのパラメータ(期間、色、感度)はトレーディングスタイルに合わせて自由にカスタマイズ可能です

SR PrevPeriods MT4 概要
SR PrevPeriods は、MetaTrader 4 のチャート上に前日、高値・安値、前週、高値・安値、前月、高値・安値をリアルタイムで表示するインジケーターです。軽量設計で、価格の反応ゾーン、ブレイクアウト、リバランスゾーンと重なることが多い、過去のサポート・レジスタンス領域を強調表示します。 機能
主要な過去レベルに水平線を描画し、必要に応じて正確な価格を表示するテキストラベルも追加します。新しいティックごとに自動更新され、内部のオブジェクト管理機能によってチャートが常に整然と保たれます。 有用性
前日、前週、前月の価格レベルは、多くの裁量トレーダーやシステムトレーダーにとって重要な指標です。これらのレベルを把握することで、相場状況の認識が高まり、押し目買いや戻り売りの精度が向上し、ブレイクアウトの確認にも役立ちます。過剰取引を減らし、あらゆる時間足で客観的なコンテキストを提供します。 主な特徴
日足・週足・月足レベルの個別表示切替
各レベルの価格を表示するオプションラベル
タイムフレームごとのカラー、ラインスタイル、太さを
FREE

Auto Optimized RSI:プロフェッショナルのための市場適応型システム 多くのトレーダーが失敗する理由は、動的な相場に対して静的なツールを使用しているからです。 すべてのチャートで 70/30 といった固定された RSI レベルを使用することは、数学的な誤りです。もしあなたが論理的な根拠のない「魔法の矢印」を探しているなら、このインジケーターはあなたには向いていません。 このツールは、「最適化こそがトレードで生き残るための唯一の鍵である」と理解しているプロフェッショナルのために設計されています。 一般的なインジケーターは、取引する通貨ペアや時間足を考慮しません。 Auto Optimized RSI は異なります。過去のデータに基づいて内部シミュレーションを行い、直近の相場で実際に価格が反転した正確なレベルを算出します。予測ではなく、計算に基づいています。 技術的優位性: 自己適応型ロジック: 現在の市場のボラティリティに基づいて、買い/売りゾーンを自動的に再計算します。 数学的根拠: 勝率 (Win Rate)、ドローダウン、平均損益などのパフォーマンス指標をチャート上
MetaTraderマーケットはトレーダーのための自動売買ロボットやテクニカル指標を備えており、 ターミナルから直接利用することができます。
MQL5.community支払いシステムはMetaTraderサービス上のトランザクションのためにMQL5.comサイトに登録したすべてのユーザーに利用可能です。WebMoney、PayPal または銀行カードを使っての入金や出金が可能です。
取引の機会を逃しています。
- 無料取引アプリ
- 8千を超えるシグナルをコピー
- 金融ニュースで金融マーケットを探索
新規登録
ログイン