Forex Master Pattern MT4
- インディケータ
- バージョン: 1.6
- アップデート済み: 29 10月 2024
- アクティベーション: 5

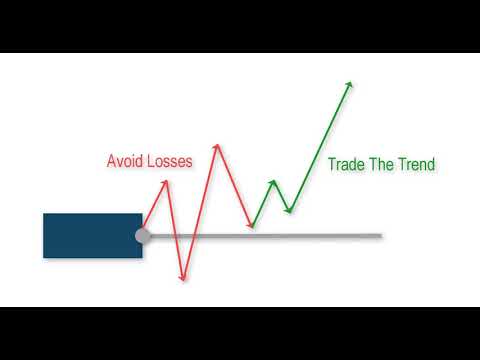
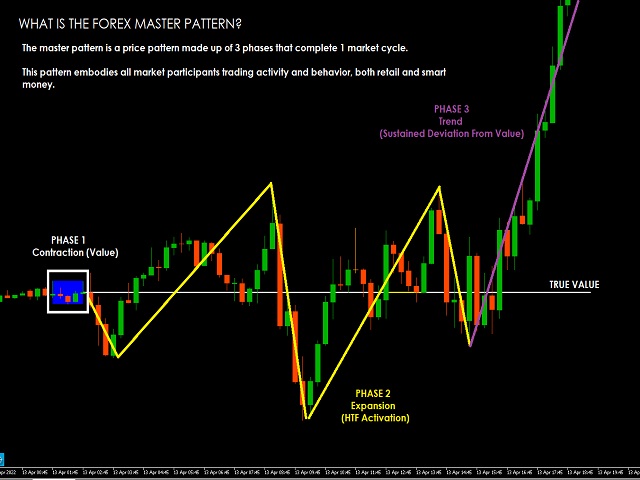
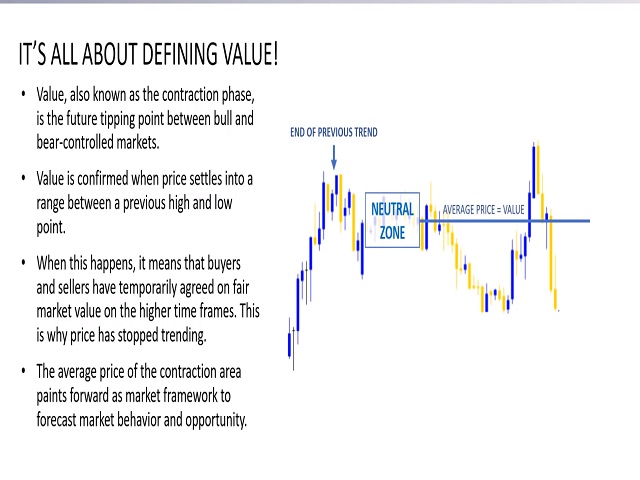
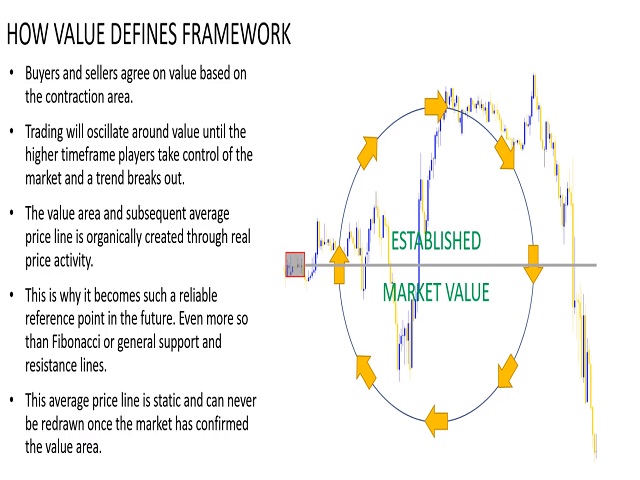
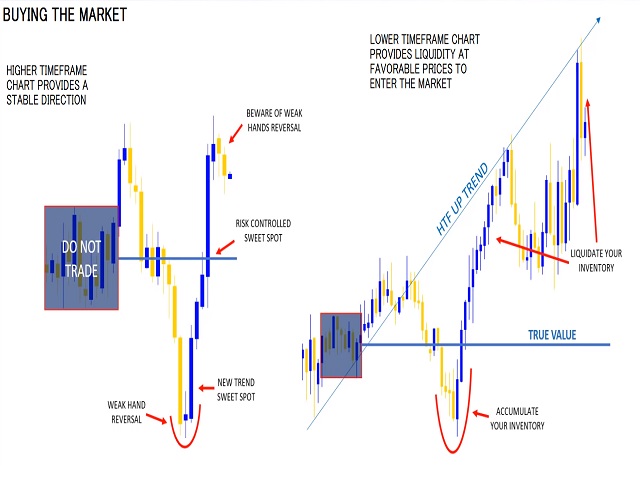
The Forex Master Pattern is an alternative form of technical analysis that provides a framework which will help you to find and follow the hidden price pattern that reveals the true intentions of financial markets. This algorithm here does a good job detecting the Phase 1 of the Forex Master Pattern cycle, which is the contraction point (or Value).
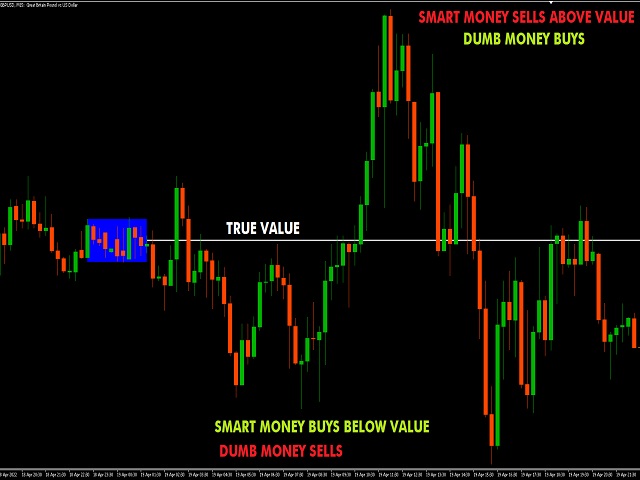
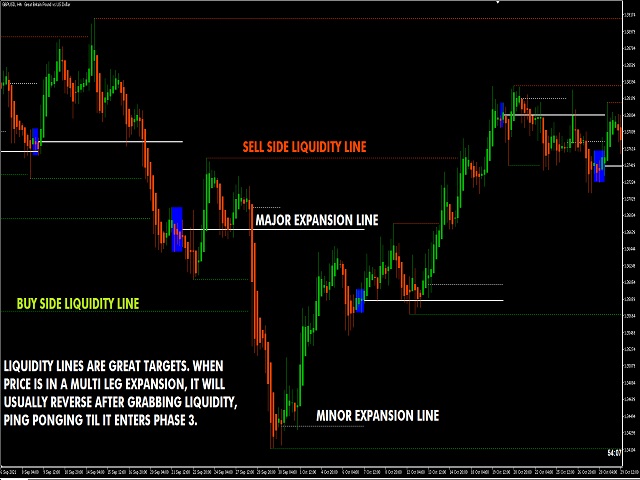
On Phase 2 we get higher timeframe activation (also called Expansion), which is where price oscillates above and below the average price defined on Phase 1.
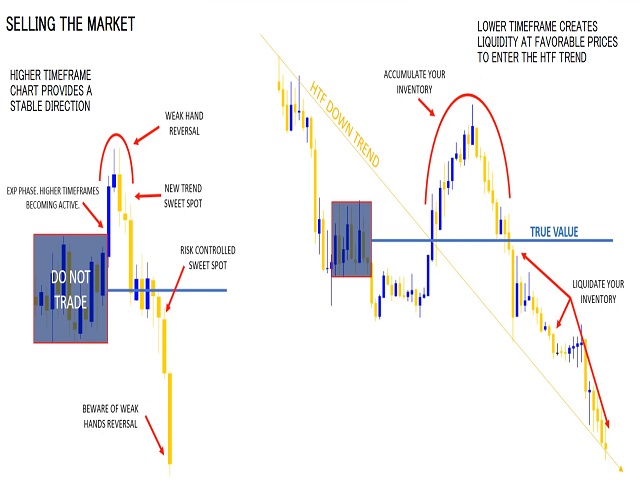
On Phase 3 is where we get a sustained deviation from value (the Trend).
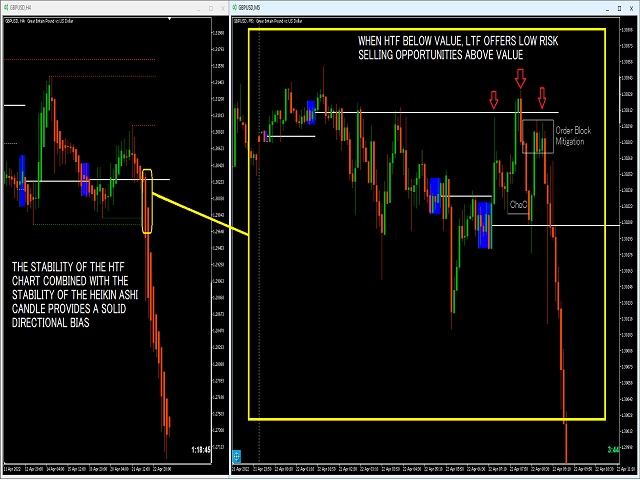
In a very short time you will start noticing this pattern, even on naked charts. It is all a matter of training your eyes - the more time you invest studying the charts with this indicator (both historically and replaying the market on strategy tester), the faster you will become familiar with this method.
This indicator DOES NOT REPAINT. You can safely study the chart historically because what is printed historically is what prints real time.
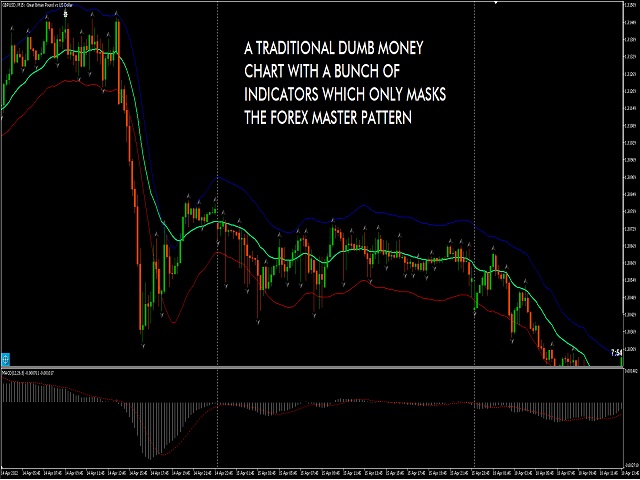
Why do traditional based indicator systems fail over time? Because the markets move in cycles that constantly change structure. Those traditional indicator systems must be constantly optimized and settings tinkered with because of the changing market environment. There are an infinite number of variables that affect price so no exact technical system can work the same forever, which is also the reason why most bots/EA fail.
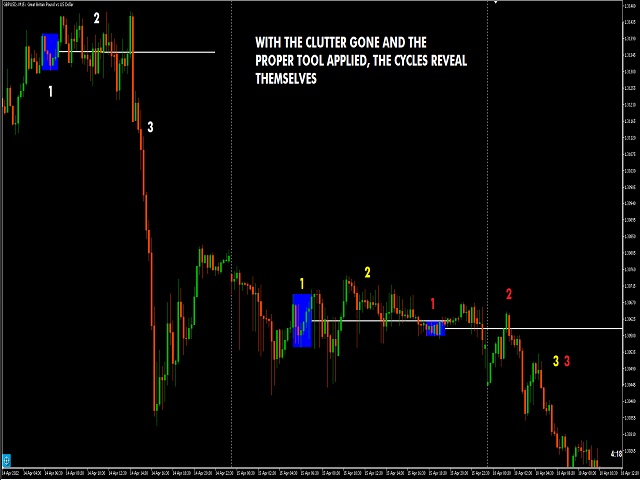
If you learn to spot the Forex Master Pattern and understand the sequence of the real cycles that drive the markets, you can more accurately forecast market behavior. By using traditional indicators you end up masking this pattern.
Use the insights provided by the Forex Master Pattern indicator to elevate your trading to the next level.
This method of analysis works in any liquid market and timeframe.
VERY IMPORTANT:
The default setting of historical bars is set to 500. This is more than enough for day trading and ensures fast drawings loading time and stable performance. Bear in mind that, the more bars you choose to load historically, the longer it will take to draw everything. On my mid end computer it takes 1 minute to load 10K bars worth of boxes and lines on a 5min chart, for example. If you try to load too many bars historically in lots of different charts and on top of that other indicators, don´t come here and complain about performance issues (metatrader hanging, lagging, weird behaviors etc...)
Be mindful to choose the appropriate number of historical bars used for calculation according to the timeframe you load the indicator in.
Be mindful to choose the appropriate number of historical bars used for calculation according to the timeframe you load the indicator in.
I recommend that you use the strategy tester if you wanna analyze more than 10K bars historically. Instead of trying to load 20K, 30K bars for the algorithm to analyze and draw boxes, it is better if you configure the strategy tester to start where you want to perform your longer term historical analysis. PLEASE, IF YOU WILL DEMO THIS INDICATOR, DO IT USING THE MT5 VERSION. For some reason this indicator does not work properly on MT4´s strategy tester.
Indicator Parameters:
They are all self-explanatory, except Type. You can choose between 1 and 2.
1 is better suited for LTF (M1 to M30)
2 is better suited for HTF (H1 and upwards)
However, this is my personal preference. You can of course experiment and choose what looks best for you.
If you wanna learn more about this tool and method, I recommend you to watch the video posted (and also all the other videos from the channel).


Hi Gauer, bought the indi a while ago and just getting back into trading and would like to join the discord group, could you send me an invite please.