YouTubeにあるマーケットチュートリアルビデオをご覧ください
ロボットや指標を購入する
仮想ホスティングで
EAを実行
EAを実行
ロボットや指標を購入前にテストする
マーケットで収入を得る
販売のためにプロダクトをプレゼンテーションする方法
MetaTrader 4のための無料のテクニカル指標

ワンミニットゴールド は、出来高・価格アクション・トレンドフィルターを基にした矢印型エントリーシグナルで、トレーダーが相場の正しい方向に乗り、チャンスを得るのを助けます。 なぜワンミニットゴールドを選ぶのか? TP-SL。 各シグナルにTPとSLオブジェクトがチャートに表示され、トレーダーはそれに基づき設定可能。方法はATR TP-SLと固定ポイントTP-SL。 統計パネル。 指定履歴バーに基づき勝敗統計を表示。現在の勝率%、連勝・連敗数、純利益を表示。 高度な調整性。 デフォルト設定は最適化されているが、無数の期間と組み合わせが可能。5つのルールがシグナル承認前に一致する必要あり。 リペイントなし。 他のインジケーターと違い、矢印や機能は決してリペイントしません!
FREE

Crystal Volume Profile Auto POC (MT4) — 自動POC付き出来高プロファイル 概要
Crystal Volume Profile Auto POC は MetaTrader 4 用の軽量で最適化されたインジケーターです。価格ごとの出来高分布を表示し、最も取引量が集中した価格 (POC) を自動的に強調します。これにより、隠れたサポート・レジスタンスや機関投資家の活動を簡単に把握できます。 MT5版も利用可能: Crystal Volume Profile Auto POC (MT5) 。 主な機能 自動POC検出 動的ボリュームプロファイル (可視範囲またはカスタム範囲) 固定プロファイルで詳細分析可能 ヒストグラムサイズ・色・ラインスタイルの調整可 各ローソク足で自動更新 Reset VP と Hide VP ボタン搭載 ライト/ダークテーマ対応 利用するメリット 蓄積・分配ゾーンを特定 高出来高のブレイク/リジェクトゾーンを検出 機関投資家の活動を確認 POCを基準に正確なエントリー/イグジット 反転・継続戦略の信頼性向上 使い方 (MT4)
FREE
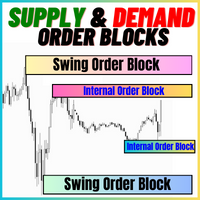
供給と需要のオーダーブロック:
「供給と需要のオーダーブロック」インジケーターは、外国為替のテクニカル分析において重要なスマートマネーの概念に基づいた洗練されたツールです。このツールは供給と需要ゾーンを特定し、機関投資家が重要な足跡を残す重要な領域に焦点を当てています。売り注文を示す供給ゾーンと買い注文を示す需要ゾーンは、トレーダーが価格の逆転や減速を予測するのに役立ちます。このインジケーターは、ブレイクアウト・オブ・ストラクチャー(BoS)およびフェアバリューギャップ(FVG)のコンポーネントを組み合わせた賢明なアルゴリズムを採用しています。BoSは市場の混乱を検出し、潜在的なオーダーブロックを特定し、FVGは精度を向上させるためにフェアバリューギャップを考慮しています。このツールはこれらの条件の視覚的表現を提供し、潜在的なオーダーブロックを強調し、市場のダイナミクスや転換点に関する洞察を提供することで、トレーダーの意思決定を支援します。使いやすいデザインは、さまざまな技術的な専門知識レベルのトレーダーにアクセスしやすく、高度な分析の包括的なソリューションを提供します。
特徴:
FREE
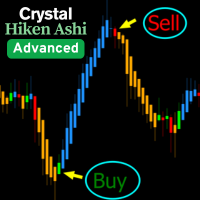
Crystal Heikin Ashi – 高度な視覚化 Heikin Ashi (MT4 バージョン) 概要 Crystal Heikin Ashi for MetaTrader 4 はプロフェッショナル向けの Heikin Ashi インジケーターで、チャートの視覚化を強化し、プライスアクショントレーダーやスキャルパー、アナリストに明確さを提供します。
この MT4 バージョンは、純粋な Heikin Ashi ローソク足に焦点を当て、軽量かつ高速なパフォーマンスを実現します。 注: トレンドカラーリングと高度なモメンタム検出は MT5 バージョンにのみ搭載されています:
MT5 バージョン → https://www.mql5.com/en/market/product/142042 主な機能 (MT4) ネイティブ Heikin Ashi ローソク足。 ブル/ベアの色をカスタマイズ可能。 標準ローソク足を非表示にするオプション。 ライト/ダークテーマに対応。 長期ヒストリーでも高速処理。 価格の流れや反転を明確に表示。 パラメータ ローソク足スタイル: 標準。 チャートテーマ:
FREE

トレンドキャッチャー (The Trend Catcher): アラートインジケーター付きのトレンドキャッチャーストラテジーは、トレーダーが市場のトレンドやエントリー/エグジットのポイントを特定するのに役立つ多機能なテクニカル分析ツールです。市場状況に応じて適応する動的なトレンドキャッチャーストラテジーを搭載し、トレンド方向を視覚的にわかりやすく表示します。トレーダーは自分の好みやリスク許容度に合わせてパラメータをカスタマイズできます。このインジケーターは、トレンドの特定、潜在的な反転のシグナル、トレーリングストップの仕組みとしての機能、そして市場に迅速に対応するためのリアルタイムアラートを提供します。 特徴: トレンド識別: 上昇トレンドおよび下降トレンドをシグナル表示。
トレンド反転: ローソク足の色が上昇から下降、またはその逆に変わるとき、潜在的な反転を警告。
リアルタイムアラート: 新しいトレンドが検出された際にアラートを生成。 推奨設定: 通貨ペア: EURUSD、AUDUSD、XAUUSD…
時間足: M5、M10、M15、M30、H1。
口座タイプ: すべてのECN口座、
FREE
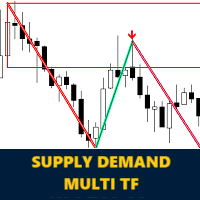
MetaTrader 4 の Koala Supply Demand Indicator をご紹介します (他のトレーダーがあなたの経験から恩恵を受けられるように、肯定的なものでも否定的なものでも、レビューやフィードバックを共有することをお勧めします)。 Koala Supply Demandインジケーターへようこそ。このインジケーターは連続したサプライとデマンドゾーンを特定するために設計されています。このインジケーターはトレーダーが市場をゾーンエリアとして表示できるようにし、いくつかの強力なゾーンがどのように価格を尊重しているかを見るのに役立ちます。このインジケーターはまた、ゾーン内で形成されたときに価格アクションのシグナルを表示することもできます。 Koala Trading Solutionチャンネル で最新のKoala製品に関する最新情報を入手するために、mql5コミュニティに参加してください。参加リンクは以下です: https://www.mql5.com/en/channels/koalatradingsolution https://www.mql5.com/en/bl
FREE
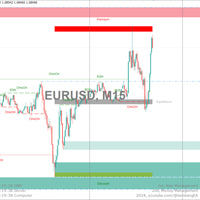
MT4バージョン: https://www.mql5.com/ja/market/product/125756 MT5バージョン: https://www.mql5.com/ja/market/product/157655
このオールインワンインジケーターは、リアルタイムの「市場構造」(内部およびスイングBOS/CHoCH)、注文ブロック、プレミアムゾーンとディスカウントゾーン、イコールハイとイコールローなどを表示し、トレーダーは広く使用されているプライスアクション手法でチャートを自動的にマークアップできます。フェアバリューギャップスクリプトのリリース後、コミュニティから同じカテゴリの機能追加を求める多くの要望をいただきました。
「市場構造」は、流動性をより正確に把握し、市場におけるより最適な関心ポイントを見つけたいと考えているプライスアクショントレーダーの間では、比較的新しい用語ですが、広く使用されています。機関投資家の注文がどこに出されているか(買い側または売り側の流動性)を把握することは、プライスアクションに基づいてより実用的なエントリーとエグジットを見つけるための
FREE

キャンドルタイマーカウントダウンは、現在のバーが閉じて新しいバーが形成されるまでの残り時間を表示します。 時間管理に使用できます。
MT5バージョンはこちら !
機能のハイライト 現地時間ではなくサーバー時間を追跡します 構成可能なテキストの色とフォントサイズ シンボルの日次変動のオプションの視覚化 CPU使用率を削減するために最適化
入力パラメータ
毎日の変化を表示:true / false テキストフォントサイズ テキストの色
それでも質問がある場合は、直接メッセージで私に連絡してください。 https://www.mql5.com/ja/users/robsjunqueira/
これが私たちが継続的に進化することができる唯一の方法であるため、改善のための提案に気軽に連絡してください。
FREE

トレーディングセッション時間インジケーター:
「トレーディングセッション時間インジケーター」は、外国為替市場での異なる取引セッションの理解を向上させるために設計された強力なテクニカル分析ツールです。このシームレスに統合されたインジケーターは、東京、ロンドン、ニューヨークなどの主要セッションの開始および終了時刻に関する重要な情報を提供します。自動的なタイムゾーンの調整により、世界中のトレーダーに対応し、取引スケジュールを高流動性の期間に最適化し、低活動時間を回避するのに役立ちます。市場センチメント、ピークのボラティリティ期間、およびセッションの重複に関する洞察を提供し、日中トレーダーが戦略に沿った正確な決定を行うのを支援します。カスタマイズ可能な表示により、ユーザーの体験を個人化できます。また、そのデータを組み込んだスマートな取引計画は、改善された取引結果につながる可能性があります。低活動時間の認識を促進することで、トレーダーは過度の取引を避け、品質の高い機会に集中できます。さまざまな取引プラットフォームとシームレスに互換性があり、「トレーディングセッション時間インジケーター」は、ト
FREE
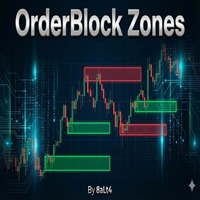
概要 OrderBlock Zoneは、市場における機関投資家の取引領域(オーダーブロック)を自動的に検出・可視化する、高度なMetaTrader 4インジケーターです。大手プレイヤー(銀行、ヘッジファンド)が残した痕跡を追跡し、潜在的なサポートレベルとレジスタンスレベルを特定します。
主な機能 自動オーダーブロック検出 フラクタルベースの分析:36 期間(カスタマイズ可能)のフラクタル分析により、強力な転換点を特定 ブル&ベアゾーン:緑色の矢印は上昇、赤色の矢印は下降のオーダーブロックを示します 巻き込みパターンサポート:巻き込みローソク足パターンを認識し、より強力なシグナルを生成 ビジュアルツール 自動レベルライン:各オーダーブロックの上限および下限ライン カラーゾーン:ブル(緑)とベア(赤)のゾーンが明確に区別 巻き込みハイライト:巻き込みパターンを青/オレンジの四角形で強調表示 すっきりしたインターフェース:グリッドは自動的に閉じ、グラフは最適化された表示のために左にスライド カスタマイズ可能なパラメータ フラクタル周期:感度を調整(デフォルト:36) 線の長さ:Ord
FREE

MT5版 Golden Hunter は、マーケットでマニュアル取引を行うトレーダーのために開発されました。3種類の指標で構成される非常に強力なツールです。 強力なエントリー戦略:通貨ペアのボラティリティを測定し、市場のトレンドを特定する指標によって形成されています。 LSMA:価格データを平滑化し、短期的なトレンドを検出するのに有効です。 Heikin Ashi:インディケータをチャートに貼り付けると、日本のローソク足がHeikin Ashiローソク足に変更されます。このタイプのローソク足は、価格情報を滑らかにすることで、確かなトレンドを見出すことができる。
特徴 再塗装なし
このインディケータは、新しいデータが到着しても値を変更しません
取引ペア
非常に低いスプレッドで、変動が激しいペア(EURUSD、GBPUSD、BTCUSD...)です。レンジペアの使用は推奨しません
期間
M5 取引時間
マーケットに動きがあり、スプレッドが低く抑えられる日中の時間帯に取引することが望ましい
Buffers Buy Buffer: 9 / Sell Buffer: 12
FREE

私たちのサポートまたはレジスタンスレベルは、市場の価格行動が逆転して方向を変え、市場にピークまたはトラフ(スイングポイント)を残したときに形成されます。サポートとレジスタンスのレベルは、取引範囲を切り開くことができます。インジケーターは、インジケーターセットで定義されたバーのX量(期間)に基づいて、スイングハイとスイングローを識別します。 注:価格アクションインジケーターが気に入った場合は、オールインワントレンドインジケーター(トレンドスクリーナー、トレンドライン、ストロングトレンド、トレンドリバーサルシグナルなど)をお試しください。 入手するには、 ここをクリックしてください
主な機能 テクニカル分析の重要な概念は、抵抗またはサポートレベルが破られると、その役割が逆転することです。価格がサポートレベルを下回ると、そのレベルは抵抗力があります。価格が抵抗レベルを超えて上昇した場合、それはしばしばサポートになります。 水平方向のサポートと抵抗のレベルは、これらのレベルの最も基本的なタイプです。それらは単に水平線で識別されます:
チャートの緑のレベルは、抵抗レベルです。 チャートの赤
FREE
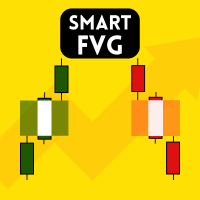
Smart FVG インジケーター MT4 – MetaTrader 4 向け高度なフェアバリューギャップ検出 Smart FVG インジケーター MT4 は、MetaTrader 4 上で Fair Value Gap(FVG)をプロフェッショナルレベルで検出・監視し、アラートまで行うツールです。ATR ベースのフィルタリングと相場構造を考慮したロジックを組み合わせることで、ノイズを取り除き、流動性に応じて適応し、本当に重要な不均衡だけを残して精度の高い判断をサポートします。
主な特長 正確な FVG 検出:単なるローソク足のギャップではなく、市場の本質的な非効率を捉えます。 ATR ベースの精度:市場や時間軸が変わっても、低品質なシグナルを自動的にフィルタリング。 有効性のリアルタイム追跡:価格がゾーンを埋める/ブレイクすると、ゾーンが自動で延長・調整・削除されます。 カスタマイズ可能な表示:色・ラインスタイル・塗りつぶしを自由に設定し、どんなテンプレートにも合わせられます。 実用的なアラート:新規 FVG や、埋められた/無効化されたゾーンをリアルタイム通知。 パフォーマンス
FREE
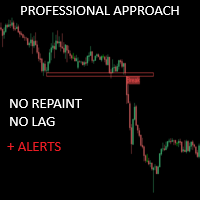
クリティカルゾーンは、より正確なマーケットエントリーを求める手動トレーダーのために特別に作成されました。このインディケータは、チャート上の最も関連性の高いサポートとレジスタンス、 およびそれらのブレイクアウトとリテストを計算することで、高度なアルゴリズ ムを使用して関心領域を検出します。このインディケータは、潜在的に有利な買い/売りの機会が検出された場 合にアラートと通知を送信するように設定でき、トレーダーが画面/ MT5 バージョンの前にいないときでも取引機会を把握することができます。
特徴 リペイントなし このインディケータは、新しいデータが到着してもその値を変更しません 取引ペア すべてのFXペア 季節性 すべての季節性
パラメータ ===== サポートとレジスタンスの設定
計算のために参照するバー // サポートとレジスタンスのレベルを計算するために、現在のバーから 逆方向のバーの範囲。
===== 条件
ブレイクアウト // ブレイクアウト検出のオン/オフ
再試行 // 再試行の検出を有効または無効にする
===== サポートとレジスタンスのスタイ
FREE

サポート&レジスタンスレベルファインダー:
サポート&レジスタンスレベルファインダーは、取引におけるテクニカル分析を向上させるために設計された高度なツールです。ダイナミックなサポートとレジスタンスレベルを備えており、チャート上で新しいキーポイントが展開されるにつれてリアルタイムに適応し、ダイナミックかつレスポンシブな分析を提供します。そのユニークなマルチタイムフレーム機能により、ユーザーは任意の所望のタイムフレームで異なるタイムフレームからのサポートとレジスタンスレベルを表示でき、日足レベルを5分足のチャートに表示するなど、微妙な視点を提供します。歴史的データセットを組み込んだスマートアルゴリズムを利用しており、他のS&Rインジケーターとは異なる包括的な分析を確保しています。レベルの検出時には複数パラメータ計算を使用し、精度を向上させています。ユーザーは、サポートとレジスタンスレベルの色を個別にカスタマイズでき、パーソナライズされたビジュアルエクスペリエンスを作成できます。ツールには価格が重要なレベルに近づくとトレーダーに通知するアラート機能も含まれており、タイムリーな意思決定を促
FREE

Over 100,000 users on MT4 and MT5 Blahtech Candle Timer displays the remaining time before the current bar closes and a new bar forms. It can be used for time management Links [ Install | Update | Training ] Feature Highlights
The only candle timer on MT4 with no stutter and no lag S electable Location Tracks server time not local time Multiple colour Schemes Configurable Text Customisable alerts and messages Optimised to reduce CPU usage Input Parameters Text Location - Beside / Upper
FREE

このプロジェクトが好きなら、5つ星レビューを残してください。 ボリュームウェイト平均価格は、合計ボリュームに取引された値の比率です
特定の時間の地平線上に取引. 平均価格の尺度です。
株式が取引地平線上に取引されている. VWAPは、多くの場合、
投資家の取引ベンチマークは、可能な限り受動を目指す
実行。 このインジケータを使用すると、VWAPを以下のように描画できます。 現在の日。 現在の週。 現在の月。 現在の四半期。 現在の年。 または: 前の日。 前週。 前の月。 前の四半期。 年末年始
FREE

MT4 バージョン: https://www.mql5.com/ja/market/product/125434 MT5 バージョン: https://www.mql5.com/ja/market/product/157662
MT4 アシスタント: https://www.mql5.com/ja/market/product/107986
ラリーベースラリー (RBR)、ドロップベースラリー (DBR)、ドロップベースドロップ (DBD)、ラリーベースドロップ (RBD)、フェアバリューギャップ (FVG) / インバランス、ヒドゥンベース
「需給 MT4」インジケーターのご紹介。これは、金融市場のダイナミックな世界を正確かつ自信を持ってナビゲートするための究極のツールです。この最先端インジケーターは、トレーダーが需給動向をリアルタイムで把握できるよう綿密に設計されており、情報に基づいた意思決定と取引ポテンシャルの最大化を可能にします。 主な機能: 自動ゾーン識別:このインジケーターは、高度なアルゴリズムを用いて、価格チャート上に主要な需給ゾーンを自動的に検出し、プロットしま
FREE

The "Gold Trader Pro Indicator" is an advanced technical analysis tool for the MetaTrader 4 platform, designed to help you make informed trading decisions about gold. Using a combination of moving averages, RSI, ADX, MACD, and volume analysis, this indicator provides clear trading signals across multiple timeframes, including M5, M15, M30, H1, H4, and D1. My indicators for free. I only ask that leave your feedback to help me improve them or as a thank you. Have a good trade! Main Features Multi
FREE

主な目的:"ピンバー"は、自動的に金融市場チャート上のピンバーを検出するように設計されています。 ピンバーは、特徴的なボディと長いテールを持つキャンドルであり、トレンドの反転または修正を知らせることができます。
それがどのように機能するか:インジケーターはチャート上の各キャンドルを分析し、キャンドルの体、尾、鼻のサイズを決定します。 事前定義されたパラメータに対応するピンバーが検出されると、インジケータはピンバーの方向(強気または弱気)に応じて、上矢印または下矢印でチャート上に
パラメータ: TailToBodyRatio-テールの長さとピンバーのボディサイズの最小比率を定義します。 NoseToTailRatio-ピンバーの「ノーズ」とテールの間の最大許容比を設定します。 ArrowSize-マークされたピンバーとチャート上のピンバーを指す矢印との間の距離を定義します。 適用:"ピン棒"の表示器が潜在的な傾向の逆転ポイントを識別し、市場か近い位置を書き入れる信号を発生させるのに使用することができます。 正しく使用され、他のテクニカル指標や分析方法と組み合わせると、指標は取引結果
FREE
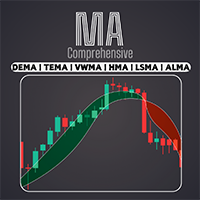
EMA、SMA、WMAなど、幅広い移動平均線にアクセスできます。独自の取引スタイルに最適な移動平均線の組み合わせでテクニカル分析をカスタマイズ / MT5バージョン
特徴 異なる設定で2つのMAを有効化可能。 チャート設定のカスタマイズが可能 クロスしたMAや価格がMAとクロスした場合、ローソク足の色を変更可能。 MAがクロスした場合、または価格がMAとクロスした場合にアラートを送信。
移動平均の種類 SMA --------------------> (Simple) EMA --------------------> (Exponential) SMMA [RMA] ----------> (Smoothed) WMA -------------------> (Linear Weighted) DEMA ------------------> (Double EMA) TEMA ------------------> (Triple EMA) VWMA -----------------> (Volume Weighted) HMA
FREE
このVWAPはシンプルなVWAPですが、価格がVWAPラインに到達またはそれを越えた際に通知を行う機能が組み込まれています。 この指標はMetaTrader 4(MT4)向けの従来のVWAP指標です。 デフォルトのパラメータは通常のVWAPのものですが、VWAPの計算と最適化を行う能力があります。 価格がVWAPに触れるかクロスすると、アラート、携帯電話の通知、電子メール、またはサウンドイベントを介して通知されます。 MetaTrader 4用のアンカードVWAP指標 パラメータ: VWAPサイクル VWAPは特定の時間枠で計算されます。通常のVWAPは日毎に新しい分析を開始しますが、この指標では、デフォルトでこのオプションがあり、VWAPを計算するために希望する期間を選択できます。これは、M1の時間枠で取引していても、H1の時間枠のVWAPの計算を毎新しいH1バーごとに見ることができます。この計算の再開は選択した時間サイクルに従います。 ただし、この時点ではこれについて心配する必要はありません。デフォルトのパラメータは通常のVWAPに準拠して構成されています。このVWAP指標をダウン
FREE

The Fair Value Gap (FVG) is a price range where one side of the market liquidity is offered, typically confirmed by a liquidity void on the lower time frame charts in the same price range. Price can "gap" to create a literal vacuum in trading, resulting in an actual price gap. Fair Value Gaps are most commonly used by price action traders to identify inefficiencies or imbalances in the market, indicating that buying and selling are not equal. If you're following the ICT Trading Strategy or Smart
FREE

比類のない公正価値ギャップMT4インジケーター(FVG)で、これまでにない取引を体験してください。
このMQL5市場指標は、同クラスで最高と評価されています。
トレーダーに比類のないレベルの精度と市場の動向に関する洞察を提供します。 EAバージョン: WH Fair Value Gap EA MT4
SMCベースのインジケーター: WH SMC Indicator MT4 特徴:
クラス最高の公正価値ギャップ分析。 マルチタイムフレームのサポート。 カスタマイズ。 リアルタイムアラート。 ユーザーフレンドリーな完璧さ シームレスな互換性 利点:
比類のない精度: 最高の公正価値ギャップ指標をすぐに利用できるので、自信を持って意思決定できます。 最適化されたリスク管理: 資産の真の公正価値を活用して、市場の調整を識別し、比類のない精度でリスクを管理します。 最高の汎用性: デイトレード、スイングトレード、長期投資など、お好みの取引スタイルに合わせてインジケーターをカスタマイズできます。様々な時間枠や金融商品にシームレスに適応します。 実証された卓
FREE

The Area of Interest (AOI) Indicator is a powerful tool designed to help traders identify key market zones where price reactions are highly probable. This indicator specifically highlights two critical zones: Seller AOI (Area of Interest) : This zone represents areas where sellers are likely to enter the market, often acting as resistance. When the price approaches or touches this zone, it signals that a potential sell-off could occur. Buyer A OI (Area of Interest) : The BOI zone identifies re
FREE

MT5 version | Owl Smart Levels Indicator | Owl Smart Levels戦略 | FAQ
Fractals Indicator は、著者のビル ウィリアムズのトレーディング戦略の要素の 1 つです。 価格チャートで価格反転ポイントを検索し、その結果、サポートとレジスタンスのレベルを検索するために使用されます。 Full Fractals Indicator は改良された Fractals であり、ほぼすべての取引端末のツールキットで利用できます。 唯一の違いは、フラクタルを構築するために、メインのローソク足の左に 5 本、右に 2 本のローソク足を使用することです (図 1 を参照)。 基本的な構造に加えて、Full Fractals は価格がしばらく止まっているレベルを探します。 Telegram チャット: @it_trader_chat 新しい Expert Advisor Prop Master - 取引ターミナルでテストしてください https://www.mql5.com/ja/market/produc
FREE
Volumatic Trend is a powerful, trend-following indicator that merges directional analysis with real-time volume behavior. By combining adaptive trend logic and volume overlays, it gives traders a detailed snapshot of market conviction and potential turning points. From instant trend shift detection to volume-weighted candle visuals, this tool brings deeper context to price movement. MT5 Version - https://www.mql5.com/en/market/product/136211/ Join To Learn Market Depth - https://www.mql5.com/
FREE

マルチタイムフレーム・サプライ&デマンド・ヒストグラム
説明:
マルチタイムフレーム・サプライ&デマンド・ヒストグラムは、強力で見やすいインジケーターで、H4およびD1の複数時間軸における市場の需給の強さを表示します。買い手と売り手が優勢なタイミングをヒストグラムで視覚化することで、トレーダーは重要な市場圧力ゾーンを迅速に特定できます。 主な特徴: H4およびD1ヒストグラム: 上位時間軸での市場の強さを明確に表示。 ヒストグラム変化アラート: 需給の変化時に通知(オプション)。 チャートの最小限化: 重要なシグナルのみを表示。 カスタマイズ可能な表示: 時間軸ごとにヒストグラムの表示/非表示、アラートは任意。 15分足推奨: デイトレードや短期スイングの設定に最適。 Ultimate Scalpers Zoneインジケーターとの併用で最適: 複数の確認を伴うエントリーに有効。 メリット: 高確率のサポート・レジスタンスゾーンを素早く特定。 複数時間軸の市場モメンタムを一目で把握。 アクティブトレーダーに明確で精度の高い、実践的なインサイトを提供。
FREE
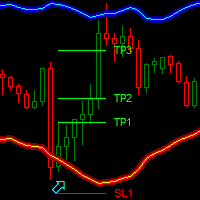
Dark Bands is an Indicator for intraday trading. This Indicator is based on Counter Trend strategy but use also Volatility. We can enter in good price with this Indicator, in order to follow the inversions on the current instrument.
Key benefits
Easily visible take profit/stop loss lines Reliable bands lines with futuristic colors, and Intuitive directional arrows Useful statistics , which indicate the win rate of the signals Plus Package available, leave a feedback to receive
FREE

無料でありながら進んだ製品の概要 Turbo Trendは、トレーダーが市場のトレンドを特定し、それに基づいて行動するのを支援する強力なインジケーターです。高度な移動平均とボリューム分析を組み合わせて、トレンドの方向に関する明確なシグナルを提供します。Turbo Trendは、明確な色分けされたラインとローソク足のハイライトを使用して、市場の状況を3つの異なる状態に分類することで、意思決定を簡素化します: 上昇トレンド 、 下降トレンド 、および中立トレンド。 mql5コミュニティで Koala Trading Solution チャンネル に参加して、すべてのKoala製品に関する最新情報を確認してください。参加リンクは以下です: https://www.mql5.com/en/channels/koalatradingsolution 他の優れた無料ツールを訪問する:FVGインジケーター: https://www.mql5.com/en/market/product/108907 Turbo Trend に基づいたEAは現在市場で利用可能です こちらで Turbo Tren
FREE
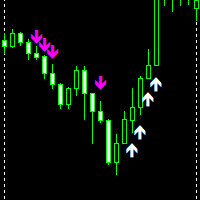
Up down Non-repaint is an MT4 indicator made to give accurate signals without disappearing. Magenta/Pink Arrow is your sell signal. white Arrow is your buy signal. indicator works on all pairs and timeframes 1 minute to Monthly timeframe. indicator is made for scalping do not hold trades for too long once arrows show the same direction you can add more entries all the best.!!
FREE

Crystal Smart Volume 概要 Crystal Smart Volume は、MT4 向けに開発された高度なボリューム(出来高)およびデルタ分析インジケーターです。
このツールは、通常の価格変動の背後に隠された機関投資家の取引活動を可視化することを目的としています。
Smart Money Concepts (SMC) 、 Volume Spread Analysis (VSA) 、および Delta ロジック を組み合わせ、価格とボリュームの動きを同時に分析します。
インジケーターは Buying Climax(買いクライマックス) 、 Selling Climax(売りクライマックス) 、 Weak Candles(弱いローソク足) 、 High-Volume Reversals(高出来高による反転) などのイベントを特定し、トレーダーが正確に相場の転換点を見極められるよう支援します。 また、 TBR(Trap Break Reversal) 、 STBR(Sweep Trap Break Reversal) 、 EVR(Engulf Volume Reversal
FREE
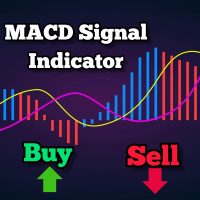
これはMACDに基づくトレンドフォローイングインディケーターで、200MAより上では買いのサイン、200MAより下では売りのサインを提供します。 MACDがゼロラインをクロスすると信号が生成されます。インディケーターはサポートとレジスタンスのレベルも表示し、これはストップロスとして使用できます。調整可能なパラメータにはMA期間、MACDの高速EMA、遅速EMA、サポートレジスタンスの間隔が含まれます。最近のローソク足の最低点と最高点にプロットされます。 デフォルトの設定: SR間隔:10 MA期間:200 Fast EMA:24 Slow EMA:26 アラーム機能も含まれています。 これらの値を変更すると、より頻繁または少ない信号が発生する可能性があり、最も効果的な構成を確定するためにテストすることが推奨されています。 1または4時間の時間枠が推奨されていますが、任意の時間枠で機能することができます。このインディケーターは、Forex、株式、商品などを含むすべての取引インストゥルメントで機能します。 他の製品もこちらでチェックしてください: https://www.mql5.com/
FREE

Special offer : ALL TOOLS , just $35 each! New tools will be $30 for the first week or the first 3 purchases ! Trading Tools Channel on MQL5 : Join my MQL5 channel to update the latest news from me Supertrend Fakeout インジケーターは、従来の Supertrend インジケーターを改良したバージョンで、より信頼性の高いトレンドシグナルを提供することを目的としています。 Fakeout Index Limit や Fakeout ATR Mult といった高度な機能を取り入れることで、このインジケーターは短期的な価格変動や市場ノイズによって引き起こされる誤ったトレンド反転をフィルタリングするのに役立ちます。 MT5バージョンを見る: Supertrend Fakeout MT5 その他の製品を見る: すべての製品 動作の仕組み Supertr
FREE
メタトレーダー4用 エリオット波動理論インジケーター エリオット波動理論インジケーターは、FX市場のプロフェッショナルな概念に基づいて設計されています。このインジケーターは、市場構造を波として描き、1〜5の上昇波・下降波としてピークをカウントします。これにより、ユーザーはエリオット波を視覚的に把握し、新しいナンバーが出た際にアラートを受け取ることができます。本インジケーターには2種類の波(メイン波とサブ波)があり、大きな波と小さな波を異なる色で表示することが可能です。ユーザーはそれぞれを有効または無効にすることもできます。 主な特徴 ダブル波動検出 : メイン波とサブ波を同時に識別し、市場の動きを総合的に可視化します。 自動波カウント : 高値・安値に基づき、1〜5の波を自動的にラベリングします。 カスタマイズ可能なパラメータ : メイン波とサブ波それぞれに対して、深さ、偏差、リトレースメントを個別に調整可能です。 アラートシステム : 特定の波数に達した際に通知を受け取ることができます。 インジケーター設定 履歴制限 : 処理する最大バー数 : 処理対象とする最大バー数を設定します(
FREE

このインディケータは、相場の反転ポイントを予測する最もポピュラーなハーモニックパターンを識別します。これらのハーモニックパターンは、外国為替市場で常に繰り返され ている価格形成であり、将来起こりうる値動きを示唆します。/ MT5無料バージョン
さらに、このインジケーターには、市場エントリーシグナルと、様々な利食いと損切りが組み込まれています。ハーモニック・パターン・インディケータは、それ自体で売買シグナルを発 信することができますが、他のテクニカル・インディケータを使用してこれらの シグナルを確認することをお勧めします。例えば、RSIやMACDなどのオシレーターを使用して、トレンドの方向性やモメンタ ムの強さを確認してから売買を行うことを検討するとよいでしょう。
このインディケータのダッシュボードスキャナ: ( Basic Harmonic Patterns Dashboard )
含まれるハーモニックパターン ガートレー バタフライ バット カニ サメ サイファー ABCD
主な入力 Max allowed deviation (%): このパラメータは、調和的パタ
FREE

PPRとEngulfing は、MetaTrader 4 (MT4)トレーディングプラットフォームの通貨チャートで「PPR」および「Engulfing」パターンを識別するために設計されたユニークなテクニカルインディケーターです。これらのパターンは、トレンドの反転や継続の可能性を示すことができ、トレーダーに市場へのエントリーとエグジットのための貴重なシグナルを提供します。 主な特徴: パターンの自動検出 : インディケーターは、PPRおよびEngulfingパターンを自動的に識別し、チャートに矢印でマークします。 視覚的シグナル : 緑色の上向き矢印は買いのポイントを示し、赤色の下向き矢印は売りのポイントを示します。 カスタマイズ可能な矢印の色 : ユーザーは、インディケーター設定を通じて、強気および弱気シグナルの矢印の色を選択できます。 モード選択 : 3つの動作モード - PPRのみ、Engulfingのみ、または両方のパターンを同時に分析します。 使用方法: チャートに追加 : インディケーターを希望する通貨ペアまたは金融商品のチャートに適用します。 シグナルを分析 : チャート上
FREE

基本ローソク足パターンインジケーターは、主要なローソク足パターンをこれまで以上に簡単に識別することができます。ハンマー、イブニング・スター、スリー・ホワイト・ソルジャーズ、その他多くのパターンをチャートを一目見るだけで発見できます。直感的なインターフェースと明瞭な視覚的手がかりで、取引機会を迅速かつ 正確に特定するのに役立ちます / バージョンMT5
このインディケータのダッシュボードスキャナー: ( Basic Candlestick Patterns Dashboard )
特徴 精度 : 主要なローソク足パターンを自動的に識別し、手動による検索を不要にします。 カスタマイズ : 自分の取引スタイルに合わせて、好みのパラメータを調整。
含まれるハーモニック・パターン 強気パターン Hammer Inverse hammer Bullish engulfing Morning star 3 White soldiers 弱気パターン Hanging man Shooting star Bearish engulfing Evening star 3 Black crow
FREE
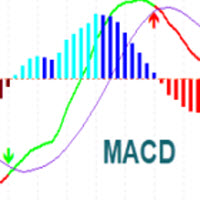
MACD Indicator It has MACD line, Signal line, and Histogram. The Histogram has 4 colors based on Direction Above and Below the Zero Line, showing its movement direction as simple as possible. Allows Show MACD & Signal Line, Show Change In color of MACD Line based on cross of Signal Line. Show Dots at Cross of MacD and Signal Line, Turn on and off Histogram. Enjoy your trading experience, and feel free to share your comments and reviews.
If you are interested in this indicator, you might
FREE

基本的なRenkoインディケータは、明確で簡潔な相場観を求めるトレーダーにとって強力なツールです。当社のインディケータは、トレンドの視覚化を簡素化するだけでなく、反転の正確なアラートを提供し、あなたの取引に戦略的な優位性を提供します / MT5無料版
特徴 フルカスタマイズ可能: 高度なカスタマイズオプションにより、インジケーターをお好みに合わせてカスタマイズできます。色からボックスサイズ設定まで、チャート上の情報表示方法を完全にコントロールできます。 反転アラート: 反転アラートで、市場の方向性が変化する可能性をいち早く知ることができます。これにより、利益を最大化し、損失を最小化するために、情報に基づいたタイムリーな意思決定を行うことができます。
入力項目 Size of the boxes: ボックスサイズ(ポイントベース) Bullish box colour: 強気ボックスの色 Bearish box colour: 弱気ボックスの色 Box opacity: 不透明度(0から100の間)。不透明度が低くなるにつれて透明度が高くなる Text col
FREE
本指標はSuperTrendの二次開発に基づいて、MA均線カスタムアルゴリズム、nrp、mtfの3つの指標を加重して機能を実現する組み合わせ指標を加えたものである。
バッチラインは2つの色に分けられています。オレンジ色は空いています。緑の代表が多いです。
SuperTrend指標は全ネット初の人工知能指数である。信号灯取引戦略。
人間の脳の不確定概念の判断、推理思惟方式を模倣し、モデルの未知または不確定な記述システム、及び強い非線形性、大きなヒステリシスの制御対象に対して、あいまいな集合と曖昧な規則を適用して推理し、横断的な限界または定性的な知識経験を表現し、人間の脳方式を模擬し、あいまいな総合判断を実行し、従来の方法では対処しにくい規則を推理する。型ぼかし情報問題。はっきりしないロジックは限界の不明瞭な定性的知識と経験を表現することに優れています。これは従属度の関数概念に助けを借りて、はっきりしない集合を区別して、はっきりしない関係を処理して、人間の脳を模擬して規則型推理を実施して、「排中律」の論理の破れから生じる様々な不確定な問題を解決します。
SuperTre
FREE
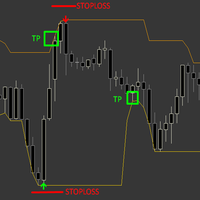
The Sure Reverse Channel is a dynamic non repaint trend indicator with entry arrows, the indicator focuses on catching a reverse swing in the market by using channel and price action formula, the indicator comes with built-in money management . HOW TO TRADE : Open buy trade when buy arrow pops up and set your SL below arrow, for TP you have TP which is opposite band. Open sell trade when sell arrow pops up and set your SL above arrow, for TP you have TP which is opposite band. band.
Why is
FREE

Simple QM Pattern is a powerful and intuitive trading indicator designed to simplify the identification of the Quasimodo (QM) trading pattern. The QM pattern is widely recognized among traders for effectively signaling potential reversals by highlighting key market structures and price action formations. This indicator helps traders easily visualize the QM pattern directly on their charts, making it straightforward even for those who are new to pattern trading. Simple QM Pattern includes dynamic
FREE

外国為替マーケットプロファイル(略してFMP) これは何ではありません:
FMPは、従来の文字コード化されたTPO表示ではなく、チャートデータプロファイルの計算全体を表示しません。また、チャートを期間に分割して計算しません。
それが何をするか:
最も重要なことは、FMPインジケーターは、ユーザー定義のスペクトルの左端とユーザー定義のスペクトルの右端の間にあるデータを処理することです。 ユーザーは、インジケーターの両端をマウスで引くだけでスペクトルを定義できます。 インジケーターの右端がライブバーに引き寄せられ、さらに(将来に)引っ張られると、インジケーターは「ライブ」と見なされます(新しいバーで更新されます) インジケーターは、アタッチされているチャートに「アンカー」オブジェクトをドロップし、その後、そのアンカーをハードドライブ上のファイルに関連付けます。 これにより、チャート(またはインジケーター)が閉じられるまで、再起動しても設定が維持された状態で、チャート上で継続的なFMPを実行できます。 FMPインジケーターは、1つのチャート上でそれ自体の多くのインスタンスを実行でき、
FREE

Title: SMC Structure for EURUSD Description: This indicator is designed to map market structures based on Smart Money Concepts (SMC). It identifies Swing Structure, Internal Structure, Order Blocks, and Fair Value Gaps (FVG). The tool is optimized for performance to manage resources efficiently on the MetaTrader platform. Key Features: 1. Market Structure Mapping Identifies Major Swing Structure with BOS (Break of Structure) and CHoCH (Change of Character). Displays Internal Structure to visual
FREE
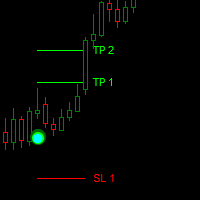
Dark Point is an Indicator for intraday trading. This Indicator is based on Trend Following strategy, also adopting the use of the atr to determine the right volatility. We can enter in good price with this Indicator, in order to follow the strong trend on the current instrument. If you love Dark Point, consider adding some power: Dark Power
Key benefits
Easily visible take profit/stop loss lines Intuitive directional points/arrows by colors Useful statistics , which indicate the win ra
FREE

The Market Sessions indicator is a popular tool among forex and stock traders for visually representing global trading sessions on a price chart. It highlights the time periods for major trading sessions — such as the Asian (Tokyo) , European (London) , and American (New York) sessions — directly on the chart. This helps traders identify when markets open and close, allowing for better decision-making based on session-specific trading behavior. - Asian Session (Default: 00:00-09:00) - Lo
FREE

A trend indicator based on the Hull Moving Average (HMA) with two periods. The Hull Moving Average is an improved variant of the moving average, which shows the moment of trend reversal quite accurately. It is often used as a signal filter. Combination of two types of Hull Moving Averages makes a better use of these advantages: HMA with a slow period identifies the trend, while HMA with a fast period determines the short-term movements and signals in the trend direction.
Features The movement d
FREE
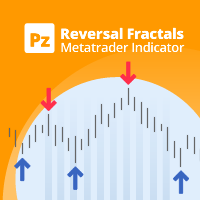
これは、ほぼ 10 年前に初めて公開された、私の有名な指標であるリバーサル フラクタルの最新版です。フラクタルの価格構造を調べて、市場で可能な反転ポイントを決定し、ファンダメンタルまたはテクニカル評価モデルをすでに持っているポジション トレーダーにタイミングを提供します。 [ インストールガイド | 更新ガイド | トラブルシューティング | よくある質問 | すべての製品 ] 反転フラクタルは長いトレンドを開始することができます インジケーターは非再描画です
あらゆる種類のアラートを実装します カスタマイズ可能な色とサイズ フラクタルは奇数のバーのフォーメーションであり、フォーメーションで最高または最低の中央バーであり、フラクタルのすべてのバーが閉じるとインジケーターが描画されるため、このインジケーターはリアクティブまたは遅延シグナルです。ただし、既存の方向性バイアスを持つトレーダーは、このインジケーターが非常に便利であり、初期のエントリーポイントを拾うことができます. このインジケーターは、煮詰めたシグナルインジケーターでも完全なトレーディングシステムでもありません。そのように評
FREE

It is FREE on EURUSD chart. All Symbols version! Contact me for any questions Introduction The breakout and retest strategy is traded support and resistance levels. it involves price breaking through a previous level. The break and retest strategy is designed to help traders do two main things, the first is to avoid false breakouts. Many false breakouts start with a candlestick that breaks out of a level but ends with an immediate candlestick that brings the price back into the level. The
FREE

Introducing our exciting new Price Retest indicator! Get instant alerts when the price retests, giving you a powerful edge in your trading strategy. Remember to do your own analysis before making any moves in the market. MT5 Version - https://www.mql5.com/en/market/product/118159/ Join To Learn Market Depth - https://www.mql5.com/en/channels/suvashishfx
Here’s a detailed explanation of how the Price Retest indicator works, its components, and how you can incorporate it into your trading str
FREE

MT4用 マーケットストラクチャーシフトとフェアバリューギャップ (FVG) インジケーター このMT4インジケーターは、市場構造の変化とフェアバリューギャップ(FVG)を特定し、トレーダーに潜在的な取引機会を提供します。モバイル通知を通じてこれらのイベントをユーザーに警告し、変化する市場状況に迅速に対応できるようにします。 主な特徴: 市場構造シフトの検出: スイング高値/安値のブレイクと、平均と比較して значительный なキャンドル本体サイズに基づいて、強気と弱気の市場構造シフトを識別します。チャート上の上/下矢印で視覚化されます。 フェアバリューギャップ (FVG) の識別: 過去3本のキャンドルの価格アクションに基づいて、強気と弱気のFVGを検出します。 FVGはチャート上で色付きの長方形で強調表示されます。 モバイル通知: マーケットストラクチャーシフトとFVG形成の両方に関するリアルタイムのモバイル通知を受信し、潜在的な取引設定を見逃さないようにします。 カスタマイズ可能なパラメータ: ルックバック期間 (Lookback Period): スイング高値/安値計
FREE
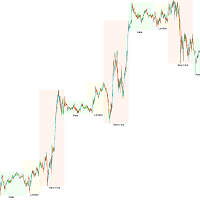
トレーディングセッション KillZone — マーケットタイミングの力を解き放つ
成功するトレーダーが知っている真実、それは「タイミングがすべて」ということです。各取引セッションには異なる活動レベル、ボラティリティ、チャンスがあります。これらを明確に把握し活用できるように、私たちは Trading Session KillZone インジケーター を開発しました。 このインジケーターはアジア、ロンドン、ニューヨークのセッションのアクティブ時間を強調表示し、市場が最も活発なタイミングを完全に把握できます。表示のカスタマイズも可能で、特定のセッションを表示/非表示、名前の追加・削除、色の変更、チャート上に表示する KillZone 数の設定などができます。 プロのヒント: KillZone トレーディングの力を最大限に引き出すには、適切なブローカーも必要です。そのため、私は IC Markets を推奨します。信頼できる ECN ブローカーで、超低スプレッド(0.0 pips〜)、高速約定、深い流動性を提供します。IC Markets なら、このインジケーターが示すチャンスを最
FREE

チャート上にフィボナッチレベルを手動で描画することにうんざりしていませんか?取引における主要なサポートとレジスタンスのレベルを特定する便利で効率的な方法をお探しですか?これ以上探さない! 自動フィボナッチ レベル を実行する究極の MetaTrader 4 インジケーターである DrawFib Pro の紹介 チャート上に描画し、これらのレベルを突破したときにタイムリーにアラートを提供します。 DrawFib Pro を使用すると、取引戦略を強化し、時間を節約し、より多くの情報に基づいた意思決定を行うことができます。 私のフィボナッチベースのインジケーター: WH Advanced Gartley Pattern MT4 || WH Price Wave Pattern MT4 主な特徴:
自動化 フィボナッチ描画. カスタマイズ可能 パラメータ. 正確な そして 信頼性のある. リアルタイム アラート. ユーザー フレンドリー インターフェース . DrawFib Pro は、チャート上でフィボナッチを自動描画するための効率的で信頼性が高く、使いやすい方
FREE
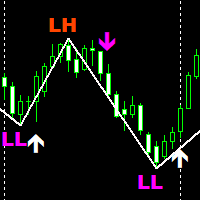
SMC Traders is a non-repaint indicator that is based on Price Action The indicator uses current market structure to predict future reversals. The indicator can be used with our free Market structure zig zag which can be found here: https://www.mql5.com/en/market/product/91579 Please note to find the HH AND HL CLINK ON LINK ABOVE Timeframes: 15 minutes for scalping 1 Hour for swing trading Purple Arrow look for sells in conjunction with LL White Arrow look for buys in conjunction with HL
FREE

説明(MT4)
このインジケーターは、ローソク足がボリンジャーバンドの外側に抜けた後に価格が再び内側に戻る「リエントリ」のタイミングを検出し、誤検出を減らすためにオプションで RSI による確認を組み合わせます。
Buy ReEntry シグナルは、価格が下側バンドの下に出た後に再び内側へ戻ったときに発生し、必要に応じて RSI がオーバーソールド(売られすぎ)状態から抜けたことを確認します。
Sell ReEntry シグナルは、価格が上側バンドの上に出た後に再び内側へ戻ったときに発生し、必要に応じて RSI がオーバーボート(買われすぎ)状態から抜けたことを確認します。
シグナルはチャート上に矢印で表示され、視認性を高めるために高値/安値の少し外側にオフセットして描画されます。 主な特徴 ボリンジャーバンドを手動計算(単純移動平均 + 標準偏差)。 有効なリエントリを確認するためのオプションの RSI フィルター(オーバーソールド/オーバーボートからの脱出)。 価格が外側に出た後にバンド内へ戻ることに基づく Buy/Sell ReEntry シグナル。 買いと売りで区別された矢印
FREE

"Ppr PA" is a unique technical indicator created to identify "PPR" patterns on the currency charts of the MT4 trading platform. These patterns can indicate possible reversals or continuation of the trend, providing traders with valuable signals to enter the market.
Features: Automatic PPR Detection: The indicator automatically identifies and marks PPR patterns with arrows on the chart. Visual Signals: Green and red arrows indicate the optimal points for buying and selling, respectively. Ar
FREE
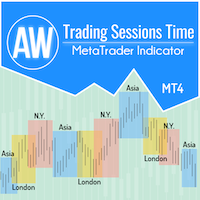
トレーダーが市場のパフォーマンスに関するデータを取得し、より適切な取引戦略を立てる際の利便性のために、当社は取引セッションインジケーターを開発しました。さまざまな取引所の営業時間は、市場活動や取引量に影響を与えるため、取引に影響します。これらの要因によって、さまざまな商品のボラティリティと取引機会が決まります。 AW トレーディング セッション インジケーターは、アジア、ロンドン、ニューヨーク市場の取引時間を表示します。トレーダーは、より良い体験のために、さまざまなタイム ゾーンを表示または非表示にすることができます。チャートでは、セッションの終了までの時間と、取引セッションのサイズを確認できます。チャート上のデータの表示には、さまざまなスタイルの取引チャートに適した柔軟なグラフィック調整機能があります。
その他の製品 -> こちら
利点:
アジア、ロンドン、ニューヨークの取引セッションを表示します。 必要に応じてセッションサイズを数字で表示します。 オンにすると、取引セッションの終了までの時間が表示されます。 取引セッションは個別に無効にすることができます。 チャート上のセッシ
FREE

Moving Average Convergence Divergence(MACD)トレーディング戦略は、勢いとトレンドの方向の変化を特定するために使用される人気のあるテクニカル分析ツールです。 MACDは、26期間の指数移動平均(EMA)から12期間のEMAを引いて計算されます。 MACDの上には、トリガーとして機能する9期間のEMAである「シグナルライン」がプロットされます。 MACDラインがシグナルラインの上にある場合、MACDはブルッシュ領域と見なされ、下にある場合はベア領域と見なされます。トレーダーはこの情報を使用して、潜在的な買いと売りの機会を特定することがよくあります。 MACDは多目的な指標であり、さまざまな方法で使用できます。一般的な使用方法のいくつかは次のとおりです。 クロスオーバー:MACDラインがシグナルラインを上回るときにはブルッシュクロスオーバーが発生し、MACDラインがシグナルラインを下回るときにはベアクロスオーバーが発生します。 ダイバージェンス:MACDが新しい高値をつけている間に基礎となるセキュリティがそうでない場合、ブルッシュダイバージェンスが発
FREE

MT5版 | Trend Monitor VZインジケーター | Owl Smart Levelsインジケーター | Owl Smart Levels戦略 | FAQ エリオット波理論は 、価格チャート上の波の視覚的モデルに依存している金融市場のプロセスの解釈です。 Valable ZigZagインジケータは、取引の決定を行うために使用することができる市場の波の構造を表示します。 Valable ZigZag indicatorはより安定しており、古典的なZigZag indicatorのように方向を変えることはなく、トレーダーを誤解させます。 これは、指標波の構築にフラクタルを使用することによって達成される。 Telegram チャット: @it_trader_chat 新しい Expert Advisor Prop Master - 取引ターミナルでテストしてください https://www.mql5.com/ja/market/product/115375
Valable ZigZagは、主にトレンド指標です 。 これは、トレーダーが取引すべき主な方
FREE
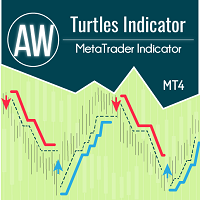
このインジケーターはタートル システムに従って機能し、古典的に 20 ローソク足と 55 ローソク足の時間間隔を想定しています。傾向は、指定された時間間隔にわたって監視されます。エントリーはサポートまたはレジスタンスレベルを下抜けた瞬間に行われます。出口シグナルは、同じ時間間隔のトレンドの反対方向への価格ブレイクアウトです。 利点:
金融商品: 通貨ペア、株式、商品、指数、暗号通貨 タイムフレーム: 古典的には D1、あらゆるタイムフレームでの作業にも適しています 取引時間: 24時間 資金管理戦略: 取引あたりのリスクは 1% 以下 追加注文を使用する場合、追加ポジションごとのリスクは 0.25% MT5 indicator version -> HERE / AW Turtles EA MT4 -> HERE / More products -> HERE エントリールール: 1) 短いエントリー: エントリー条件は20日間の高値または安値をブレイクアウトすることです。
前のシグナルが成功した場合、取引はスキップされます。
注記!以前の取引が利益で終了した場合
FREE

Auto Fibo は、手動での取引を強化するために開発されたインジケーターです。自動で黄金比を描き、時間を節約し、取引を円滑にします。 グラフにインジケータを取り付けると、自動的に正確な黄金比が描かれるので、臨界点を探す手間が省けます。 インターフェイスは、お使いのコンピュータに応じて、バンドのおおよそのハイポイントとローポイントに調整されます。 このインジケータは、ほとんどの始点と終点の選択ミスを修正します。 各バンドには、正確な価格が表示されます。 警告 私はMQL5.comで私のEAを販売するだけです。もし誰かが私のEAを売ってくれと連絡してきたら、それはあなたのお金が欲しいだけの詐欺師です。
また、もしあなたが私のEAを外部のウェブサイトから購入した場合、それは偽のバージョンであり、オリジナルのものと同じようには動作しないことを保証します。
FREE

1.需給は取引に使用されるコア戦略の1つである。それは古代の需給法則と自由流動市場における価格の動きに注目している。この戦略の基本は、利用可能なツールの数と購入者のツールに対するニーズが価格を決定することです。グラフには、需要が供給(需要領域)を圧倒し、価格上昇を推進する領域または供給が需要(供給領域)を圧倒し、価格下落を推進する領域が示されています。多くの需給トレーダーは、多頭または空頭頭頭頭頭頭頭寸に入る前に、これらの主要な売買活動が発生した地域に価格が入るのを待っている。 2.需要領域で購入し、供給領域で販売することは意味がありますが、再テストされた領域よりも新鮮な領域の方が効果的であることを覚えておいてください。これらは、継続的な傾向の進入領域として使用することも、変化傾向の逆転領域として使用することもできます。大胆に取引を行うことも、保守的に行うこともでき、取引ごとに独自の参入や脱退ルールがある。これらの規則に従ってグラフを作成するツールにより、ユーザーはグラフ上でこれらのレベルを直感的に認識することができます。 3.グラフのK線が黄色になると、価格は突破しようとしている。
FREE

The indicator analyzes the volume scale and splits it into two components - seller volumes and buyer volumes, and also calculates the delta and cumulative delta. The indicator does not flicker or redraw, its calculation and plotting are performed fairly quickly, while using the data from the smaller (relative to the current) periods. The indicator operation modes can be switched using the Mode input variable: Buy - display only the buyer volumes. Sell - display only the seller volumes. BuySell -
FREE
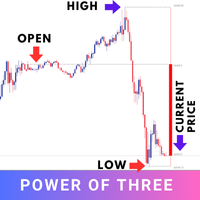
The "Power of Three" (PO3) is a concept developed by the Inner Circle Trader (ICT) to illustrate a three-stage approach used by smart money in the markets: Accumulation, Manipulation, and Distribution . ICT traders view this as a foundational pattern that can explain the formation of any candle on a price chart. In simple terms, this concept is effective for any time frame, as long as there's a defined start, highest point, lowest point, and end. MT5 - https://www.mql5.com/en/market/product/124
FREE
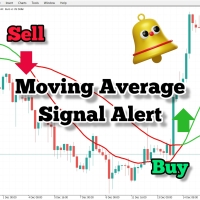
取引戦略で移動平均を使用している場合、このインジケーターは非常に役立ちます。 2つの移動平均がクロスするとアラートを提供し、音声アラートを送信し、取引プラットフォームに通知を表示し、イベントに関する電子メールも送信します。 独自の取引スタイルと戦略に適応するための簡単にカスタマイズ可能な設定が付属しています。
調整可能なパラメーター: 高速MA 遅速MA メール送信 音声アラート プッシュ通知
他の製品もチェックしてください: https://www.mql5.com/en/users/8587359/seller
それらに関する質問やフィードバックがある場合は、コメントを残すか、プライベートメッセージを送信してください。
成功した取引を!
FREE

RSI divergence indicator finds divergences between price chart and RSI indicator and informs you with alerts (popup, mobile notification or email). Its main use is to find trend reversals in the chart. Always use the divergence indicators with other technical assets like support resistance zones, candlestick patterns and price action to have a higher possibility to find trend reversals. Three confirmation type for RSI divergences: RSI line cross 50 level (doesn't repaint) Price returns to
FREE

Wave Reversal Indicator - determines the direction of trend waves and price reversals.
The indicator shows wave movements and trend directions. It gives recommendations where to follow the trader, helps to follow the trading strategy.
It is an addition to an intraday or medium-term strategy.
Almost all parameters are selected for each time frame and are changed automatically, the only parameter for manual adjustment is the wavelength.
Works on various trading instruments and timeframes, recomme
FREE

Trading doesn’t have to be complicated. With the right visual guidance, market decisions become clearer, calmer, and more confident.
Nebula Arrow is designed to help traders focus on what truly matters: high-quality entries based on refined market behavior. Just load it on your chart and let the arrows guide your trading decisions. Trade With Confidence We believe that simplicity is power. Nebula Arrow was created after extensive market observation and practical research, transforming complex
FREE

The Ultimate Trading Companion: Smart Trend Tracer Tired of getting lost in market noise? Ready to find the clearest trends with pinpoint accuracy? Introducing Smart Trend Tracer , the ultimate tool designed to cut through the clutter and reveal the most profitable market swings. This isn't just another indicator; it's your personal guide to spotting trends as they form, giving you the confidence to make smarter trading decisions. Smart Trend Tracer identifies significant highs and lows on your
FREE
MetaTraderマーケットはMetaTraderプラットフォームのためのアプリを購入するための便利で安全な場所を提供します。エキスパートアドバイザーとインディケータをストラテジーテスターの中でテストするためにターミナルから無料のデモバージョンをダウンロードしてください。
パフォーマンスをモニターするためにいろいろなモードでアプリをテストし、MQL5.community支払いシステムを使ってお望みのプロダクトの支払いをしてください。
取引の機会を逃しています。
- 無料取引アプリ
- 8千を超えるシグナルをコピー
- 金融ニュースで金融マーケットを探索
新規登録
ログイン