YouTubeにあるマーケットチュートリアルビデオをご覧ください
ロボットや指標を購入する
仮想ホスティングで
EAを実行
EAを実行
ロボットや指標を購入前にテストする
マーケットで収入を得る
販売のためにプロダクトをプレゼンテーションする方法
MetaTrader 4のためのテクニカル指標 - 43
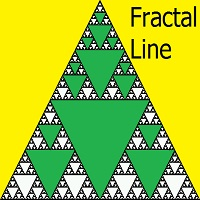
This indicator draws lines based on the standard Fractals indicator. Once a fractal is broken up or down, the indicator generates an alert, sends an email notification and a push message to your mobile phone.
User Inputs History - the number of bars in history for calculation. Color Up Fractal - the color of the upper fractal line. Color Down Fractal - the color of the lower fractal line. Width - the line width. Alerts - alert. EmailAlerts - email notification. NotificationAlert - push notifica
FREE

"Giant" is a flexible system in relation to trading strategies. It consists of two high-quality indicators that are installed on five different timeframes of the same currency pair (see screenshot). It monitors the trend and gives signals to open. The system passed a large number of checks and showed high accuracy. Indicators are sold separately. The second word in the main name is the indicator itself. This issue sells the indicator "Nicely" .
FREE

Binary Options Assistant (BOA) ICE Signals Indicator provides signals based on gkNextLevel Binary Options Strategy. Indicators: 2 Bollinger Bands & Stochastic
Stop missing trades, stop jumping from chart to chart looking for trade set-ups and get all the signals on 1 chart! U se any of the BOA Signals Indicator with the Binary Options Assistant (BOA) Multi Currency Dashboard .
All BOA Signal Indicator settings are adjustable to give you more strategy combinations. The signals can be seen
FREE

The indicator marks bars with a simple trend definition“ each subsequent high above/below the previous one and each subsequent low above/below the previous one ”. Charles Dow
Formula:
Max – The current maximum Min – The current minimum MaxK – Maximum per period MinK – Minimum per period Min>MinK & Max>=MaxK – Symbol on top Max<MaxK & Min<=MinK – The symbol on the bottom
Input parameter:
Number of bars in the calculated history Period for current timeframe The distance to the symbol Se
FREE
Template Toggle Indicator General Description The Template Toggle indicator is a custom tool for the MetaTrader 4 platform, designed to streamline the process of switching between predefined chart templates. It displays interactive buttons on either the main chart or a sub-window, allowing traders to quickly apply different templates without manually accessing the template menu. Ideal for traders who frequently switch between chart setups for various currency pairs or trading strategies. Key Fea
FREE

Trend Rising is a custom MT4 ( Metatrader 4 ) indicator, use best for scalping on TF M30 and below that analyzes the trend and momentum pattern using Bill William Indicators on multiple timeframes. As the result, It identifies the beginning and the end of the trend that works for most currency pairs. The Trend Rising indicator is developed based on Accelerator Oscillator and Awesome Indicator. Key Features Identify the beginning and the end of the trend as display with colors. Identify eas
FREE
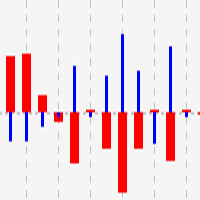
This indicator shows close to close price movements of the current symbol and an other as a histogram. It visualizes correlation between two symbols to help avoid counterproductive trading, diversify risk, etc. Attach it to the current chart as many times as many correlated symbols you want to take into consideration, and specify them in the OtherSymbol input field. The wide red histogram shows the movements of the reference (other) symbol, and the narrow blue histogram shows the movements of th
FREE

***IMPORTANT: This free indicator works with the paid for Strong Weak Forex Expert Advisor. The EA also depends on the following custom indicators: Strong Weak Heiken Ashi Strong Weak Symbols Strong Weak Values Strong Weak Indicator Download them for free in the Market. The EA will not work without it. These are all custom indicators which the Strong Weak Forex Expert Advisor relies on to generate trading signals. If you have any problems with installation send me a message.
FREE

The Bombay Stock Exchange Session's Hours
This indicator facilitates observing the currency pair's quotations during subsequent parts of the stock exchange session live. Before the session starts, a rectangle is drawn on the chart but not filled in with color. It means the extent of the session duration. Before the first bar enters the rectangle of the session, a sound signal or pop-up window will notify us that the session will just start. When the price graph crosses the edge of the session
FREE
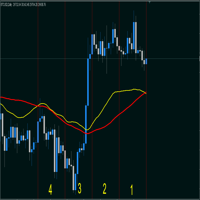
Индикатор суммируеn две средние скользящие, заданные в настройках и умножает на 2. (A + B)/2; Сдвиг на графике - смещает линию на графике.(ВАЖНО! учитывайте сдвиг на графике и сдвиг линии они суммируются, Т.Е. если смешение линий задано 50 и смещение на графике заданно 50 суммарно сдвинется на 100). Метод усреднения и тип цены классические как в средних скользящих. Период - колицество свечей для расчета. По умолчанию индикатор показывает среднею скользящию с периодом 26.
FREE
На графике EURUSD это БЕСПЛАТНО. Версия со всеми символами! Свяжитесь со мной по любым вопросам
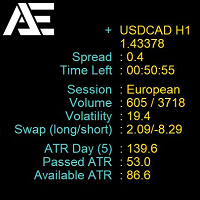
Market Info Display — это универсальный индикатор, отображающий важную рыночную информацию, организованную в удобном интерфейсе прямо на графике. Его функции рассчитаны на эффективное отображение данных, которые помогают трейдерам принимать взвешенные решения. Он предоставляет данные о текущем спреде, времени до закрытия свечи, текущей торговой сессии, объеме, волатильности, изменении цены за де
FREE

Индикатор рассчитывает волатильность относительно свечи заданной в настройках, в заданном диапазоне. period -диапазон для расчета максимум минимум. point - номер свечи от которой будет рассчёт (нуль текущая цена). По всем вопросам можно обратиться на сайте через форму обратной связи или в комментариях в ютюб. Также на сайте есть другие работы ссылка в индикаторе на вкладке общее .
FREE
StrxInfoPanel is an essential tool for every trader It gives you an immediate idea about your account and realtime informations about the current symbol and timeframe you are analyzing Every information line can be hidden and shown via parameters, even panel position can be changed via input parameters Parameters list: Corner : the screen corner where you want the panel to be shown Left, Top, and Width : customizable position and panel dimensions BgColor : background color Show XXX : every infor
FREE

Индикатор сглаженного Moving Average (xMA)
Входные параметры: xMA Period - период усреднения xMA Method - метод усреднения ( 0-SMA | 1-EMA | 2-SMMA | 3 - LWMA) xMA Price - используемая цена ( 0 - CLOSE | 1 - OPEN | 2 - HIGH | 3 - LOW | 4 - MEDIAN | 5 - TYPICAL | 6 - WEIGHTED) xMA Color - цвет индикаторной линии xMA Width - толщина индикаторной линии
Принцип работы
Индикатор перерассчитывает стандартный технический индикатор Moving Average (дважды усредняет получаемые значения iMA). Период с
FREE

Индикатор сглаженных Bollinger Bands (xBB)
Входные параметры: xBB Period - период усреднения xBB Price - используемая цена ( 0 - CLOSE | 1 - OPEN | 2 - HIGH | 3 - LOW | 4 - MEDIAN | 5 - TYPICAL | 6 - WEIGHTED) xBB Deviation - отклонение xBBColor - цвет индикаторных линий xBB Width - толщина индикаторных линиц Принцип работы
Индикатор перерассчитывает стандартный технический индикатор Bollinger Bands (дважды усредняет получаемые значения iBands). Период усреднения индикатора соответствует двой
FREE

This indicator compares the price changes during the specified period for the current symbol and other reference symbol. It allows to analyze the similar movements of highly correlated symbols, such as XAUUSD and XAGUSD, and find their occasional convergences and divergences for trading opportunities. The indicator displays the following buffers: light-green thick line - price changes of the current symbol for TimeGap bars; light-blue thin line - price changes of the reference symbol ( LeadSymbo
FREE
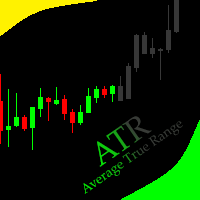
This indicator allows to hide ATR oscillator (on all MT4 timeframes) from a date define by the user, with a vertical line (Alone) or a panel (with "Hidden Candles"). Indicator Inputs: Period Information on "Average True Range" indicator is available here: https://www.metatrader4.com/en/trading-platform/help/analytics/tech_indicators/average_true_range ************************************************************* Hey traders!! Give me your feeds! We are a community here and we have the same
FREE

It is a very simple and useful micro indicator. Shows the current ask price, and the maximum relative ask price up to the current moment, on the chart, in the first N candles. It facilitates quick decision making by offering a visual reference. Likewise, when we position ourselves with the cursor over it, it shows us the maximum spread since the indicator is applied, until the current moment. It is perfect for scalping . By default, the parameter N has the value 4.
Especially recommended indi
FREE
NearONE displays the average value of the price deviation in points for a specified period in a subwindow of a selected trading instrument.
Inputs : DRAWs - number of bars to display the indicator; NearPeriod - indicator period.
If NearPeriod is 0 , recommended periods are used for each chart timeframe.
If NearPeriod = 0: M1 timeframe - period = 60 ; M5 timeframe - period = 48 ; M15 timeframe - period = 96 ; M30 timeframe - period = 192 ; H1 timeframe - period = 96 ; H4 timeframe - period = 3
FREE

Nombre del Indicador: Two Lines Color II Descripción: El indicador "Two Lines Color II", desarrollado por 13 Crow Trading Club, es una versión más rápida de su predecesor, el "Two Lines Color 1". Este indicador ha sido diseñado para brindar señales aún más tempranas sobre posibles cambios de tendencia en el mercado financiero. Características Principales: Mayor Velocidad de Señales: Two Lines Color II ofrece señales más rápidas en comparación con su versión anterior. La rápida velocidad de las s
FREE

This is a trend following indicator that identifies optimal entry points in the direction of a trend with an objective stop loss to manage the trade. The indicator allows you to catch trend early and ride it. The Indicator draws resistance line as it detects an Uptrend and draws support line when it detects a Downtrend on the chart. When those levels are broken, that allows you to identify the Trend Direction and Momentum in the direction of prevailing trend which offers optimal entry points in
FREE

An indicator showing volumes with the addition of four moving averages of these volumes. What is this indicator for? When analyzing the Forex markets, metals, indices on the H1, H4 charts, at the beginning of the day and at the end of the trading day according to server time, the volumes are less than in the middle of the day. This indicator was created for this. It will help you compare trading volumes within the day. The indicator is distributed as is. Tags: Volume, Custom Volume, MA, Custom M
FREE
The indicator shows the current timeframe and symbol name. It is also possible to turn on the indication of time until the end of the current bar. In the settings, you can specify: - the location of the indicator in relation to the terminal window, top left, top right, bottom left and bottom right - a row of text display arrangements so that the inscriptions do not overlap each other - color - font - font size.
FREE

***IMPORTANT: This free indicator works with the paid for Strong Weak Forex Expert Advisor. The EA also depends on the following custom indicators: Strong Weak Heiken Ashi Strong Weak Parabolic Strong Weak Values Strong Weak Indicator Download them for free in the Market. The EA will not work without it. These are all custom indicators which the Strong Weak Forex Expert Advisor relies on to generate trading signals. If you have any problems with installation send me a message.
FREE

Utility for show on charts the visual informations about: - a vertical line at start of each bar of selected timeframe - a vertical line at start of each day - a vertical line at start of each week - vertical lines at start / end of trading sessions selected - bid / ask prices, spread, money value for each point (of 1 standard lot) and last tick time recived" You can enable / disable each information and set the color for each line
FREE
This indicators when combine with its slave version can help you a better view in backtesting visual mode. https://www.mql5.com/en/market/product/61574 They will help you in developing a multi time frame trading strategy. 1) Run backtest in visual mode 2) Add the master indicator to the backtesting chart 3) Add the slave indicators to other charts of the same symbol with different time frames. Run the backtest and you will see all the charts auto scrolling.
FREE
Your attention is invited to the indicator Price Action Indicators. It doesn't need settings. And also it is not tied to more than one indicator, which makes it not vulnerable to different accounts or brokers.
Add one setting PERIOD
Regards, Mikhail
Вашему вниманию предлагается индикатор Price Action Indicators. Ему не нужны настройки. А также он не привязан не к одному индикатору, что делает его не уязвимым перед разными счетами или брокерами.
С Уважением Михаил
FREE
Добрый День, Всем. Решил выложить свой индикатор, предложить на просмотр. Я трейдер, Вадим Сергеевич Лепехо. Индикатор не стандартный, сделан не по канонам. Индикатор рисует маржинальные зоны на графике, пока полет нормальный. Но строит зоны по индикатору AO(Awesom) конкретней по фрактальным зонам индикатора AO. Зоны стандартные 1/4, 1/4, и НКЗ. Пример привожу по EURUSD + в картинках. На данный момент 14.10.23 - нкз=1920 пипсов(192 пункта) предлагаю преобразить до 192пипсов(19.8пунктов). Поясняю
FREE

In the indicator there are EUR, USD, CAD, AUD, NZD,JPY, GBP ,CHF.
The Currency Index Project is Forex study. Many people do not know the theoretical basis that drives currency exchange rates to move on the market. With this set of tools you will be able to have a more complete view of the entire market by analyzing not only the single currency of an exchange, but all the exchange rates that make up that currency by looking at a single window! The study assumes that all forex currencies are lin
FREE

Do you use dynamic ranges (like Bollinger Bands or Envelopes) in your trading? A fixed period is usually used for such calculations. But is such approach relevant to the very nature of the market? In fact, the price chart consists of a series of successive processes - trends and flats. In this case, we can talk about the internal development logic inside a single process only. Therefore, the nature of the market is better described by dynamic ranges designed for the processes occurring "here and
FREE
This indicator is a tool to measure the relative strength of different currency pairs. It used a user selected base currency as a comparing standard, and evaluate all other major currencies base on their relative strength/weakness. the stronger one currency compare to the base currency, the higher its value. Base currency has a fix strength value of 50.
Indicator parameters Strength Period - Change the strength period in the settings affects the number of bars used for calculation. The higher t
FREE

This indicator shows the strength of each currency compared to the US dollar by calculating the rate of change in price over a specified time period. When you open the indicator, you'll see a list of different currencies on the price chart. Each currency will have a numerical value indicating its strength level compared to the US dollar, where: If the value is higher than the US dollar, it will be displayed in green, meaning that currency is stronger than the dollar. If the value is lower than
FREE

Market Dashboard FREE Indicator gives you advanced information’s about your selected Symbols in MarketWatch
Features
Daily Price Movements (M1 – D1) RSI Values with Highlight Function for your current Timeframe & H1 & H4 Profit per Symbol and traded lots (buy & sell) EMA 5 – 100 based on selected period Swap Information (which direction is positive) FIBO Info & Tracking (highlighted FIBO Levels close to current price – based on selected period) One Click ChartOpen this Version is limited to 2
FREE

The indicator calculates the current spread for each tick using the formula Spread=(ASK-BID)/Point. Schedule of changes in the boundaries spread over the timeframe displayed in a separate window from the date of accession of the indicator. Two lines corresponding to the minimum and maximum spread values are displayed. The indicator window is self-adjusted according to the minimum and maximum values from the moment of launch. The minimum and maximum values for the entire period of the indicator o
FREE

An indicator in the form of a panel for collecting statistics on spreads from a specified list of pairs. It is enough to open one chart and set an indicator to collect statistics for all specified pairs.
After completion of work, the panel writes values to a file, which allows not to interrupt statistics after completion of work.
Input parameters:
-Interval to update the spread for pairs (sec) Allows you to specify how often to collect statistics (allows you to reduce the load) -List of pair
FREE
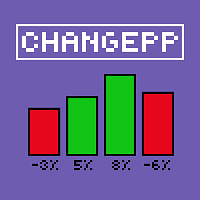
About the ChangePP indicator
The ChangePP indicator displays the percentage price change for the selected period according to the selected parameters and builds the corresponding bars in the indicator subwindow.
Clicking on a bar or pair name opens the corresponding chart with the period specified in the input parameters.
Without a doubt, the ChangePP trading indicator will be useful for traders using the correlation of currency pairs, as well as for analyzing the situation on the market.
FREE

Current Pips and Money Profit This indicator displays the results of the currently open position on the graph. Result in pips and in the invoice currency. Thanks to this, you can enlarge the chart to the entire screen and have control over the result of trading without opening a terminal window which takes a space of a screen. The display positions of this data can be adjusted at the user's discretion and colors also.
FREE

The Stock Exchange One Sessions Hours version 2.00
This indicator facilitates observing the currency pair's quotations during subsequent parts of the stock exchange session live. Before the session starts, a rectangle is drawn on the chart but not filled in with color. It means the extent of the session duration. Before the first bar enters the rectangle of the session, a sound signal or pop-up window will notify us that the session will just start. When the price graph crosses the edge of the
FREE

1、能显示货币之间的强弱 0是最弱 7是最强 2、能显示28个货币以及黄金 原油的 涨跌幅度 3、能切换货币对 4、能显示持仓订单的货币对 1、能显示货币之间的强弱 0是最弱 7是最强 2、能显示28个货币以及黄金 原油的 涨跌幅度 3、能切换货币对 4、能显示持仓订单的货币对 5、能利用键盘的的上下键切换货币对,左右键切换周期 1、能显示货币之间的强弱 0是最弱 7是最强 2、能显示28个货币以及黄金 原油的 涨跌幅度 3、能切换货币对 4、能显示持仓订单的货币对 5、能利用键盘的的上下键切换货币对,左右键切换周期 5、能利用键盘的的上下键切换货币对,左右键切换周期 1、能显示货币之间的强弱 0是最弱 7是最强 2、能显示28个货币以及黄金 原油的 涨跌幅度 3、能切换货币对 4、能显示持仓订单的货币对 5、能利用键盘的的上下键切换货币对,左右键切换周期
FREE
红黄绿简明指示趋势与震荡指标升级版。 使用红黄绿三色来标示上升趋势 、震荡、下跌趋势。 红色表示空头趋势(下跌)。 绿色表示多头趋势(上涨)。 黄色表示震荡区域。 从黄色转变为红色时,行情可能从震荡转变为下跌趋势。一段连续的红色,说明下跌趋势很强。 从黄色转变为绿色时,行情可能从震荡转变为上升趋势。一段连续的绿色,说明上升趋势很强。 指标的上半部分区域和下半部分区域若同步为红色,表明下跌趋势已经形成共振,接下来大概率走出一段空头趋势。 同时,红绿黄分为上下两部分:
若上下部分同时为绿色,表明上涨趋势已经形成共振,接下来大概率走出一段多头趋势。 若上下部分同时为红色,表明下跌趋势已经形成共振,接下来大概率走出一段空头趋势。
若上下同时为黄色,表明当前行情为震荡。 升级版2.0: 新增两条快慢线。 当慢线(Blue/Red线)为蓝色时,视为多头行情。当慢线为红色时,视为空头行情。 当快线(DarkGray线)从下方向上穿过慢线时,作为参考做多信号,激进交易者可进场做多。反之亦然。
参数可调。 //+---------------------------------------------
FREE
CoralPage is a simple little utility to add navigation controls to your chart. You can now easily step through the symbols in the Market Watch without having to click-and-drag a symbol from the Market Watch onto your chart. It's a simple but indispensable time-saver! Click move to the first, previous, next or last symbol in the Market Watch. Shift-click to go the the previous or next symbol that has an open order. CoralPage is completely free. If you like this, please check out my other prod
FREE
Утилита предназначена для упрощения графического анализа.Настроив один раз , можно сохранить в шаблон,все настройки сохранятся.В настройках меняются уровни фибоначчи , цвета,стили и толщина линий также текстовые метки на кнопках.Есть возможность расширить функционал , добавить временные зоны Фибоначчи ,Фибо арки ,линии по углу ,продление прямоугольных зон до текущей цены.Присылайте рекомендации,все можно осуществить в рамках бесплатной утилиты.
FREE
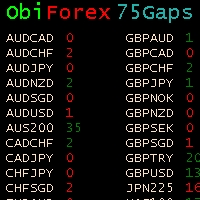
Gaps Size 75 - Market Gap Indicator The Gaps Size 75 indicator reveals the gaps between the current day and the previous day, aiding your trading decisions. It is designed for the "END OF WEEK GAPS" strategy, allowing you to identify potential opportunities. This indicator supports up to 75 currency pairs, with additional pairs available upon request. The columns are color-coded for easy interpretation. For inquiries regarding the weekend gaps strategy, kindly send a private message. Gaps Size 7
FREE

This indicator shows the value of returns in the selected time frame .
They are calculated as logarithm of returns , rather than price or raw returns. For small returns, arithmetic and logarithmic returns will be similar. The benefit of using returns, versus prices, is normalization. It is possible measures all variables in a comparable metric despite originating from price series of unequal values.
Inputs You can display data both as a Histogram or a Line It's also possible to display th
FREE

Alert TIME LINE indicator warns that the price has reached a specified time level.
Drag the indicator onto the chart, press the SET TIME LINE button, move the line that appears to the desired time, when the chart reaches the specified time, an alert will be triggered.
This indicator is used as an auxiliary tool when trading time zones, using the free TIME LINE Forex System , see the results and screenshots below.
You can get the system for free in the technical support chat https://t.me/Cycl
FREE

This is a very fast and not redrawing ZiGZag; it supports switching the segments at breakouts of price levels located at a specified distance (H parameter) from the current extremum. MinBars parameter sets the depth of history for drawing the indicator; 0 means drawing on the entire history. SaveData parameter allows writing the coordinates of extremums to a file (time in the datatime format and price). Some statistics calculated on the basis of the ZigZag is displayed in the form of comments.
FREE

Candle Timer displays the time remaining until closing the current Bar, and a new bar forms.
Feature simple to use . no lag or delay . customize position, color & font Size . server time not local time.
Inputs
- position * Beside Active Candle ( Default ) * Right Upper * Lift Upper * Right Bottom * Lift Bottom - font size * 14 (Default) - color * SpringGreen (Default)
FREE

インジケーターには、現在のサーバー時間と、現在のバーがチャート上で閉じるまでの時間が表示されます。 情報は、トレーダーが取引セッションを開始するために、ろうそくが閉じるのを待っているときに、ニュースリリースの瞬間に非常に便利です。 フォントサイズと色は、チャートテンプレートに合わせて調整できます。
設定: テキストの色-表示テキストの色 テキストサイズ-表示テキストのサイズ
あなたが指標について肯定的なフィードバックを残すなら、私は非常に喜んでいます。 あなたの武器で見たい他の指標やその他のツールを議論に書いてください。 新しいロボットの更新とリリースを逃さないように友人として私を追加-> Dmitrii Korchagin
市場で私の他の製品を参照してください-> 私の製品
私のロボットはすぐにリリースされますが、その間に、それがどのように取引されるかを見てください-> Hewer Signal
FREE

The block of bars is collected under condition of divergence . If the divergence conditions are not met, the block is deleted. More precisely, the condition is the transition of the block of bars from the state of divergence to the state of convergence . Blocks are formed selectively with gaps. Gaps are characterized by the state of convergence of bars. Before removing the block, we find the extreme bars inside the block (min, max). The line connects the extreme bars. The line is drawn only
FREE
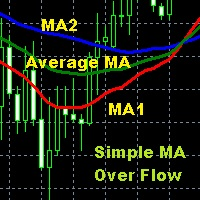
Moving Average is one of the indicators that is widely used in technical analysis which can help to smooth price movements by eliminating some price fluctuations that are less relevant based on past price calculations, so that an average line of price movements is formed within a certain time period. Simple Moving Average Over Flow is an indicator writen by MQL$ language that is given a special additional moving average line based on certain calculations so as to make this moving average better
FREE
In addition to the MA of the set period, the MAs of the two higher timeframes with the same period are displayed on the chart simultaneously (though in a simulated way). No matter which timeframe you switch to, it will display the MA for that timeframe as well as the MAs for the two higher timeframes. Additionally, it will show the 200 MA as well!
To display the MA for the higher timeframes on the current chart, you need to set the MA calculated using the Moving Average indicator. If you try to
FREE

Индикатор пригодится тем, кто использует кластеры Фибоначчи в торговле и применяет построения с разными наборами уровней. Каждый набор уровней применителен как к уровням Retracement , так и к Expansion (выбирается в настройках). Уровни задаются перечислением в формате "0;50;61.8;100". Настройки индикатора: Fibonacci #1 – Набор уровней #1 Fibonacci – Тип уровней : Retracement или Expansion Levels – Набор уровней в формате "0;23.6;38.2;50;61.8;100" Color line – Цвет линии Style line – Стиль линии
FREE
This indicator allows to hide Bill Williams Alligator (on all MT4 timeframes) from a date define by the user with a vertical line (Alone) or a panel (with "Hidden Candles"). Indicator Inputs: Jaws Period Jaws Shift Teeth Period Teeth Shift Lips Period Lips Shift Method Apply To Information on "Alligator" indicator is available here: https://www.metatrader4.com/en/trading-platform/help/analytics/tech_indicators/alligator ************************************************************* Hey traders!
FREE

Based on a combination of indicators, E13 Acid Fulx is an excellent indicator for knowing when to buy or sell on any asset and temporaryity. The indicator myself I have used it as a tool for my analysis when trading Forex. It is a useful and easy-to-understand trend indicator. If you combine it with your own analyses you will surely get a good result in your operation.
FREE

This indicator allows you to find out how much the price can pass on the current bar. It looks for the average ATR value for the previous 5 bars and draws 2 price boundaries. You can use it on any timeframe of any instrument.
Based on this indicator, you can set stop loss and profit levels, as well as use it in other good strategies.
Do not forget to use risk management while trading!
FREE

Note: this product is a free limited version of the full featured product Currency Timeframe Strength Matrix . It only includes AUD, CAD, CHF currencies instead of all 8 currencies. It includes only 5S, 1M, 5M time frames instead of all 8 (5S, 1M, 5M, 15M, 30M, 1H, 4H, 1D).
What is it? The Currency TimeFrame Strength Matrix is a simple and comprehensive Forex map that gives a snapshot of what is happening in the Forex market at the very present time. It illustrates the strength and momentum ch
FREE

Bigger chart labels would allow the user to be entirely aware of which chart he/she is on. Each chart window is unique, containing different patterns and economic motives so acknowledging the chart window would be absolutely essential! There are well known Economic Time Zones included in clear view, by choice! Simple does it! Use your computing mouse scroller, clicking with the right finger on the label, in order to customize the label properties. From there, choose your preferred color, fon
FREE

The indicator can help traders to assess in advance the number of Lots, Balance and Equity, if the price deviates from the current levels. The indicator will be useful for those who trade using Martingale.
Features The indicator belongs to the category of risk management. The indicator helps to assess in advance the account change that would happen in case of possible price change from the current value to a threshold. It also recalculates swap, lock, pending orders, take profit and stop loss.
FREE

This is Demo version of PipsFactoryWeekly This indicator depends on High and Low price of Currency in last Week and then i made some secret equations to draw 10 lines.
Features: You will know what exactly price you should enter the market . You will know when to be out of market. You will know you what should you do in market: Buy Sell Take profit and there are 3 levels to take your profit Support Resistance Risk to buy Risk to Sell
Signal Types and Frame used: You can use this indicator just
FREE

Currency Strength Matrix (CSM) is an indicator that will show you the current strength of the major currencies in several timeframes allowing you to sort the currencies for strength and spot possible trading setups. This indicator is ideal for scalping and in all those events of sudden big moves. This DEMO only shows 4 currencies and 4 timeframes, for the full version please check https://www.mql5.com/en/market/product/24252
How does it work? The CSM compares the value of the current moving ave
FREE

Support/Resistance Percent Rank
SR Percent Rank helps to see how many times the current close price has been in the past price range. SR Percent makes a loop over x bars into the past and calculates the percentage of times the current closing price has been between the high and the low price in the x bars before that. So we can determine if the current price is moving at supports or resistance that was formed in the past. I use the indicator when creating strategies with the StrategyQuant X pr
FREE

Follow the trail of the comet to know the development of the trend. This indicator helps you to determine the evolution of the price depending on how these astronomical objects are shown in the chart. When the comet seems to stop, it opens its tails considerably and warns us of a possible change in trend. On the contrary, when it seems to get speed (looks thin because lines of tail are grouped) demonstrates safety and continuity in trend. The head or comet nucleus will show red or green accordin
FREE

Fast T3 MA Trend indicator derived from T3 moving averages. This indicator is part of the T3 Cloud MA indicator and is posted here on its own. Buying/Selling opportunities above/below line. The MA line can also be used as dynamic support/resistance for more aggressive entries. Use default values for best settings. The number of look back bars is user defined. This indicator can be used in combination with other strategies such as price action. Suitable for all time frames.
FREE
指标功能:完成十字光标跟随,多个窗口鼠标位置的同步显示。 功能 开启 :点击"H"标签,标签变成"S",开启十字光标,通过鼠标点击,完成第二个以上窗口的位置同步。 可以大周期同步小周期 (注意:在大周期同步小周期时,要注意小周期中的数据是否足够多) , 也可以小周期同步大周期。 功能关闭:点击 "S"标签,会变成"H"。或者通过键盘的"ESC"键,关闭。
指标可以多个窗口加载,也可以单窗口加载。
参数设置: LabWindow:标签显示的窗口 LabConer :标签显示的角落位置 LabX :标签位置横坐标 LabY :标签位置竖坐标 LabShowBackup :标签背景显示于背景 LabFontName :标签的字体名称 LabFontSize :标签的字体大小
FREE

Forex trading support timer: - This is an indicator that supports a trader's trading process. - Before placing a BUY or SELL order, it is advisable to observe what the current time is like, to get the best position when trading. Function of indicator: - Display information about candle closing time of different timeframes (M1,M5,M15,H1), best used when Scalping. - Show market spreads. - Show TimeZone Trading. - Displays the remaining time of a session.
FREE

Acceleration/Deceleration Technical Indicator (AC) measures acceleration and deceleration of the current driving force. This indicator will change direction before any changes in the driving force, which, it its turn, will change its direction before the price. If you realize that Acceleration/Deceleration is a signal of an earlier warning, it gives you evident advantages. But, a classical AC indicator does not include any input parameter. In the source file we can see that this indicator are us
FREE

Introduction The ST Cross indicator is based on the traditional Moving Average (MA) Cross which uses a fast and slow moving average. Entry signals to buy and sell are given when both moving averages cross. However with the basic strategy there are a lot of false signals. In order to filter the trades we use the 200 (MA) to identify the overall direction of the trend. Input Settings Master Trend Period - 200 Period moving average used to get the trend direction. Fast
FREE

The indicator shows the current situation on 16 indicators and 10 strategies.
Its values are formed based on the evaluation of the specified criteria for each strategy separately.
As a result, we can observe on the chart the strength of all the indicators included in it, as well as additional logic. Advantages: Signals do not redraw their values. The arrow is drawn after confirmation. All types of alerts. Shows weak zones based on the evaluation results. The passing value of the score is dete
FREE

Dark & Light Themes for MT4.
The Dark & Light Themes indicator helps you switch the MT4 chart display between dark and light color schemes. It also includes a watermark showing the current currency pair (symbol) and the active timeframe.
This simple and clean interface makes it more comfortable for traders to analyze charts using any indicator.
FXDragunov Indonesia.
FREE
MetaTraderマーケットは、履歴データを使ったテストと最適化のための無料のデモ自動売買ロボットをダウンロードできる唯一のストアです。
アプリ概要と他のカスタマーからのレビューをご覧になり、ターミナルにダウンロードし、購入する前に自動売買ロボットをテストしてください。完全に無料でアプリをテストできるのはMetaTraderマーケットだけです。
取引の機会を逃しています。
- 無料取引アプリ
- 8千を超えるシグナルをコピー
- 金融ニュースで金融マーケットを探索
新規登録
ログイン
