YouTubeにあるマーケットチュートリアルビデオをご覧ください
ロボットや指標を購入する
仮想ホスティングで
EAを実行
EAを実行
ロボットや指標を購入前にテストする
マーケットで収入を得る
販売のためにプロダクトをプレゼンテーションする方法
MetaTrader 4のためのテクニカル指標 - 136

デモバージョンは役に立ちません。点滅する数字を見ても何も理解できません。これはダッシュボードです。コンセプトを理解しようとし、残りは私がすべてお手伝いします。
シンボルはカンマ(,)で区切り、ブローカーが表示する形式に正確に従ってパラメータに入力する必要があります。これにより、ダッシュボードで認識されるようになります。これらのシンボルはインジケーターによる分析に使用されます。
ワンクリックで、ダッシュボードから任意の通貨ペアやタイムフレームを直接開くことができます。
MA Speedometer Dashboard は、MetaTrader 4 (MT4) 向けに設計された非常に機能的なインジケーターで、動的な市場分析を通じてトレード戦略を強化します。このダッシュボードは、市場トレンドを特定し、レンジ相場で取引し、フラットな市場状況からの退出を支援する強力な機能を提供します。さらに、特別ボーナスとして、MA Speedometerインジケーターの特別バージョンが提供され、MA Speedometer Dashboardの基盤として機能します。
主な特徴:
トレンド分析:ダッ

Features:
Waddah Trend, Explosion Increase/Decrease Trend Percentage with Threshold DeadZone Trend Direction Aligned Checks Highlight and Alerts Multi-Timeframe & Multi-Currency Check out the blog post for more info: https://www.mql5.com/en/blogs/post/758020
With customizable threshold, you can identify best trading opportunities in volume-based trading. Use Trend Height (x times Explosion): Trend height in relation to the explosion signal Trend Percent: Compares the trend height to the maximu

Auto Multi Channels VT Ещё один технический индикатор в помощь трейдеру. Данный индикатор, автоматически показывает, наклонные каналы в восходящем,
нисходящем и боковом движении цены, т.е. тренды. (Внутри дня. Среднесрочные и долгосрочные, а также Восходящие, нисходящие и боковые).
О понятии Тренд. На бирже, трендом называется направленное движение ценового графика в одну из сторон (вверх или вниз) . То есть, тренд в трейдинге — это ситуация,
когда цена определенное время возрастает или сниж

Introducing the Ultimate Horizontal Line Alert Indicator for MT4! Transform your trading with the smartest tool in the market. Our Horizontal Line Alert Indicator isn't just any indicator — it's your new trading partner that combines precision, flexibility, and intuitive control. What Does It Do? This revolutionary MT4 indicator automatically adjusts trend lines to be horizontal with just the press of the 'L' key. It’s perfect for traders who want to focus on specific price levels, ensu
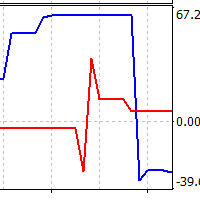
Two lines are being drawn in a separate window. And both are representing an angle of a trendline. One trendline is measured going across two price highs, but the other is measured across two lows. You get to choose the period from which the first price high and first price low is being determined. The second high and low comes from identical time period preceding the first one. Feel free to experiment with the period count until you get the confirmation you are looking for.

TrendWave Oscillator is an advanced MT4 oscillator that not only identifies the trend direction but also provides visual and audio alerts to enhance trading strategies.
Key Features: - Color-coded trend indication: - Blue : Indicates an uptrend, signaling potential price growth. - Orange : Indicates a downtrend, suggesting possible price decline. - Gray : Represents a flat market or lack of clear entry signals.
- Graphical signals on the chart : - Aqua : Highlights an uptrend, emphasi
The presented indicator, based on the volatility readings of a financial instrument plots dynamic S/R levels on the price chart. The indicator determines the trend and points to possible entry points formed by local highs/lows. The indicator allows you to notify the user of its signals by sending messages to the terminal and e-mail. The indicator does not repaint or recalculate. Signals when working with the indicator: The appearance of a red arrow above the price chart is a possible start of a

Safe Trade Indicator MT4
The Safe Trade indicator is an analytical and technical tool that has different features and very accurate signals. This indicator can be used in various markets such as the stock market and the forex market. It states and also provides buy and sell signals.
Features of the Safe Trade indicator
Receiving signals as notifications on the Metatrader mobile application. Receive signals by email. Receiving signals in the form of warning messages or alarms on Metatrader. Rec

Introduction
The Price Action, styled as the "Smart Money Concept" or "SMC," was introduced by Mr. David J. Crouch in 2000 and is one of the most modern technical styles in the financial world. In financial markets, Smart Money refers to capital controlled by major market players (central banks, funds, etc.), and these traders can accurately predict market trends and achieve the highest profits.
In the "Smart Money" style, various types of "order blocks" can be traded. This indicator uses

TLBD Chart Indicator MT4
Drawing a trend line in price charts is one of the most important methods to identify the market trend, many traders use the trend line break for positioning because they believe that the trend line break means changing the trend and creating a new trend. As a result, the breaking of the trend line is an important sign for traders to open their positions in the direction of the trend. The TLBD indicator is a very suitable tool for detecting the breaking of dynamic trend

Market Magnet - This is not just a convenient tool, but rather an indispensable assistant for those who prefer to analyze the market using a clean chart. Sometimes even experienced traders need an additional analytical tool to identify key entry and exit points for trades. That's where Market Magnet comes in.
This indicator is ideal for those who often have difficulty identifying trend inflection points or drawing trend lines on a chart. It offers a visual representation of key market moments,
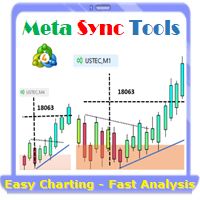
Supercharge Your MetaTrader Analysis and Trading with Meta Sync Tools! Struggling to analyze price action across different timeframes? Meta Sync Tools eliminates the frustration of unsynced crosshairs and charts, allowing seamless multi-timeframe analysis. Missing key correlations between assets and constantly switching between charts? Meta Sync Tools empowers you to visualize relationships between instruments effortlessly. Tired of wasting time on repetitive tasks? With 30+ Customizable Short

Introduction
"Smart money" is money invested by knowledgeable individuals at the right time, and this investment can yield the highest returns.
The concept we focus on in this indicator is whether the market is in an uptrend or downtrend. The market briefly takes a weak and reversal trend with "Minor BoS" without being able to break the major pivot.
In the next step, it returns to its main trend with a strong bullish move and continues its trend with a "Major BoS". The "order block" beh

Introduction
The "Smart Money Concept" transcends mere technical trading strategies; it embodies a comprehensive philosophy elucidating market dynamics. Central to this concept is the acknowledgment that influential market participants manipulate price actions, presenting challenges for retail traders.
As a "retail trader", aligning your strategy with the behavior of "Smart Money," primarily market makers, is paramount. Understanding their trading patterns, which revolve around supply, de
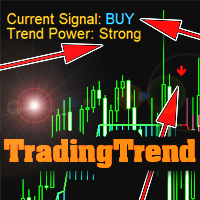
The indicator is not redrawn.
Can be used as a ready-made trading strategy.
Shows: Trend direction; Trend strength; Points of trend reversal or fading. Settings: Trend sensitivity (the lower, the more accurate) - operating sensitivity (the higher, the more accurate); Calculation method - calculation method; Info position - angle of location of the info label (or remove); Text Color - text color; Trend Color Buy - color of the BUY text; Trend Color Sell - SELL text color; Sound Aler

MT4指標紹介:Kラインレベル指標、トレーダーが100%取引機会を特定するのを支援 概要: Kラインレベル指標は、トレーダーが高確率な取引機会を特定するのを支援する強力な技術分析ツールです。Kラインの高値、安値、始値、終値を分析することにより、この指標は価格行動のサポートとレジスタンスレベルを明らかにし、明確な視覚効果で提示します。 機能: 潜在的なトレンド反転の特定: 価格行動が停滞または反転する可能性のある領域を特定し、トレンド方向に沿った取引を可能にします。 ブレイクアウトの活用: サポートとレジスタンスレベルのブレイクアウトを予測し、ブレイクアウトの勢いを捉え、利益を最大化できるようにします。 エントリーとエグジットポイントの最適化: 取引の最適なエントリーとエグジットポイントを正確に特定し、全体的な取引精度を向上させます。 利点: 100%の取引機会の特定: サポートとレジスタンスレベルを特定することで、すべての潜在的な取引機会を発見するのを支援します。 明確で理解しやすいチャート: サポートとレジスタンスレベルをチャートに直接描画することで、市場構造を一目瞭然で把握できます

hint: my basic indicators are used like that KingLevel combind with KingSequence will provides basic insights of the price action of the markets and KingSequenceSgn is just for the convienent for watching. And plus with Forex Trading mentor subsccription I will assist you to win the market at first later if it's great will be upgraded to King Forex trading mentor.
Slide 1: Title Slide Title: Unveiling Market Rhythms with Advanced Price Momentum Analysis Subtitle: A Revolutionary Trading Indic

hint: my basic indicators are used like that KingLevel combind with KingSequence will provides basic insights of the price action of the markets and KingSequenceSgn is just for the convienent for watching. And plus with Forex Trading mentor subsccription I will assist you to win the market at first later if it's great will be upgraded to King Forex trading mentor.
It just the main chart sign of the "KingSequence" indicator.
Here is the detals from the "KingSequence" indicator
Slide 1: Title S
The indicator determines the ATR value (points) in a classic way (taking into calculation paranormal bars/candles) and more correctly - ignoring paranormal movements of the Instrument. Correctly it is excluding paranormal bars from the calculation, extremely small bars (less than 5% of the standard ATR) and extremely large bars (more than 150% of the standard ATR) are ignored. The Extended version - allows you to set calculation parameters and a lot of other input parameters Ver
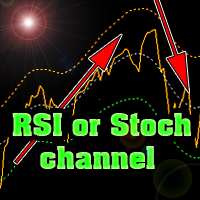
The indicator plots Stochastic or RSI levels in the price channel of a trading instrument.
Download the indicator for FREE right now and test it in the strategy tester.
It is easy to determine the trend direction and overbought or oversold levels.
The settings are standard for any of these indicators.
It is possible to change settings for each trading instrument separately.
You can use currencies, stock markets, futures or cryptocurrencies.
The indicator can be used as an independent tool
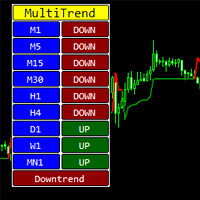
The indicator shows the direction of the trend on different timeframes.
Timeframes can be disabled in the settings.
The bottom line of the indicator reports the prevailing trend - up or down.
The indicator can be used on any trading instruments - currencies, stocks, futures, indices, metals, cryptocurrencies.
This indicator can be used as an independent trading system or as an addition to another system.
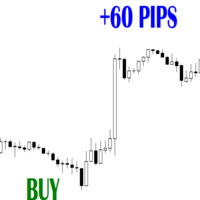
組み合わせる他のボリュームツール: https://www.mql5.com/en/market/product/72744 大量の極端な状況の特定: このインジケーターを、トレーダーが激しい買い圧力または売り圧力の時期を正確に特定するための強力なツールとして位置づけます。 出来高を利用するインジケーターのプライマリバッファーが、トレーダーが市場活動の高まりを示す出来高のスパイクを特定するのにどのように役立つかを強調します。 これらの大量の極端な値は、多くの場合、強い価格変動と一致するため、潜在的なトレンドの反転または継続を示す重要性を強調します。
極端な取引高の特定: 市場の優柔不断や参加の欠如を示す可能性のある、取引高が低い期間を検出するインジケーターの機能を示します。 現在のトレンドにおける潜在的な枯渇を示す、弱い買い圧力または売り圧力のインスタンスを出来高ベースのバッファーがどのように特定できるかを強調します。 この機能は、流動性が低い期間の取引を避けようとするトレーダーや市場の反転の可能性を予測するトレーダーにとって価値のあるものとして位置づけてください。
視覚的表現
>>> CHRISTMAS SALE: -60% OFF! - Promo price: $56 / Regular price $139 <<< - The promotion will end soon!
The Forex Trend Tracker is an advanced tool designed to enhance the trading capabilities of forex traders. This sophisticated indicator uses complex mathematical formulas alongside the Average True Range (ATR) to detect the beginnings of new upward and downward trends in the forex market. It offers visual cues and real-time alerts to give traders a competitive advantage in the fast-paced w

Graf Mason is a tool that will make you a professional analyst! The method of determining wave movements using inclined channels qualitatively conveys the schematics of the movement of any instrument, showing not only possible reversals in the market, but also the goals of further movements!Destroys the myth that the market is alive , clearly showing the schematics of movements from one range to another! A professional tool, suitable for the medium term with the definition of the current trend!

Overview
In the evolving landscape of trading and investment, the demand for sophisticated and reliable tools is ever-growing. The AI Trend Navigator is an indicator designed to meet this demand, providing valuable insights into market trends and potential future price movements. The AI Trend Navigator indicator is designed to predict market trends using the k-Nearest Neighbors (KNN) classifier.
By intelligently analyzing recent price actions and emphasizing similar values, it helps t
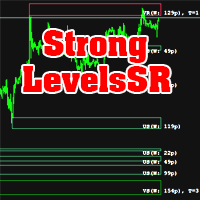
The indicator calculates support and resistance levels. There is a hint in the upper left corner. This hint can be removed. Hint in two languages (English and Russian). The width of support and resistance levels is shown. The number of levels touched is displayed. Works on all timeframes. Can be used as an independent trading system, and as an addition to another system. Download the demo version of the indicator right now and try it in the strategy tester!

LEVELSSインディケータが示す:
- 日足の強気ゾーンと弱気ゾーン。毎日00:00から23:59まで表示。 - 週足の強気・弱気ゾーン。毎週月曜日0:00から金曜日23:59まで表示されます。 - 特定のタイムフレームから特別に計算されたチャネルで、他のすべてのタイムフレームに表示されます。デフォルトでは、これは4時間のタイムフレームで、取引したい他のタイムフレームに変更することができます。これはノンストップで計算されます。
画面の左上には、ゾーンとチャネルが強気、弱気、中立のいずれであるかが表示されています。この3つすべてが強気の場合、現在のローソク足に緑の点が表示されます。3つとも弱気の場合、ピンクの点が表示されます。 このインディケータに制限はありません。

Contact me after payment to send you the user manual PDF file. Introduction Introducing the Wolfe Pattern Indicator, a powerful tool designed to help traders identify and capitalize on the elusive Wolfe Pattern in financial markets. This innovative indicator uses advanced algorithms to scan for the Wolfe Pattern in all symbols and time frames, providing traders with a unique edge in the market. How to trade with the Wolfe Pattern The Wolf Pattern is a rare and lucrative trading opportunity that
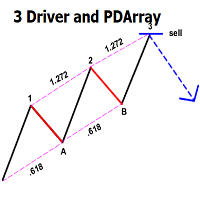
This indicator automatically identifies the SMC 3-Drive pattern and sends notifications to users when the pattern is detected. Additionally, the indicator identifies PDArray (including FVG and OB) and offers an option to combine the 3-Drive pattern with PDArray. This combination provides users with more reliable signals. What is the 3-Drive Pattern? This pattern is formed by three price pushes in one direction, providing a strong reversal signal (Figure 3). The key to identifying this pattern is
Confident trading with levels of support and resistance! We present to you the indicator " Levels of support and resistance ", which will become your indispensable assistant in the world of trading.
The indicator automatically identifies key levels of support and resistance , on the basis of which you can:
Make Exact Deals : Entering the market at levels of support and resistance greatly increases the chances of successful trading. Identify trend movements : A breakthrough or rebound from th

We present you the indicator "Candle closing counter", which will become your indispensable assistant in the world of trading.
That’s why knowing when the candle will close can help:
If you like to trade using candle patterns, you will know when the candle will be closed. This indicator will allow you to check if a known pattern has formed and if there is a possibility of trading. The indicator will help you to prepare for market opening and market closure. You can set a timer to create a pre

The Zigzag Indicator is a powerful tool, developed to assist traders in identifying market trends by highlighting significant highs and lows of a trade. It is designed with the flexibility to adjust to fluctuating market conditions and to filter the minor price fluctuations in the market to focus on substantial ones.
The Zigzag Indicator adheres only to movements that meet a specific percentage or a defined number of points, allowing it to weed out minor price movements and focus solely on ma

精密トレンドシグナルは、価格の反転ポイントをチャート上に矢印で表示するインジケーターです。緑の矢印は価格が上昇に反転する時を示し、赤の矢印は価格が下降に反転する時を示します。このインジケーターは、任意の時間枠と任意の通貨ペアで使用できます。 このインジケーターを使用したトレーディング戦略: 緑の矢印 :緑の矢印が表示されたら、以前に開いた売りポジション(もしあれば)を閉じて、買いポジションを開きます。 赤の矢印 :赤の矢印が表示されたら、以前に開いた買いポジション(もしあれば)を閉じて、売りポジションを開きます。 インジケーターの利点: 再描画しない :このインジケーターはシグナルを再描画しません。 明確な方向 :矢印で価格の動く方向を示します。 汎用性 :すべての通貨ペアで機能します。 柔軟な時間枠 :すべての時間枠で機能します。 インジケーターの設定: Step :パラボリックインジケーターのステップ。 Maximum :パラボリックインジケーターの最大ステップ。 MA_Period :シグナルフィルターとして使用する移動平均線の期間。 Arrow :矢印のサイズ。

「M1スキャルピングシグナル」は、M1タイムフレーム用に設計されたスキャルピングインジケーターです。このインジケーターは、価格の反転ポイントを示す矢印をチャートに表示します。赤い矢印は売りポジションへの価格反転を示し、緑の矢印は買いポジションへの価格反転を示します。すべての通貨ペアで使用できます。 利点: 再描画なし: インジケーターは過去のデータでシグナルを再描画しないため、安定した分析が保証されます。 使いやすさ: 簡単に設定でき、重要な反転ポイントをチャート上に視覚化します。 さまざまなタイムフレームのサポート: 1分足から日足まで、あらゆる時間枠で使用できます。 このインジケーターは、価格の反転ポイントを特定する強力なツールであり、トレーディングの精度を向上させたいトレーダーにとって欠かせないアシスタントとなります。 インジケーターの設定: ExtDepth: 分析の深さ(バーの数)。 ExtDeviation: 極値を確認するために必要な価格の偏差。 ExtBackstep: 誤ったシグナルを排除するためのバックステップ。

レンコ指標(Renko)は、外国為替市場で価格変動やトレンドを視覚化し、市場の「ノイズ」を排除するためのテクニカル分析ツールです。従来のローソク足やバーチャートとは異なり、Renkoは「レンガサイズ」と呼ばれる特定のポイント数の価格変動に基づいて構築されます。価格がこのポイント数だけ動くと、チャートに新しい「レンガ」が追加されます。この指標は時間と出来高を無視し、価格変動にのみ焦点を当てています。Renko指標の主な特徴は次のとおりです: ノイズフィルタリング :Renkoフィルタは小さな価格変動を無視するため、トレーダーが主要なトレンドや反転をよりよく識別するのに役立ちます。 トレンド識別 :レンガの明確な視覚表現により、上昇トレンドと下降トレンドを識別しやすくなります。 エントリーとエグジットシグナル :この指標はトレードシグナルを生成するために使用できます。たとえば、レンガの色の変化は買いや売りのシグナルとして機能します。 適応性 :トレーダーは自分の好みや市場状況に応じてレンガサイズを調整できます。小さいレンガサイズはより詳細な情報を提供しますが、ノイズが多くなる可能性があり、
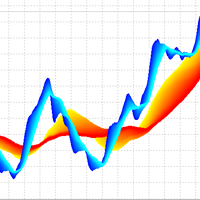
3D Trend Indicator is a non-repaint indicator using multiple moving averages with a 3D surface view. By using this indicator, you can remove uncertainties that can happen using a single and fixed moving average period. You can use a cloud area using a range of moving average periods. Also a wide range of visual settings are added to this indicator to have a better view from the cloud area. Alert and notification system added to the indicator to inform the trader about the action of candles on t

Binarias & Forex (+90% Ratio-Win Next Candle) Espere que el precio llegue a una buena zona (fuerte) sea soporte, resistencia, zona de oferta o demanda, fibonacci level key, cifra redonda. Haciendo lo anterior definitivamente habrá una reversión en el precio y obtendrá su ITM en primera vela dando una efectividad del 100% siguiendo la tendencia. Es muy importante estar atento a las noticias fundamentales en el mercado y estas no afecten tu trading. Sesiones comerciales: cualquiera (24 horas).

Market Noise マーケットノイズは、価格チャート上の市場の局面を決定する指標であり、また、蓄積または分配局面が発生したときに、明確で滑らかなトレンドの動きとノイズの多い平坦な動きを区別します。 各フェーズは、独自のタイプの取引に適しています。トレンド追跡システムにはトレンド、積極的なシステムにはフラットです。 市場のノイズが始まったら、取引を終了することを決定できます。 同様に、またその逆も同様で、騒音が止んだらすぐに、積極的な取引システムをオフにする必要があります。 一方からもう一方に切り替えて、両方のタイプの取引戦略を取引することができます。 したがって、この指標は取引決定の分野で優れたアシスタントの役割を果たします。 すべての価格変動は、選択した期間の一般的な価格変動と、この期間内の価格変動の形でのノイズという 2 つの要素に分けることができます。 同時に、異なる期間の異なる市場では、ノイズ成分とトレンド成分の間の幅広い相互関係を示すことができます (図 1)。 価格変動のノイズレベルが高くなるほど、基礎的なトレンドの方向性と強さを識別することが難しくなります。 した
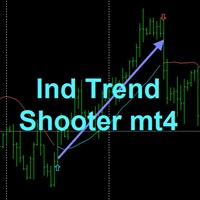
TREND SHOOTER With alerts
It is a trend indicator based on moving averages that very efficiently calculates changes in market direction.
This has the ability to anticipate changes of direction very early.
FEATURES
This indicator particularly draws two moving averages that are used only to show color changes. they can wear these moving stockings as they wish as they do not affect the color change behavior bullish blue color bearish red color where the line is interrupted it is not recommen
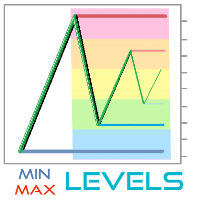
MinMax Levels – は、重要な取引期間 (日、週、月) の最高値、最低値、始値レベルを示す指標です。
各外国為替市場参加者は、取引システムのレベルを使用します。 それらは、トランザクションを行うための主なシグナルであることも、分析ツールとして機能する追加のシグナルであることもできます。 この指標では、大規模な市場参加者の主要な取引期間であるため、日、週、月が重要な期間として選択されました。 ご存知のとおり、価格はレベルからレベルへと移動するため、重要なレベルに対する価格の位置を把握しておくと、取引の意思決定を行う際に有利になります。 また、便宜上、両方のレベル自体を有効または無効にするためのボタンが追加されており、ボタンを折りたたんで価格チャートの作業ウィンドウのスペースを空けることができます。
各外国為替市場参加者は、取引システムのレベルを使用します。 それらは、トランザクションを行うための主なシグナルであることも、分析ツールとして機能する追加のシグナルであることもできます。 この指標では、大規模な市場参加者の主要な取引期間であるため、日、週、月が重要な
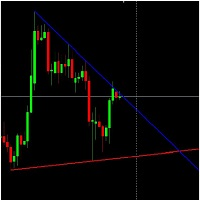
Standard Trend Lines (Automatic).
This indicator draws highly accurate trend lines.
It draws Trend Lines automatically.
This Trend Lines indicator was made by observing lot of discussions made about Trend Lines in forum.
The Trend Lines can also be used to create Expert Advisor.
Latest valid Trend Lines are drawn on Chart.
Trend Lines Work on basis of OHLC price data.

It's a variation of mid of HH and LL since it compares the higher of HH or LL against a period and twice the number of bars back to avoid whipsaws.
I used to display this against lines on a chart, but made a histogram out of it and it looks interesting.
It looks good at gauging trend strength and general turns (see image below).
The name of the indicator is BAM, which is an acronym for "Below and Above Mid".
Ways to use it:
1. To see general trend on longer TFs (more than 60 bars back).

It's a variation of mid of HH and LL since it compares the higher of HH or LL against a period and twice the number of bars back to avoid whipsaws.
I used to display this against lines on a chart, but made a histogram out of it and it looks interesting.
It looks good at gauging trend strength and general turns (see image below).
The name of the indicator is BAM, which is an acronym for "Below and Above Mid".
Ways to use it:
1. To see general trend on longer TFs (more than 30 bars back).
GAP DETECTOR
FVG in trading refers to "Fair Value Gap", . It is a concept used in technical analysis to identify areas on a price chart where there is a discrepancy or gap between supply and demand. These gaps can occur due to rapid movements in price, usually as a result of important news or economic events, and are usually filled later as the market stabilizes.
The GAP DETECTOR indicator is designed to identify fair value gaps (FVG) on the price chart and filter them using volatility to det

購入後にメッセージまたはレビューを残していただければ、ボーナス EA トレード アシスタントをお送りします。Hypertrend は非常に強力なビジュアル インジケーターで、トレンドの強さに応じてローソク足の色を変えます。再描画は行われません。
すべてのペアと時間枠で機能します。スクリーンショット (GIF) を確認してください。
特別なフィルターとオシレーターを使用してトレンドを見つけるので、チャートを見るだけで済みます。
設定:
好みに合わせて色を変更し、アラートを選択します。トレードアシスタント EA パネルで設定を行います (固定ロットまたはバランスのリスク? 金額とリスクリワード比率を設定します!)
戦略: インジケーターを使用してエントリーを確認します! ローソク足が強気色に変わったら買いエントリー / ストップロスを前のニュートラルセクションより少し下に設定 / TP でトレードを終了するか、ローソク足がニュートラルまたは反対色に戻ったら! ローソク足が弱気色に変わったら売りエントリー / ストップロスを前のニュートラルセクションより少し上に設定 / TP で

The Prop Trading Scalper indicator is a tool used for manual traders to assist in passing prop trading challenges, which are evaluations set by proprietary trading firms to determine a trader's skill and discipline. This indicator is particularly designed for scalping, a strategy that involves making numerous small trades to capitalize on minor price movements.

Renko Masterx は、練行チャートで取引するために設計された mt4 矢印タイプのインジケーターです。このインジケーターには、勝率や獲得ポイントなどの役立つ情報をトレーダーに提供するバックテスト パネルがあり、ATR x 乗算の tp と sl も提供します。この O O インジケーターオープンバーまたはイントラバーでシグナルを提供し、シグナルが与えられた場所の正確な価格を示す白いマーカーを備えています。このインジケーターの使用方法は、インジケーターが示す矢印に従って買いまたは売りを開始することです。また、インジケーターが示すように TP と SL を確立します。
パラメーター:
マスター期間:信号期間
TP ATR: 利益価値を利用してあらゆるシグナルを活用します
SL ATR: 各信号を活用するためのストップロス値
ATR PERIOD: tp/sl 値は、この ATR 値を乗算して生成されます
TIME FILTER – 使用すると、インジケーターはこのフィルター内の日付によって提供されるシグナルに基づいて損益統計を提供します。
MISC: アラート/矢

Using this indicator, you can see the moving average of 7 time frames in (one time frame) the same time frame you are.
You can also set orders to enter buy or sell positions automatically when the price hits Moving.
You can also set orders to risk free or close existing positions when the price hits Moving.
Also, receive a notification on your mobile phone when the price hits Moving.or position will be risk free or close .

PTW NON REPAINT TRADING SYSTEM + HISTOGRAM Non-Repainting , Non-Redrawing and Non-Lagging Trading System.
Does the following: - Gives Accurate Entry and Exit Points - Scalping, Day and Swing Trading - 95% Accuracy - Targets, where to take profits. - Shows Trends, Support and resistance levels - Works on All Brokers - Works on All Currencies, CFDs and Stocks - It does not place trades for you, it only shows you what trades to place. - It works on All Timeframes - It is for Trend or ran

POWER TO GET WEALTHY TRADING SYSTEMS.
NON REPAINT REVERSAL ARROW AND CHANNEL Intra-Day trading and Scalping Strategy: Designed for fast and accurate day trading and short-term trades.
Day and Swing Trading Strategy: Can be used as a reliable tool for day and swing traders who aim for the big moves of the price.
Multi Currencies and Markets: Works on different instruments and markets with its reliable precision.
Multi Timeframes: Can be used on multiple timeframes with good performanc
Elegant RSI indicator can generate RSI divergence with the availability of user defined filters. It can generate voice alerts for RSI oversold and RSI Overbought situations. Moreover it can also generate voice alerts for RSI Divergneces as well as when price breaks above or breaks below the support and resistances created upon divergence ouccurence. The voice alerts are generated in a way that you will know which market has reached the oversold and overbought conditions as well as the rsi Dive
WONNFX iN M5 - Arrow indicator for Forex and Binary Options. Reliable signal algorithm. Indicator not repaint. Indicator working hours: 21:55-23:00. GMT+2. Average winrate = 60-70%.
Recommendations: Timeframe: M5. Expiration: 2-3 candles (1 candle = 5 minutes) Symbol: EURUSD, USDJPY, EURAUD, GBPAUD, EURJPY, AUDUSD, USDCAD, NZDUSD, AUDCAD, AUDCHF, AUDJPY, AUDNZD, CADJPY, EURCAD, EURGBP, GBPUSD, GBPCAD, NZDJPY, CADJPY, XAUUSD

スパイダー練行矢印は、バーオープン/バー内でシグナルを与え、シグナルをプロットするために2つの戦略を使用する練行ベースの矢印インジケーターです。 このインジケーターは、設定でより高い期間で使用した場合、1 バー TP のスキャルピングまたはスイングトレードに使用できます。 このインジケーターは再ペイントやバックペイントを行うことはありません。 ================================================= ======= パラメーター : エントリー期間 : メイン信号期間 Filter Period : 信号フィルター周期 アラート ================================================= =======
使い方 :
矢印が表示されたのと同じ瞬間に取引を開始し、オープンバーで発生するシグナルを受け取る方がよい (シグナルの 90% がそうである)
購入後にお送りするフィルターを使用して、トレンドの方向をフィルターします。
逆シグナルまたは自分の好みの出口メンタリティで市場から退場することもできます

バイナリATMは、2つの部分に基づいているバイナリーオプションシグナルインジケータであり、最初のものは、トレンドの方向を伝え、買いのみで売りを指示する色付きの線の形にあり、2番目のものは、BAR OPENに来て、決して再描画されず、遅延しないドットの形をしたエントリーシグナルです。
使い方 :
前のバーが売りラインの色を持っていた場合、売りを開くよりも売りドットが開いているバーに表示されるのを待ちます、有効期限は同じローソク足の終値です
前のバーが買いラインの色を持っていた場合、買いを開くよりもバーのオープンに買いドットが表示されるのを待つと、有効期限は同じローソク足のクローズになります
==============================
パラメーター:
エントリーシグナル期間
フィルタ行期間
フィルタライン乗数
アラート
色
==============================
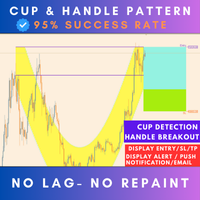
Live Trading Results MT5 Version Contact for Manual Guide Next Price $125 Free Scanner Dashboard (Contact me) Strategy - Breakout / Retest / Aggressive Hello Everyone, We are excited to introduce one of the most reliable and high win rate patterns in trading: the Cup and Handle . This is the first time we are releasing this meticulously crafted indicator, boasting an impressive 95% success rate . It is versatile and effective across all types of pairs, stocks, indices,

Async Charts is an indicator to synchronize charts and display a customized crosshair (cursor) on all selected charts. This is a useful utility for traders using multiple timeframes of analyzing multiple symbols for trade entry or exit.
Main Features : Real time Crosshair Synchronization on All Selected Charts
Supports Multiple Timeframes and Multiple Symbols at the same time
Auto Scroll Option
Graphical Adjustment of Color, Font, Size, ...
Locking All or Locking Specific Charts
More and More .

Trading Dashboard is a useful tool for your multiple trades. It contain information such as : - Breakeven point(price) of your multiple trades, - Loss point(price) of your trades, - Current Trading Day and Session, - Current Time and time left of candles, - Total Lot Buy & Sell, and sum of it - Spread and ATR of current time frame and symbol - Profit-Loss in percentage of your open trade

The RPO (Relative Price Oscillator) is a technical analysis indicator used in Forex trading to measure the momentum and trend strength of a currency pair. It is derived from the Relative Strength Index (RSI) but focuses on the difference between two moving averages of price, usually the closing price, over different periods. The RPO is similar to the MACD (Moving Average Convergence Divergence) but uses relative price levels instead of absolute price levels. Key Components: Short-Term Moving Ave

Description of Fibonacci Levels for Support and Resistance (SNR) with a Statistical Model Fibonacci levels are widely used in technical analysis to identify potential support and resistance levels in financial markets. These levels are derived from the Fibonacci sequence, a mathematical sequence where each number is the sum of the two preceding ones. The key Fibonacci retracement levels are 23.6%, 38.2%, 50%, 61.8%, and 100%.

YK-Fibo Pivot Indicator: Trade Smarter with Fibonacci Pivot Points The YK-Fibo Pivot Indicator is a powerful technical analysis tool that combines the precision of Fibonacci retracements with the insights of Pivot Points. Whether you're a novice or seasoned trader, this indicator empowers you to spot profitable opportunities in the market with ease. Why Choose YK-Fibo Pivot? Pinpoint Support & Resistance: By calculating Fibonacci levels based on the previous day's high, low, and close prices, y

「Scalping Signal No Repaint No Lag」は、どのチャートにドラッグしても、テンプレートや他のインジケーターをロードする必要なく、必要なすべてのインジケーターを自動的にロードする市場で唯一のインジケーターです。提供された画像とまったく同じようにチャートを自動的に設定します。このインジケーターはリペイントや遅延のないシグナルを保証し、すべての通貨ペアおよび時間枠(TF)でのスキャルピング戦略に最適です。 機能 インジケーターの自動ロード :インジケーターを任意のチャートにドラッグすると、追加の必要なインジケーターがすべて自動的にロードされ、設定された好みに応じてチャートが設定されます。ただし、設定からパラメータを変更することもできます。 チャートの可視化 :日本のローソク足や特定の色を使用して、視覚化を改善するためにチャートのプロパティを調整します。背景やローソク足の色は必要に応じて変更できます。 シグナル生成 :2つの移動平均線の差およびRSIとそのEMAのクロスオーバーを使用して、買いと売りのシグナルを生成し、チャートに矢印で表示します。 トレンドの可視化
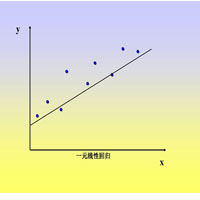
This index is used to calculate the linear regression slope of the K line in a period of time. The algorithm adopts the least square method.
1. Suitable for each cycle chart.
2. Can be used to calculate opening price, closing price, high price, low price, middle price.
3. Specify the start time and end time in the parameters.
Note that the start time and end time cannot be weekends, select the calculated price, pay attention to capital letters.
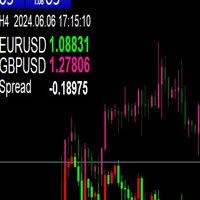
This indicator can be used to add a candle chart of another variety to the chart of the current variety.
1. The chart height will be adjusted automatically
2. If you switch the current icon period, the K of another variety will also switch to the corresponding period
3. In the upper left corner of the chart, the current cycle, the current time, and the current price and spread of the two targets will be displayed.
4. When switching cycle, due to a large number of data retrieval, it will oc
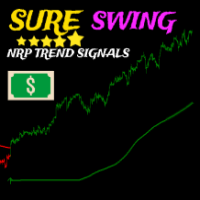
複数の組み込みインジケーターを組み合わせたものに基づいた Sure Swing インジケーターは、スイング取引シグナルを提供する複数時間フレームのトレンドベースの矢印インジケーターであり、このインジケーターは再描画されません。 取引方法: 購入アラート付きの緑色の矢印が表示されたら買い取引を開始します。ストップロスは矢印の下にあり、テイクプロフィットは最小リスクの1倍です 売りアラート付きの赤い矢印が表示されたら売り取引を開始します。ストップロスは矢印の上にあり、テイクプロフィットは最小リスクの 1 倍です。 -------------------------------------------------- ---------- =パラメータ: タイムフレーム: シグナルの生成に使用するタイムフレーム スイング周期:信号発生周期 アラート -------------------------------------------------- ----------
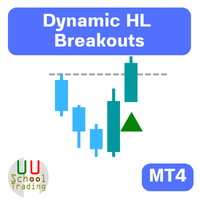
Description of Using the Dynamic HL Breakouts Indicator The Dynamic HL Breakouts indicator is a technical tool designed for trading trend-following assets. Its main purpose is to help traders identify key entry and exit points during strong trending periods of an asset. Components of the Dynamic HL Breakouts Indicator Highs and Lows This indicator calculates and displays the High and Low values for a specified period (e.g., the past 20 days) to create a price movement range for the asset. These

"Trend Finder" is a trend trading strategy that combines market noise filtration and all necessary functions in one tool! The system automatically displays entry and exit points using arrows. Only one parameter is sufficient for configuration. It offers simple, intuitively understandable, and effective trend detection. The intelligent algorithm of the "Trend Finder" indicator identifies potential market reversal points. Often, a good trend can be visually observed on the price chart. However, a

The Your Honor trend indicator is based on price divergence and is designed to analyze and determine market entry points. It can also be used as a filter in trading. The indicator has only two parameters: Period and Level. The Level parameter helps eliminate unnecessary signals. For example, for EURUSD the Level can be set, for example, to 0.0001. Your Honor can be used to both identify entry points and filter signals. The indicator displays information in a clear manner. It is important to reme
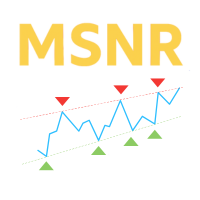
Malaysian Levels は、サポートとレジスタンスの水準をチャート上に表示するカスタムインジケーターです。これらの水準は、マレーシアのSNR理論に基づいています。この理論では、水準は特定の価格水準を指し、エリアではありません。これらの価格水準は、ラインチャートのピークと谷に基づいています。 特徴: A-Level、V-Level、ギャップレベルの3つの種類の水準。 水準の新鮮さインジケータ:新鮮な水準は、未テストの水準や取引された水準よりも重要です。 新鮮な水準と新鮮でない水準の色とスタイルをカスタマイズ可能。 新鮮な水準のみを表示するか、すべての水準を表示するかを選択できます。 バックテスト期間と現在の価格上下の水準の数を調整可能。 複数のタイムフレームをサポート。 用途:
トレーダーは、MSnR Linesを使用して潜在的なサポートとレジスタンスの水準を識別し、取引の意思決定を行うことができます。新鮮な水準はより重要であり、より良い取引機会を提供する可能性があります。また、異なるタイムフレームの水準を使用してマルチタイムフレーム分析を行い、取引の精度と信頼性を向上させ

ペイントレンドは、細い色の線の形で市場の方向性を示すトレンドフィルターインジケーターです。このインジケーターは、トレーダーが現在の実際のトレンドに基づいて取引の決定を下すのに役立ちます。インジケーターには、トレンドの強さと弱さを示す多くのレベルがあります。再ペイントやバックペイントを行わなくても、信号が遅延することはありません。
=================================================
パラメーター :
期間:トレンド期間 モード : maの計算モード 価格:終値/始値/高値/安値。 アラート
=================================================

SNR LEVEL INDICATOR Accurate Snr level indicator will only display Fresh Levels that are close to the Current Market Price. This indicator is very accurate in mapping Support & resistance levels. there is an alert feature when the price TOUCHES the SNR LEVEL, WHEN CLOSE CANDLE BREAK/REJECT SNR LEVEL.
INDICATOR MARKING :
- SUPPORT LEVEL = V SHAPE - RESISTANCE LEVEL = APEX LEVEL - GAP RESISTANCE & GAP SUPPORT = OPEN CLOSE CANDLE - SUPPORT BECAME RESISTANCE & RESISTANCE BECAME SUPPORT INDICATOR C
MetaTraderマーケットはMetaTraderプラットフォームのためのアプリを購入するための便利で安全な場所を提供します。エキスパートアドバイザーとインディケータをストラテジーテスターの中でテストするためにターミナルから無料のデモバージョンをダウンロードしてください。
パフォーマンスをモニターするためにいろいろなモードでアプリをテストし、MQL5.community支払いシステムを使ってお望みのプロダクトの支払いをしてください。
取引の機会を逃しています。
- 無料取引アプリ
- 8千を超えるシグナルをコピー
- 金融ニュースで金融マーケットを探索
新規登録
ログイン