YouTubeにあるマーケットチュートリアルビデオをご覧ください
ロボットや指標を購入する
仮想ホスティングで
EAを実行
EAを実行
ロボットや指標を購入前にテストする
マーケットで収入を得る
販売のためにプロダクトをプレゼンテーションする方法
MetaTrader 4のためのテクニカル指標 - 122

(Google 翻訳) この指標は、 MetaTrader インストールのソース コード例として提供されている元の ZigZag に基づいています。 「深さ」チャネルとそれぞれのブレークアウトを表示するための追加機能を追加して書き直しました。 また、以前のジグザグ ポイントを観察することもできます。 オプションで、ブレークアウトが発生したときにユーザーに警告することができます。 アラートは端末上に表示することも、モバイル デバイスのプッシュ通知を介して独自のカスタム テキストで表示することもできます。 (Original text) This indicator is based on the original ZigZag provided as a source code example with MetaTrader installations. I rewrote it with some extra features for displaying the “depth” channel and the respective break-outs. It also allows

The Hybrid Trend indicator is used to determine the strength and direction of a trend and to find price reversal points. The Hybrid Trend indicator is used in the forex markets. The indicator was created in order to display the trend in a visual form. One of the main definitions for monitoring the currency market is a trend.
The trend can be up (bullish) or down (bearish). In most cases, the trend rises for a long time and falls sharply, but there are exceptions in everything. The price moveme

Tired of choosing indicator settings, losing precious time? Tired of uncertainty in their optimality? Scared by the unknown in their profitability? Then the Trend IM indicator is just for you. The indicator will save you a lot of time that can be spent on more useful activities, such as relaxing, but at the same time, the efficiency will increase many times over. It uses only one parameter for setting, which sets the number of bars for calculation.
Trend IM is a reversal indicator and is part

Trend Oracle trend indicator, shows entry signals. Displays both entry points and the trend itself. Shows statistically calculated moments for entering the market with arrows. When using the indicator, it is possible to optimally distribute the risk coefficient. The indicator can be used for both short-term pipsing and long-term trading. Uses all one parameter for settings. Length - the number of bars to calculate the indicator. When choosing a parameter, it is necessary to visually similarize s

Индикатор виртуального эквити, представляемый здесь, может работать по нескольким
символам одновременно. Для каждого символа задается направление ( Buy/Sell ) и размер позиции.
В настройках также указывается размер предполагаемого депозита, дата открытия и закрытия
позиции.
На графике при этом устанавливаются вертикальные линии, обозначающие указываемые в настройках даты.
После установки индикатора на график, можно изменять время открытия и закрытия позиции,
передвигая эти линии.
Дату закр
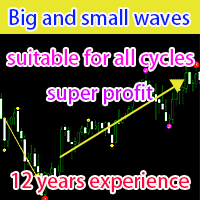
これは、小、中、大の側面から定期的な上昇または下降トレンドを分析する優れたテクニカル指標システムです。
パラメータ中の Period1 は小区間、Period2 は中区間、Period3 は大区間で、small_symbol はシグナル No.1 の識別子、middle_symbol はシグナル No.2 の識別子、big_symbol は識別子です。信号番号 3 の ;alert は警告ボタンのスイッチ、Mail は電子メールを送信するスイッチ、Notification はインスタント メッセージを送信するスイッチです。
この一連の指標は、さまざまな戦略を統合し、さまざまな帯域で売買シグナルを提供します。 シグナル No. 1 は超短期の投機的取引に使用できる最小帯域のシグナルであり、シグナル No. 2 は 1 時間のシグナル取引に使用できるミッドバンドのシグナルです。トレンドを確認するために使用できる主要なトレンド シグナル。
取引を行う場合:まず3番シグナルのトレンドを見て、2番または1番から提供されるシグナルに基づいて注文します。

A cycle is a recognizable price pattern or movement that occurs with some degree of regularity in a specific time period. The analysis of cycles shows us support and resistance that represent smart places to anticipate a reaction in the price of an asset, and therefore represent a basic tool in technical analysis. Cycle lengths are measured from trough to trough, the most stable portion of a cycle. The information you find on this page is useful to combine with Elliott wave analysis .

Pivots Points are price levels chartists can use to determine intraday support and resistance levels. Pivot Points use the previous days Open, High, and Low to calculate a Pivot Point for the current day. Using this Pivot Point as the base, three resistance and support levels are calculated and displayed above and below the Pivot Point. and below the Pivot Point.

A Market Profile is an intra-day charting technique (price vertical, time/activity horizontal) devised by J. Peter Steidlmayer, a trader at the Chicago Board of Trade (CBOT), ca 1959-1985. Steidlmayer was seeking a way to determine and to evaluate market value as it developed in the day time frame. The concept was to display price on a vertical axis against time on the horizontal, and the ensuing graphic generally is a bell shape--fatter at the middle prices, with activity trailing o

The best way to identify the target price is to identify the support and resistance points. The support and resistance (S&R) are specific price points on a chart expected to attract the maximum amount of either buying or selling. The support price is a price at which one can expect more buyers than sellers. Likewise, the resistance price is a price at which one can expect more sellers than buyers.

This is first public release of detector code entitled "Enhanced Instantaneous Cycle Period" for PSv4.0 I built many months ago. Be forewarned, this is not an indicator, this is a detector to be used by ADVANCED developers to build futuristic indicators in Pine. The origins of this script come from a document by Dr . John Ehlers entitled "SIGNAL ANALYSIS CONCEPTS". You may find this using the NSA's reverse search engine "goggles", as I call it. John Ehlers' MESA used this measurement to

The "Strategic scalping" indicator displays possible trend reversal points on the chart. The indicator highlights two different pivot points: high points (pivot points from above) and low points (pivot points from below). Upper pivot points are indicated by down arrows and appear on the chart when the price reaches a high and starts to fall. Pivot lows are indicated by arrows pointing up and appear on the chart when the price bottoms out and starts to rise. The indicator can be useful for trade

green up = buy red down = sell with alerts! that's how easy it is. --this indicator follows trend --based on moving averages and rsi and macd and pivot points --good for scalping and intraday trading and daytrading --works for swing --recommended time frame is 15m or 5m contact me after purchase to receive a trading strategy with the indicator with another bonus indicator!
A robot that trades on the signals of this indicator https://www.mql5.com/en/market/product/46338
This indicator is a high-frequency tool designed for technical analysis of price dynamics in the Forex market in the short-term period. The scalping approach, where this indicator is used, is aimed at quickly executing trades and achieving small profits within short timeframes. The indicator is based on price chart analysis and employs highly sensitive mathematical algorithms to determine changes i
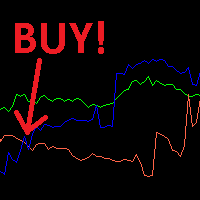
スキャルピングの準備が整った取引戦略。 青い線が赤い線を下から上に横切るとき、買い注文を開きます。 赤い線が青い線を下から上に横切るとき、売り注文を開きます。 指標期間 14. 通貨ペア: GBPUSD、EURUSD、XAUUSD、AUDUSD、USDJPY。 USDCHF、USDCAD。 ストップロスは、通貨ペアに応じて 45 ~ 75 ポイントに設定されます (実験が必要です)。 TakeProfit は、通貨ペアに応じて 20 ~ 40 ポイントに設定されます。 取引に最適な時間帯は、午前 9 時から午後 20 時までです。
取引するロットサイズ: 残高が $100 から $500 の場合 - ロットサイズは 0.01 残高が $500 から $1000 の場合 - ロットサイズは 0.03 残高が $1000 から $2500 の場合 - ロットサイズは 0.04 残高が $2500 から $4500 の場合 - ロットサイズは 0.05 残高が $4500 から $7000 の場合 - ロットサイズは 0.07
インジケーターの説明: このインジケーターは、3 つの異な
Unlike many other indicators including the moving average indicator, Pivot Point can be a leading indicator. In these systems, the price levels of the previous period are used to determine the critical points instead of relying on the current price performance. Such an approach provides a clear framework for traders to plan their trades in the best possible way.
You can use this method and its combination with the methods you want to build and use a powerful trading setup. MT5 version
Let us kno
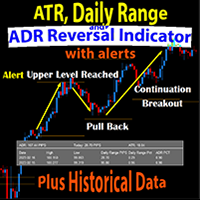
The Daily Range and ADR Reversal Indicator shows you where price is currently trading in relation to its normal average daily range. You will received alerts via pop-ups when price exceeds its average daily range. This alert is a signal for a potential pullback or reversal. This gives you an edge on identifying and trading pullbacks and reversals quickly.
The Indicator also shows you the Daily Range of Price for the current market session as well as previous market sessions. It shows you the AT
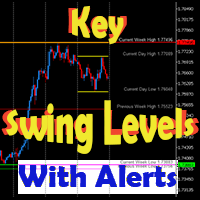
This dynamic indicator will draw the Key Swing High and Low Levels for any symbol on any timeframe!
User may Hide or Show any Level or Label and also Receive Alerts when price returns to that key level via Pop-Up, Push, Email or Sound.
Levels include Current Day High/Low, Previous Day High/Low, Current Week High/Low, Previous Week High/Low and Monthly High/Low.
The Key Levels are labeled with the Price Point Data Listed next to it for quick easy reference.
You can change the Style, Siz

This dynamic indicator allows you to measure retracements of price between any two points in either direction. It displays the price points, percentages and also displays the extension levels.
User may Modify and Add addition levels and extensions." User may also Add multiple Fibonacci indicators on the chart and change their colors, style and sizes.
Can be used on any timeframe.
This is the only Fibonacci Tool you'll need to measure and trade on Structure.
MT5 Version Available as well (

This dynamic indicator will identify when Fast Moving Averages (EMA, SMA, or LW) cross Slow Moving Average lines on any timeframe and with any symbol.
When the moving averages cross and price close above or below the crossing, the User will receive an alert via pop-up, push, or email.
Choose any two Moving Averages to cross to receive an alert and the Indicator will also paint the Moving Average Lines and Arrows.
You can choose Exponential Moving Averages (EMA). Simple Moving Averages (SMA) o

False Breakout Detector Detect new highs and new lows in price action. When the market tries to break these highs and lows but fails, the indicator places an arrow on the chart and sends out an alert (Email, Push on platform or Movil)
Simple and easy to use Does not require strange configurations Works on all assets and time frames
------------------------------------------------------
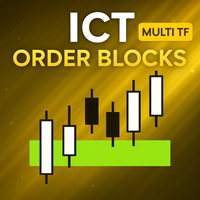
[ MT5 Version ] [ Kill Zones ] [ SMT Divergences ] How to trade using Order Blocks: Click here
User Interface Performance: During testing in the strategy tester, the UI may experience lag. Rest assured, this issue is specific to the testing environment and does not affect the indicator's performance in live trading. Elevate your trading strategy with the Order Blocks ICT Multi TF indicator, a cutting-edge tool designed to enhance your trading decisions through advanced order block analys

Next Trend Pro INDICATOR - the best trend indicator on the market, the indicator works on all timeframes and assets, the indicator is built on the basis of 12 years of experience in forex and many other markets. You know that many trend indicators on the internet are not perfect, late and difficult to trade with, but the Next Trend Pro indicator is different, the Next Trend Pro indicator shows a buy or sell signal, colored candles confirm the signal, and support levels and resistance levels give

Spirit mt4 is an indicator that works without flashing, the signals are triggered after the arrow at the beginning of the next candle
Includes several indicators for overbought and oversold levels.
Works with any currency pair: EUR/USD, AUD/USD and others.
After the purchase, send me a private message and I will send you the settings that I use for this indicator.
Suitable for trading cryptocurrencies.
I like to trade cryptocurrency more, so I use it more there.
It can also be used for bi
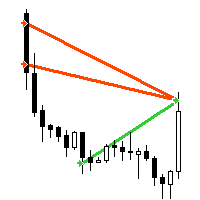
"AV Trade History" is an indicator for MetaTrader 4, which similar to the MetaTrader 5 "Trade History" or "Show trade history" setting, shows the closed trades in the chart. It also shows the orders history in the strategy tester, makes it easier to see them when testing expert advisors automated trading.
Improvements :
- Visibility is increased by line thickness and free choice of color.
- Additional information about the trade is visible when hovering over it, e.g. ticket, magic, comment,

Looking to take your forex trading to the next level? Look no further than my revolutionary forex indicator. Here are j many reasons why you should start using my indicator today: Easy to Use: With an intuitive interface and simple setup process, my forex indicator is easy for traders of all levels to use. Comprehensive Data Analysis: My forex indicator is backed by rigorous data analysis and machine learning algorithms, giving you a comprehensive view of the market. Real-Time Updates: Stay up-t

Supp & Resist Every Trader Need that an Indicator will show you zones for weak, Untested, Verified, Proven and Reversal Support and Resistance with smart calculation. take a look for the Screenshots there some explanations. i don't want to talk a lot :) try it by yourself for FREE because everything is clear in the inputs parameters. If you have any question feel free to ask me.
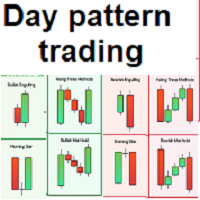
Simple and effective indicator based on some candle patterns recognition Arrows appear on candles when bear signal / bull signal based on candle pattern recognition -----> TWO strategies available you can enable / disable one of them Indicator can work on any chart and time frame I prefer to work on high time frames especially the Daily charts D1 and H4 Red arrows appears above candle showing a bear signal after candle completed - arrow will be blue during candle formation Green arrows appears b
Check My Products
Contact me to discover all my services
I present to you one of the most sought after indicators by traders! It is one of the most useful and valuable indicators for discretionary trading.
It used to be easier to access this indicator from various platforms, but growing demand makes it impossible to use it on external platforms (such as TradingView) without paying a monthly subscription.
That's why I decided to use my experience in software programming to create this indica
Check My Products Contact me to discover all my services
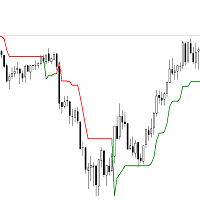
FEEL FREE TO ADD A REVIEW TO HELP ME AND OTHER COSTUMERS This is an indicator based on the famous SuperTrend. Thanks to this mt4 software, it is now possible to have them directly on the mt4 platform, without having to pay subscriptions for external platforms.
It is one of the most functional trend indicators that exists, and it really makes a difference when it comes to discretionary trading.

The First Dawn indicator uses a unique mechanism to search and plot signals.
This keeps searching for signals, making it a great indicator for scaping and identification of changes in direction, swing trading and trend trading.
The First Dawn helps you get early signals. The backtest gives the true picture of how the indicator works with real/demo accounts.
Although this is a tiny indicator it is packed with advantageous settings that will help you whether you desire to: Snap the Peaks and

Check My Other Products Contact me to discover all my services
This indicator is very useful to have a better understanding of the current trend.
With the integration of a trend color cloud it makes it easy to see the price trend immediately on the eye and this allows the trader to make more accurate assessments.
I have been using this indicator for years and I must say that it greatly limits chart errors and trades against the trend
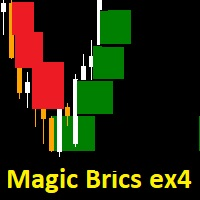
The methodology and logic behind this Magic Brics mt4 indicator is based on the principles of trend following and price action trading. Magic Brics indicator is a type of charting technique that represents price movements using order blocks rather than time. Each order block is formed based on a specified price movement, known as the order size, and is either colored in bullish (green) or bearish (red) depending on the direction of the price movement. Please make sure to adjust algo calculation

Precise Cross Arrow indicator is designed for signal trading. This indicator generates trend signals.
It uses many algorithms and indicators to generate this signal. It tries to generate a signal from the points with the highest trend potential.
This indicator is a complete trading product. This indicator does not need any additional indicators.
The indicator certainly does not repaint. The point at which the signal is given does not change.
Features and Suggestions Time Frame: H1

Индикатор показывает расстояние от ближайшего свободного High/Low
текущей (здесь и далее, текущей - в рамках расчетов индикатора) до исследуемой
(опять же - в рамках расчетов индикатора) свечи слева на графике на том же ценовом уровне. Свободным в данном случае будет являться расстояние больше, чем одна свеча (бар) от текущей
свечи до исследуемой на том же ценовом уровне. Расстояние будет отмечаться пунктирной линией
от High/Low текущей свечи до исследуемой. М
The SD Indicator is a powerful tool in the world of Forex trading, that combines two classical strategies: Support/Resistance levels and Supply/Demand zones. The indicator helps traders to identify potential trading opportunities in the market with high accuracy.
Support and resistance levels are key price levels where buying and selling pressure converge, leading to potential price reversals. The SD Indicator identifies these levels in real-time and provides traders with a clear picture of whe

Amazing Pro System indicator is designed for signal trading. This indicator generates trend signals.
It uses many algorithms and indicators to generate this signal. It tries to generate a signal from the points with the highest trend potential.
This indicator is a complete trading product. This indicator does not need any additional indicators.
The indicator certainly does not repaint. The point at which the signal is given does not change.
Features and Suggestions Time Frame: H1 Wor
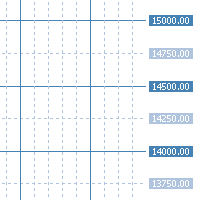
"AV Grid" is an indicator for MetaTrader 4, which automatically displays round numbers as horizontal lines and a sensible period separation . Round prices can be used as support and resistance in trading.
It is an improvement on the "Grid" setting, which also draws a grid on the chart.
Improvements :
- Round levels instead of arbitrary positioning of the horizontals
- Structure by highlighting all x lines (main lines, 2 or 5 makes sense)
- Vertical lines are each in two periods (main and i

This indicator is suitable for trading on the pair and many more. There is also an interactive panel for quickly changing settings. The indicator itself uses universal calculations of additional accuracy, but so far they are optimized for some currency pairs. Many settings can be configured on the main menu. He displays his calculations on the graph in the form of icons. There are two types of icons. In the tester, it works fine by default in the settings. You can specify a color for its icons

外国為替矢印インジケーターは、通貨市場でスキャルピングを成功させるために不可欠なツールです。 これにより、トレーダーはいつ売買ポジションを開く価値があるかを簡単に判断できるため、チャート分析に時間を費やすことなく利益を上げることができます。 一種の信号機であるインジケータの赤と青の矢印は、トレンドの方向を簡単に判断できる視覚的なツールです。 赤い矢印はショート ポジションを開く、つまり通貨ペアを売る可能性を示し、青い矢印はロング ポジションを開く、つまり通貨ペアを買う可能性を示します。 しかし、重要なのは矢印の色だけではありません。 インジケーターには、トレーダーがいつポジションに出入りするかをより正確に判断するのに役立つ他のパラメーターもあります。 たとえば、矢印ごとに、インジケーターは価格レベルを表示でき、到達するとポジションを開く必要があります。 移動平均、ボラティリティ、時間間隔など、他のパラメータも設定できます。 - これらすべてが、トレーダーが市場の動きをより正確に予測するのに役立ちます。 外国為替矢印インジケーターは、トレンド、横方向の動き、ボラティリティの高低など、さ
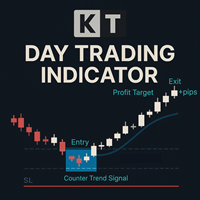
KT Day Trading MT4 provides simplified Buy and Sell signals using a combination of some specific candlestick patterns occurring in the market exhaustion zones.
These signals are designed to identify market reversals and entry/exit points. The indicator can be used to trade on any timeframe from the 1 Minute up to the Daily chart.
Features
Three types of entry signals according to the market structure i.e. Trend following, Range bound, and Counter trend signals. Crystal clear Entry, Stop-Loss,
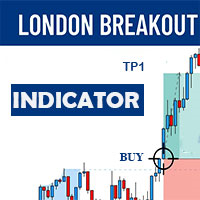
The London Breakout indicator is a technical analysis tool used in the forex market to help traders identify potential breakouts during the opening of the London trading session. This indicator is designed to help traders take advantage of the volatility and momentum that occurs during this time period, which can lead to significant price movements.
The London Breakout indicator works by identifying the range of price movement during the Asian trading session that precedes the London open, and

NATR - this is a normalized version of the ATR indicator Used to measure the level of volatility in % of the total volatility of the instrument, and not in points like a regular ATR For example NATR with a period of 10 will show the average size of a candle in % of the last 10 candles or how many percent an instrument passes in 1 candle on average This allows you to bring the values of any of the studied instruments to a common denominator. Has a simple and clear setup Visually shows
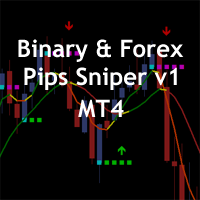
The Binary & Forex Pips Sniper MT4 indicator is based on technical analysis of two moving average and the slope of the slow moving average. The moving average helps to level the price data over a specified period by creating a constantly updated average price. Upward momentum is confirmed with a bullish crossover "Arrow UP", which occurs when a short-term moving average crosses above a longer-term moving average. Conversely, downward momentum is confirmed with a bearish crossover "Arrow Down", w

"AV Stop Hunter" is an indicator for MetaTrader 4, which draws entry arrows for long and short after so-called Stop Hunt candles and has several notifications about them. Since this is a smart money concept , the periods H1 and H4 are the best. Increasing volume improves the signal, lines and arrows are then thicker. The MQL5 variant has colored stop-hunting candles.
Definition :
Stop hunting, also known as stop running, is the practice of institutional traders (smart money) of driving the pr
"Scalper Channel MT4" is a modern channel indicator that shows the trader the direction of the trade. For work, the indicator uses built-in and proprietary technical means and a new secret formula. Load it on the chart and the indicator will show you the entry direction in color:
If the upper limit of the price channel of the indicator is blue, open a buy position. If the lower limit of the price channel of the indicator is red, open a sell position. If the border of the indicator is gray, neut
Symbol Syncyro Switch - is a utility that allows you to switch a trading symbol on several charts at the same time. If you use several charts of the same symbol with different timeframes for analysis and want to change the symbol of a trading instrument, then this tool is just for you! With one click on the button with the inscription of the trading symbol, you can easily change it using this utility.
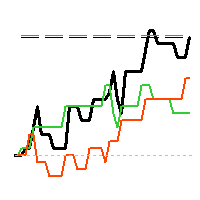
"AV Monitor" is an indicator for MetaTrader 4, which alowes a history analysis of the closed orders. It helps to achieve a quick visual analysis of your own trading or different expert advisors among themselves. Compare and analyze your expert advisors: Which one is the best?
I use an "AV Monitor MT5" indicator per running expert advisor chart to track its performance split into long & short, as well as an index chart e.g. DOW with this indicator and the setting "Show Balance & Equity" to track

MT5版 | Valable ZigZagインジケーター | FAQ エリオット波動理論 は、価格チャート上の波の視覚的なモデルに基づいて、金融市場のプロセスを解釈するものです。この理論によれば、現在市場で優勢なトレンドは、上昇と下降のどちらであるかを正確に知ることができます。 Valable ZigZag インディケーター は、 市場の波動構造 を表示し、現在の時間枠で現在のメイントレンドの方向を示します。便利なことに、 Trend Monitor VZ インジケーターは、取引する通貨ペアの全リストについて、すべての時間枠のチャート上にトレンド方向を表示します。 1 つのチャートですべての商品の市場状態の全体像を把握し、正しい取引判断を下すことができます ! Valable ZigZag インジケーターは 非常に安定しており 、古典的な ZigZag のように頻繁に方向転換してトレーダーを混乱させることはありません。これは、インジケーターの波のプロットにフラクタルを使用することで実現されています。 Valable ZigZag インジケーターは、何よりもまずトレンドインジケー

If you are a market operator looking for an advanced solution to identify trends and trend reversals in financial markets, the Weiss Wave indicator could be what you need. Based on the principle of Elliott wave analysis and combining multiple indicators, the indicator provides a comprehensive view of the market in an easy and intuitive way, even for less experienced traders. With clear and easy-to-interpret buy/sell signals, the indicator provides reliable guidance for identifying trends and tre

In case you get Laguerre S crat indicator, you will get Laguerre Scrat Ea as a Gift. To get Ea and det a iled m anu al PDF contact me PM. Default settings are for usd/cad H4 For St able Long term Profits Laguerre Scrat is a trading system based on 4 indicator combinations in the shape of one indicator. Laguerre indicator (upgraded), CCI, Bollinger bands and market volatility factor. It generates arrows in the indicator window and nuts on the price chart, doubling arrows for a better view where
RumahForexID Momentum Scalping Indicator is the best momentum indicator ever created, and why is that? The indicator works on all timeframes and assets, the indicator is made after 6 years of experience in forex. You know many momentum indicators on the internet are unhelpful, and difficult to trade, but RumahForexID Momentum Scalping Indicator is different , The indicator shows wave momentum, when the market is about to trend or consolidate, all that in one simple and clear indicator!
Rumah

The CP Currency indicator for MT4 uses multiple indicators to generate high-winning signal trades. Moving averages and momentum are two of these indicators. These indicators are utilized by the Super Arrow indicator to filter out false signals as well as generate good ones. Yes!! You don't need so many indicators to trade the major and minor pairs in the financial market. The CP Currency Indicator is a 15-minute signal indicator for all types of traders. The indicator comes with a mini indicato

Extreme Price Meter 過去の市場情報に基づいて、インディケータは反転の可能性が高い次の極端な価格を計算します。 売買の可能性が高い 2 つの価格帯を生成します。 ローソク足が確率バンドの外で閉じたときに配置される矢印を考慮すると、インジケーターの高い精度を簡単に確認できます。 デスクトップ、電話、電子メールの通知。
_________________________________________ _________________________________________ _________________________________________ _________________________________________

This is diamond! Contact me to send you instruction and add you in group.
Diamond Pattern is based on Read The Market(RTM) concepts. The purpose of this model is to face the big players of the market (financial institutions and banks), As you know in financial markets, big traders try to fool small traders, but RTM prevent traders from getting trapped. This style is formed in terms of price candles and presented according to market supply and demand areas and no price oscillator is used in it.
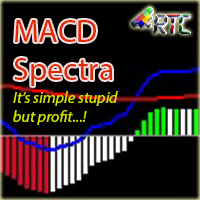
MACD Spectra 、シンプルだが収益性の高い取引指標! このインジケーターは、すべての時間枠とすべての通貨ペアで使用できます。 90% を超える精度で、このインジケーターは、取引活動を支援するための最良のインジケーターを探している初心者とプロのトレーダーの両方に最適です。 ヒストグラムの色、ヒストグラムの位置、シグナルと MACD ラインの位置に従うだけで、簡単に市場に出入りできます。 これ以上待たずに、MACD Spectral と一緒に安定した利益を獲得しましょう。
エントリーとエグジットの場合、インジケーターの読み取りは非常に簡単です。
青色の線が赤色の線と交差し、交点がゼロ ラインより下にあり、表示されるヒストグラムがバー 2 で赤色の場合、白いヒストグラムが表示されたときに売りエントリーと終了の強いシグナルです。 青色の線が赤色の線と交差し、交点がゼロ ラインの上にあり、表示されるヒストグラムがバー 2 で緑色の場合、白いヒストグラムが表示されたときに、買いエントリーとエグジットの強いシグナルです。 0 以下の赤のヒストグラムの後に白のヒストグラムが表示されたら
Check My Product
Contact me to discover all my services
Pivot indicator is a tool used by many traders. It can be used by beginners and experts alike and allows you to identify support and resistance levels. Pivot indicator is a widely used tool because over the years it has shown the validity of the levels it calculates and can be easily integrated into your trading strategy. Pivot levels can be used on different timeframes and based on the chosen time duration, calculate levels using daily
Really simple tool that can be attached to any graph to keep an eye on the account status. It run as an indicator but actually is just a simple monitor. There are three sections: -account market status : infos about global open orders profit/loss, margin required, market status, etc. -account info: simple infos but good for setting lots amount, knowing contract size, server id, etc. -time data: in order not to get mad on time shifts, you have some info about local, broker, GMT time, plus winter/

This is an arrow formed by strong reversal candlesticks it is used on muti time frame or m15 and above for gold and h1 and above for currency pairs (can be used at m5 after strong volatile news) This indicator is 100% non-repain and non-repoint Have a success probability of bringing in more than 90% profit Your stop loss when entering your order is behind the arrow and will be very low it will only be 20 pips or 30 pips at m15 (note in larger timeframes it may be longer) How To USE When the a
【マルチタイムフレーム機関注文ブロック – クリーンで正確】
本インジケーターは、最大3つの時間足から強気・弱気のOrder Blockを自動検出します。SMC/ICTトレーダー向けに設計され、時間足ラベルと矢印付きで、視覚的に整理されたインスティチューショナルゾーンを提供します。リペイントなし、チャートの混乱なし。
使い方:3つの時間足を選択(例:H4/H1/M15)。上位時間足のOBを確認し、価格がゾーンに戻るのを待ち、下位時間足で精密エントリー。SLをOBの外に置き、TPは構造や流動性に基づいて決定。推奨設定:XAUUSD(H4/H1/M15)、EURUSD(H1/M30/M5)、NAS100(H4/H1/M30)。
主な特徴:自動OB検出、マルチタイムフレーム分析、機関レベルの視覚表示、リペイントなし、正確な構造認識、時間足ごとのOB数調整、ラベル/矢印ON/OFF、カスタムカラー。
FAQ:リペイントしますか?しません。形成されたOBは固定されます。売買サインは出しますか?いいえ。本ツールは高精度ゾーンを表示し、実行はトレーダー自身の戦略に依存します。
キーワード:

MT5版 | FAQ | EA Universal Breakout Universal Box は、チャート上に価格帯をプロットし、後に価格帯ブレイクアウトで取引するために使用することができます。このインディケータを適用できる戦略はたくさんあります。 このインディケータは、デフォルトで アジア、ヨーロッパ、アメリカの取引セッション の範囲をチャートにマークするように設定されています。レンジは長方形で表示され、その境界線は取引セッションの開始時刻と終了時刻、およびその期間の最高値と最低値のレベルとなっています。 Telegram チャット: @it_trader_chat 新しい Expert Advisor Prop Master - 取引ターミナルでテストしてください https://www.mql5.com/ja/market/product/115375
インジケーターの設定は非常にシンプルです。
Time Open - 取引セッションの開始時刻 Time Close - 取引セッションが終了した時刻 Box color - 矩形の色 インジケーターには

LINEAR REGREESION INDICATOR ==> The indicator represents the Linear Regression Line and the Support and Resistance lines, obtained based on the standard deviation with respect to the Linear Regression. Customization: The following values can be adjusted: Rango Tendencia: The number of bars or periods, within the considered time frame, taken as a reference for the indicator. AmpDesv: The amplitude or number of times to consider the standard deviation of the linear regression for its representatio

MetaForecastは、価格データのハーモニクスに基づいて、どんな市場の未来を予測し視覚化します。市場が常に予測可能ではありませんが、価格にパターンがある場合、MetaForecastは可能な限り正確な未来を予測できます。他の類似製品と比較して、MetaForecastは市場のトレンドを分析することでより正確な結果を生成することができます。
入力パラメータ Past size (過去のサイズ) MetaForecastが将来の予測を生成するために使用するバーの数を指定します。モデルは選択したバー上に描かれた黄色の線で表されます。 Future size (将来のサイズ) 予測すべき将来のバーの数を指定します。予測された将来は、ピンクの線で表示され、その上に青い回帰線が描かれます。 Degree (程度) この入力は、MetaForecastが市場で行う分析のレベルを決定します。 Degree 説明 0 Degree 0の場合、価格の全てのピークや谷、そして詳細をカバーするために、「Past size」の入力に大きな値を使用することが推奨されています。 1 (推奨) Degre
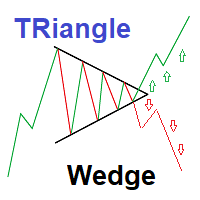
Strategy set to trade Triangle wedge break
This is a simple very effective strategy based on detecting and showing triangle wedges formation Strategy set to trade Triangle wedge break Red Arrows appears on crossing triangle down Green Arrows appears on crossing triangle Up You can also trade lower and upper triangle limit :(new version may be released to allow arrows for side ways trading) ---Sell on price declines from High triangle Level - Buy on increasing from Lower triangle level 2 input

インジケーターの購入者には、FiterインジケーターをベースにしたEAがボーナスとして無料で提供されます。(EAの動作を見るには、ビデオをご覧ください。)EAを受け取るにはコメントしてください。
Fiter は、ATRで調整されたRSIライン(黄色)を含む指数移動平均線(EMA)と、従来の移動平均線(赤色)を組み合わせたハイブリッドインジケーターです。この2つのラインのクロスオーバーにより、2本の単純移動平均線を使用する従来の手法よりも、はるかにスムーズで信頼性の高いトレードシグナルが生成されます。
バックテストでは、この手法の有効性が証明されており、単純移動平均線のクロスオーバーと比較して優れたパフォーマンスが確認されています。過去のデータは、Fiterがさまざまな市場環境に適応し、実際の手動トレードで主要なトレンドを特定するための貴重なツールであることを示しています。
違いを体験するには、スクリーンショットを確認するか、ストラテジーテスターでインジケーターを実行してみてください。
トレードシグナルの通知を行うアラートも含まれています。

MT5 Version Order Blocks ICT Kill Zones SMT Divergences ICT Breakers
The ICT Breakers indicator is a powerful tool for traders looking to gain an edge in the market. This indicator is based on the order flow and volume analysis, which allows traders to see the buying and selling pressure behind the price action. This information can be extremely valuable in identifying key levels of support and resistance, as well as potential turning points in the market. Breaker blocks are areas where in

Осциллятор Чайкина ( Chaikin Oscillator ) — это индикатор импульса, созданный Марком Чайкиным , и, очевидно, индикатор назван в честь своего создателя. Он измеряет импульс линии распределения и накопления, используя формулу схождения-расхождения скользящих средних (MACD). На основе данных об этом импульсе мы можем получить представление о направленных изменениях в линии распределения и накопления.

This indicator is a supporting tool which helps you draw/update any chart object once. The additions or changes are automatically synchronized to all linked chart windows of the same instrument. Setup is simple. Open all required charts you want to work on, attach the indicator to each chart window and start using it.
Its only allowed to attach one indicator to each chart. Once attached, you can draw on any chart (as long as it has this tool attached as indicator) and the drawing will show up o

This indicator was constructed using decision trees. I will only give a few insights into the algorithm since it is original. But there are 4 trees in the inputs and by default they are 10. The decision tree logic for buy signals is as follows: If the MACD line is less than certain bullish divergence (determined by the "BUY_TREE_1" and "BUY_TREE_2" variables) The decision tree logic for sell signals is as follows: If the MACD line is greater than certain bearish divergence (determined by the
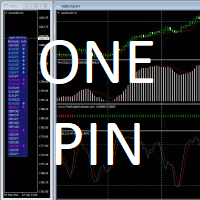
Transform indicators into trading signals JagzFX OnePin Basic allows a wide range of MT4 Custom Indicators to be transformed into multi-symbol trading signals without the need to write any code. You can use OnePin to create 'At A Glance' dashboards showing your preferred technical indicators and even send buy/sell signals to a PIN compatible dashboard just as JagzFX pinTrader. Whilst I have tried to limit the amount of technical jargon needed to use this PIN, there are a few terms that might nee
MetaTraderプラットフォームのためのアプリのストアであるMetaTraderアプリストアで自動売買ロボットを購入する方法をご覧ください。
MQL5.community支払いシステムでは、PayPalや銀行カードおよび人気の支払いシステムを通してトランザクションをすることができます。ご満足いただけるように購入前に自動売買ロボットをテストすることを強くお勧めします。
取引の機会を逃しています。
- 無料取引アプリ
- 8千を超えるシグナルをコピー
- 金融ニュースで金融マーケットを探索
新規登録
ログイン