 MetaTrader 5
 エキスパート
 インディケータ
 ライブラリ
 ユーティリティ
 ウィジェット
 ルール
YouTubeにあるマーケットチュートリアルビデオをご覧ください
ロボットや指標を購入する
仮想ホスティングで
EAを実行
EAを実行
ロボットや指標を購入前にテストする
マーケットで収入を得る
販売のためにプロダクトをプレゼンテーションする方法
MetaTrader 4のためのテクニカル指標 - 164
 以下にリストされているテクニカル指標からのシグナルは、MetaTrader4プラットフォームで取引を開始および終了する際に重要な役割を果たします。
指標の本質は、価格変動の予測を目的とした金融銘柄価格の数学的変換です。

Point Break Indicator – Advanced Trend & Breakout Analysis The Point Break Indicator is an advanced tool designed to identify trend changes, breakouts, and dynamic price levels through a combination of: OMA Adaptive Average Step Moving Average Volatility filter Multi‑Timeframe analysis The indicator blends advanced smoothing techniques with volatility‑based breakout logic, allowing it to filter market noise and highlight more reliable signals. Main Features Step Moving Average (StepMA) At the

GEM Signal Pro GEM Signal Pro は、MetaTrader 4 向けのトレンドフォロー型インジケーターです。より明確なシグナル、より整理されたトレードセットアップ、そして実用的なリスク管理をチャート上で確認したいトレーダーのために設計されています。 単純な矢印だけを表示するのではなく、GEM Signal Pro はトレード全体の考え方を、より見やすく分かりやすい形で表示します。条件が確認されると、インジケーターはエントリー価格、ストップロス、利確目標をチャート上に表示し、トレードセットアップをより効率的に確認できるようにします。 動作の仕組み このインジケーターは、まず内部ロジックに基づいて有効なシードシグナルを検出します。 確認条件が満たされると、GEM Signal Pro はチャート上に完全なセットアップを表示します。これにより、トレーダーはトレード構造をより明確に把握し、手作業による分析を減らすことができます。 チャート上のトレードレベル 確認済みシグナルに対して、GEM Signal Pro は以下を表示できます。 エントリー価格
ストップロス
テ

新しいマルチカレンシー ZigZag をご紹介します。質の高いテクニカル分析のための強力なツールです。
本インジケーターは、ターミナルのストラテジーテスターで無料でテストできます。
ZigZag は、現在のチャートの時間足上に、パラメーターでユーザーが選択した時間足(現在のチャートの時間足以上)のバーに基づいてジグザグ線を描画します。これによりジグザグ線のスケーリングが行われます。これ以外の描画パラメーターはありません。
1つのチャートに複数の ZigZag インジケーターを適用でき、異なる時間足・異なるスケールの線を同時に表示できます。これらの線の色・太さ・スタイルはインジケーターのパラメーターで設定します。
本インジケーターでは、アクティブなチャート上で自身をオン/オフするためのキーをパラメーターで指定できます。そのため、異なる時間足のインジケーターが複数ある場合、パラメーターでそれぞれに別のキーを設定すれば、特定の時間足のジグザグを手軽にオン・オフできます。
インジケーターの入力パラメーター:
Timeframe - 描画する時間足 Key to toggle on

A simple and powerful trading indicator that provides clear Buy and Sell signals using large, easy-to-read arrows. The indicator is designed to help traders quickly identify potential market entries without cluttering the chart. Non-repainting signals
Clear Buy (Up Arrow) and Sell (Down Arrow) alerts
Works on all timeframes
Clean and simple to use Ideal for both beginners and experienced traders who want straightforward trading signals.

ATR Pivot System 1.22
Draws a clear horizontal line at the volume-weighted average entry price of all open positions on the current symbol (Lime for net long, Red for net short).
Also includes a clean on-chart dashboard with: • Real-time P/L in points
• Candle countdown timer
• Daily ATR (adjustable percentages | shown as pivots on the chart)
• Today’s range
• Quarterly bias (true calendar quarter – Bullish/Bearish/Neutral)
• ATR-based pivot levels (R1–R6 & S1–S6) with optional pivot-hit

MTF MA Cross Arrows: Precision Trend Signals MTF MA Cross Arrows is a professional-grade trend-following indicator designed for MetaTrader 4. It identifies the exact moment a Fast Moving Average crosses a Slow Moving Average on a Higher Timeframe and displays those signals directly on your current trading chart. Unlike standard indicators that slow down your platform, this tool is highly optimized to ensure your MT4 remains fast and responsive, even when analyzing multiple timeframes. Key Featur

# VWAP Trend Dashboard
---
## What It Does
Displays a compact dashboard on any MT5 chart showing the **VWAP-based bias** for up to **5 symbols simultaneously**. For each symbol it checks the current price against four VWAP levels and summarises the overall directional bias in a single Trend column.
---
## Dashboard Columns
| Column | What It Means | |---|---| | **Symbol** | Your custom display label | | **NY VWAP** | VWAP anchored at NY session open today | | **Day VWAP** | VWAP anchored

Gold Arbitrage Monitor Gold Arbitrage Monitor is a professional spread monitoring indicator designed to track the real-time price difference between gold futures and gold spot markets. The indicator calculates the spread between two symbols and displays it as a dynamic curve in a separate window, allowing traders to easily detect spread expansion, spread convergence, and potential arbitrage opportunities . This tool is especially useful for traders involved in: Gold futures arbitrage High-freque

MFI MTF Multi-Timeframe Scanner & Dashboard The MFI MTF Scanner is a professional-grade analytical tool designed for traders who require a comprehensive view of market momentum across all timeframes simultaneously. By leveraging the Money Flow Index (MFI) —an oscillator that incorporates both price and volume—this indicator identifies institutional buying and selling pressure from M1 to Monthly on a single chart. Why Use the MFI MTF Scanner? Most traders fail because they trade in isolation on a

Market Trend Strength Heatmap
Smart Structure Heatmap is a multi-timeframe trend analysis indicator designed to help traders quickly identify market direction and overall trend strength based on real time. The indicator combines several technical filters into a simple heatmap dashboard, allowing traders to view trend conditions across multiple timeframes in one place. Trend direction is displayed using color signals: Green Uptrend (buy) Red Downtrend (sell) Yellow Sideways S

Smart Predictor — Continuous Market Forecasting with Intelligent Signals
SmartPredictor offers a fresh perspective on technical analysis. This indicator combines price data smoothing with advanced forecasting elements to create a seamless, continuous "past-present-future" view. No more guessing where the price might go — you can now see the most probable scenario plotted directly on your chart. Key Innovation: Zero Visual Lag
Unlike standard averaging indicators such as moving averages that a

ユーザーマニュアル:Market Profile Osw Market Profile Oswは、特定の期間におけるボリュームと価格の分布を可視化する高度なオークション分析ツールです。従来のローソク足チャートとは異なり、このシステムは最も活発な取引が行われた場所を明らかにし、実際の市場参加に基づいた心理的なサポートおよびレジスタンスゾーンを特定することを可能にします。
1. パラメータガイド(入力メニュー) 全般設定 Show Market Profile: チャート上のプロファイル表示を有効または無効にします。 Volume Type: 価格変動回数(ティック)または実際の取引ボリューム(特定のブローカーおよび銘柄で利用可能)のいずれかでアクティビティを測定するかを選択します。 Look Back Bars: 現在のプロファイルを構築するために指標が何本のローソク足を遡るかを定義します。 Profile Right Side: プロファイルを価格軸の隣(右側)に描画するか、分析期間の開始点(左側)に描画するかを決定します。 Seconds Refresh: 指標がデータを更新し、

Most traders don’t lose because their strategy is bad.
They lose because they trade at the wrong time.
The same strategy that works in a strong trend will fail in a choppy or unstable market.
AEGIS Market Regime Detector shows you exactly what type of market you are in — in real time — so you can avoid bad conditions and trade only when your edge is present.
---
## Why Market Regimes Matter
Every trading strategy performs differently depending on market conditions.
• Trend-based s

Complete newbie Trader Guide Ultimax Dashboard! Everything you need to know to read the dashboard and make confident trading decisions even as a complete beginner.
Features:
Pair Scanner LWMA Trends Confluence Score RSI ADR% Market Sessions Currency Strength Smart Alert
Overview
What does Ultimax actually do? Ultimax is a single-screen command centre for forex trading. Instead of juggling 10 separate indicators across multiple charts, everything you need to evaluate a trade is right in fron

ATLAS Currency Strength Scanner ATLAS Currency Strength Scanner is a professional-grade forex tool designed to identify the strongest and weakest currencies in real time, helping traders focus only on high-probability opportunities. Instead of analyzing individual charts one by one, ATLAS scans the entire currency market and ranks currencies based on relative strength, momentum, and directional bias. This allows you to quickly identify:
• Where money is flowing
• Which currencies are dominating

UranoTrader Smart Cross(ウラノトレーダー・スマートクロス) UranoTrader Smart Crossは、トレンドとモメンタムに基づいたエントリーポイントを正確に特定できるよう開発されたテクニカル指標です。MetaTrader 4向けに設計されており、移動平均線のゴールデンクロス/デッドクロスとRSIによる確認を組み合わせることで、明確な買い(BUY)と売り(SELL)のシグナルを生成し、相場のノイズを低減、確率の低いエントリーを回避します。 客観的で効率的なアプローチにより、チャート上に直接矢印を表示し、すべての条件が揃った時点でリアルタイムアラートを発信。迅速かつ確かな意思決定をサポートします。 主な特徴 スマートクロスオーバーシステム: 期間6と14の移動平均線を使用し、市場の方向転換を検出します。 トレンドフィルター: 期間50の移動平均線がフィルターの役割を果たし、主要トレンドの方向に沿った取引のみを有効とします。 モメンタム確認(RSI): 期間5のRSIが、実際に十分な勢いを伴った動きの場合にのみシグナルが生成されることを保証しま

AEGIS Risk Monitor AEGIS Risk Monitor is a capital protection tool designed to help traders manage exposure, control risk, and avoid unnecessary losses in real time. While most tools focus on finding entries, Risk Monitor focuses on what matters most — protecting your account and maintaining long-term consistency. Why Risk Management Matters Many trading losses do not come from bad entries, but from:
• Overexposure
• Poor position sizing
• Trading during unstable conditions
• Lack of risk aware

Volume Profile Sniper v11.1は、包括的な市場分析ツールです 取引への専門的なアプローチ ボリュームプロファイルスナイパー v11.1は、市場状況の包括的な評価に基づいて明確な信号を提供し、一つの指標に15以上の主要なフィルタを組み合わせ
主な特長 ボリューム不均衡分析-アルゴリズムは、各キャンドルの買い手と売り手のシェアを計算し、当事者の1つの優位性を通知します(50%から90%までの設定可能なしきい値)。
マルチレベル信号フィルタリング-インジケータは考慮されます:
トレンド指標(9/21)
買われ過ぎ/売られ過ぎゾーンを除くRSI
キャンドルパターン(ピンバー、吸収、ハンマー)
サポート/抵抗レベル(自動検出)
主要なプレーヤーの活動を識別するためのボリュームスパイク
クラシックと増幅されたRSIの相違
ボラティリティ評価のためのATR
傾向の強さを決定するためのADX
価格アクション(内部バーと外部バー)
複数の時間枠の確認
市場構造(高値/安値)
セッションフィルタ(アジア、ロンドン、ニューヨークセッション)
ニュースの

Unlock the power of "Psychological Numbers" with RoundLevel . Large financial institutions, banks, and hedge funds don't place orders at random prices; they prefer round numbers (e.g., 1.1000, 105.00, 2000). These levels act as invisible magnets for price action, serving as high-probability support and resistance zones. Key Features: Universal Compatibility: Works perfectly on Forex, Gold (XAUUSD), Indices, and Stocks. Clean Visualization: Automatically draws horizontal levels without cluttering

Tired of constantly switching between charts to monitor different assets? SX Mini Charts Pro is a powerful, space-saving dashboard indicator that allows you to display up to 8 independent mini-charts directly on your main trading window. Designed for multi-symbol analysis, this indicator keeps all your mini-charts perfectly synced with the timeframe of your main chart, giving you a comprehensive view of the market without cluttering your workspace.
Key Features: Multi-Symbol Monitoring: Track

The Smart Liquidation Clusters is a custom technical indicator designed for the MetaTrader 4 (MT4) platform. It calculates and visualizes estimated liquidation zones based on price action and internal algorithms, displaying them as a dynamic heatmap on the chart. These zones are known by several names, sometimes referred to as liquidity pools, liquidity levels, leverage levels, liquidation heatmap levels, leverage heatmap zones, or leverage heatmap levels. These zones represent potential

FVG Pro インスティチューショナル・スキャナー スマートマネー(Smart Money)トレーダー向けの高度なフェアバリューギャップ(FVG)検出器。チャート上の重要な流動性の不均衡を自動的にスキャンして強調表示し、価格反応の予測、高確率な継続トレード、および機関投資家レベルのエントリーの微調整を可能にします。
パラメーターガイド CandlesScan: プラットフォームのパフォーマンスを最適化するために分析される過去のローソク足の制限。 FVGPointsMin: ノイズや小さな市場の動きをフィルタリングするために必要な最小ギャップサイズ(ポイント単位)。 FVGTimeCandles: 検出されたゾーンが視覚的に投影される未来のローソク足の数。 Candle1OnDir: パターンの最新のローソク足が主要な不均衡の方向に閉じることを要求します。 Candle2OnDir: 中心となる生成ローソク足が勢いの方向に強く閉じることを条件とします。 Candle3OnDir: 形成の起点となるローソク足が同じトレンド方向を共有しているか確認します。 ColorUP: 強気ギャッ

Complete SMC/ICT Indicator MT5 — Smart Money Concepts ツール
Complete SMC/ICT Indicator は、チャートウィンドウ上で直接動作する独立型の Smart Money Concepts 分析ツールです。市場構造、不均衡、流動性ゾーンを機関投資家レベルで検出し、完全なカスタマイズとアラート機能を備えています。
機能 このインジケーターは 10 の主要な SMC 要素を検出します:スイング高値と安値、公正価値ギャップ、オーダーブロック、構造のブレイク、キャラクターの変化、マーケットストラクチャーシフト、等しい高値と安値、流動性スイープ、ディスプレースメントキャンドル、プレミアム/ディスカウントゾーン。各機能はドラッグ可能なパネルから個別に切り替え可能で、ゾーンは設定に応じてチャート上に前方へ拡張されます。
マルチタイムフレーム分析 最大 3 つのタイムフレームで同時に動作可能で、TF1、TF2、TF3 に独立した設定を行えます。トレーダーはパネルから直接表示タイムフレームを切り替えることがで

Entry Cluster Indicator Summary What It Does: Entry Cluster is a MetaTrader 4 indicator that combines momentum analysis with structural price levels, using Bollinger Bands to filter signals and reduce false entries. Unique Features: Non-repainting signals that only appear on closed candles Auto-detects optimal price levels for different assets Multi-channel alerts (sound, popup, mobile push notifications) Fully customizable visuals and parameters Signal System (4-Tier): Small Dots = "Get Ready"

Top Movers Spotlight v1.0
強い動きだけを狙う。迷わない。確認してからエントリー。 こんな経験ありませんか? 入った瞬間に逆行する 良さそうに見えたのに伸びない それは戦略の問題ではありません。
「判断材料」が足りないだけです。 このツールが変えること Top Movers Spotlight v1.0 は瞬時に教えます: どこが動いているか どれくらい強いか 本当に信頼できる動きか 迷いを排除
判断をシンプルに
精度を向上 主な強み 最強通貨ペアを即表示
今、最もチャンスのある銘柄が一目で分かる。 マルチタイムフレーム分析
複数時間軸で確認: 早期エントリー トレンド継続の判断 ダマシ回避 通貨強弱の可視化
本当に強い通貨・弱い通貨を見極める。 ワンクリックで実行
クリック → チャート → エントリー
スピードが結果を変える。 トレードの変化 これまで: ノイズに振り回される 弱い動きに入る 自信が持てない これから: 強い動きだけを選ぶ 根拠あるエントリー 一貫した判断 対象トレーダー

強い市場を見極め、ノイズを排除するプロのためのツール Movexa Pro 4.2 は、トレーダーが最も有望なトレード機会を数秒で見つけるために設計された高度なマーケット分析ダッシュボードです。複数のチャートを行き来しながら市場の動きを推測する必要はありません。このツールは、現在の市場における強さと弱さ、そして実際に資金が流れている方向を一目で把握できるようにします。 このダッシュボードでは以下の情報を瞬時に確認できます。どの通貨ペアが最も活発に動いているのか、どの通貨が強く、どの通貨が弱いのか、短期的な勢いが中期トレンドと一致しているか、そして日足ベースのバイアスが現在の動きを支持しているかを明確に示します。 これにより、トレーダーは無駄なエントリーや低品質なシグナルを避け、より高確率なセットアップに集中することが可能になります。スキャルピング、デイトレード、トレンドフォローなど、あらゆるスタイルに対応し、意思決定のスピードと精度を大幅に向上させます。 Movexa Proは単なる表示ツールではなく、トレーダーの判断力を強化するための実用的な分析ツールです。市場の本質的な動きを捉え、

Professional Opening Range Breakout (ORB) indicator designed for precision session trading with automatic time handling, breakout alerts, and advanced target levels. This indicator automatically identifies the Opening Range for any configurable session, plots the High, Low, and Midpoint levels, and extends them across the trading day. Built-in breakout detection and alerts, range measurements, and extension targets provide traders with clear structure and actionable levels. Ideal for traders usi

Stop wasting time digging through MT4/MT5 account statements to understand how your trading is performing. The Trading Stats Indicator puts every number you need — Win Rate, Avg Profit, Avg Loss, Risk:Reward Ratio, Expected Value, and Total Profit — right on the chart, updated live with every tick.
Why Trading Stats Exists? Every serious trader eventually asks the same questions at the end of a session: How many trades did I take today? What was my average winner versus my average loser? Do I a

Opening Range Pro
WHAT DOES THIS INDICATOR DO?
The Opening Range indicator marks the highest and lowest price reached during a specific time window that you define (for example, the first 15 minutes of the New York session). Once that window closes, it draws two horizontal lines — one at the high and one at the low — extending across the rest of the trading day, so you can see at a glance whether price is above or below the range, and use those levels as reference for your trading decisions.

MajorAlert - is a professional trading indicator for MetaTrader 4 that combines two distinct market analysis approaches into one powerful tool. By integrating a counter‑trend entry logic (upper block) with a trend‑following filter (lower block), the indicator generates high‑probability signals on the chart with clearly separated arrow colors.
Key Features Fully self‑contained – no external indicators required; all calculations are built‑in. Versatile inputs – adjust all parameters to suit a

FX & ゴールド 変化率ダッシュボード (MT4)
市場を瞬時に把握。 チャートを切り替え続ける必要はありません。
モメンタムを推測する必要はありません。
明確にトレードを始めましょう。 FX & Gold ROC ダッシュボードは、1つの画面で市場全体を把握し、どの通貨が強いか、弱いか、そして今動いているかを正確に表示します。 強力な理由 ローリングM1データによるリアルタイムモメンタム
即時ヒートマップ表示
強い通貨ペアと弱い通貨ペアを自動表示
内蔵の通貨強度分析
通貨ペアをクリック → 即座にチャート切替
モメンタム検知アラート よりスマートにトレード これまでのように: 10以上のチャートを確認
複数のインジケーターを使用
チャンスを逃す 必要はありません。 代わりに:
1つのダッシュボード
即座に状況把握
より速い意思決定 最適な対象 スキャルパー
デイトレーダー
モメンタムトレーダー
ゴールド(XAUUSD)トレーダー あなたの優位性 発見できるもの: 早期の強いトレンド
最適な通貨の組み合わせ
高確率のト

Our offer also includes a free panel — Indicator Panel — which allows you to show or hide indicators created by BOToBRACIA -> MT4 / MT5 Our offer also includes a version for MetaTrader 5 -> https://www.mql5.com/en/market/product/171224?source=Site+Market+My+Products+Page
Liquidity Grab Indicator is a practical price action tool that automatically identifies and draws liquidity levels based on swing highs and swing lows. It highlights areas where stop-losses and pending orders most commo

CRT Pro
WHAT PROBLEM DOES CRT PRO SOLVE? --------------------------------- When trading on low timeframes such as M1, M5, M15 or M30, it is easy to lose sight of the broader market structure. CRT Pro solves this by overlaying H1 candles and H4 High/Low range lines directly behind your low timeframe chart, in real time, so you always know where the higher timeframe market structure sits relative to current price — without switching charts or opening multiple windows.
-----------------------

MQL5ブログ: https://www.mql5.com/en/blogs/post/772475 MT4版: https://www.mql5.com/en/market/product/170048 MT5版: https://www.mql5.com/en/market/product/170049
ハーモニックパターン[tambangEA]は、MetaTrader 5用のプロフェッショナルなハーモニックパターンインジケーターです。確定済みのピボットポイントとフィボナッチ比率の検証を用いて、潜在的な市場反転構造を特定します。
このインジケーターは、チャート上にハーモニックパターンを自動的に検出して表示し、エントリーポイント、ストップロス、テイクプロフィット、リスクリワードレベルを計算します。また、最新のインタラクティブなダッシュボードを通して、すべての重要な情報を提供します。
MetaTrader 5で利用可能なFX、金、指数、仮想通貨などの金融商品に対応しています。
対応ハーモニックパターン このインジケーターは以下のパターンを検出できます。 ガートレー バット

MeeKiew Dynamic MTF Pivot MT4: The Future of Volatility-Based Levels
Experience a high-performance Dynamic Pivot System with seamless Multi-Timeframe (MTF) integration. MeeKiew Dynamic MTF Pivot isn't just another indicator; it’s an adaptive analytical engine designed to reveal "True Price" exhaustion zones that static pivots miss. Why Choose Dynamic Over Static? Traditional pivots stay fixed regardless of market momentum. MeeKiew utilizes a proprietary Dynamic Volatility Algorithm that expands

PIN BAR PRO SIGNALS (MT4) Professional Pin Bar Indicator with Smart Money Logic and Breakout Confirmation Overview PIN BAR PRO SIGNALS is a powerful price action indicator designed to detect high-quality Pin Bars and generate precise BUY and SELL signals based on real market behavior. Unlike standard indicators, it does not rely on simple pattern detection. Instead, it analyzes what happens after the pattern — ensuring only confirmed and high-probability setups are displayed. Key Featur

Super Reversal Indicator with Alert 概要 Super Reversal Indicator with Alert は、マルチタイムフレーム分析を用いて高確率の相場反転ポイントを特定するためのトレーディングツールです。ストキャスティクスのモメンタム、需給ゾーン、そして価格のリジェクションシグナルを組み合わせて分析を行います。 本インジケーターは、明確な視覚シグナルとリアルタイムアラートにより、トレーダーが市場の転換点を見極めるのをサポートします。 主な機能 マルチタイムフレーム ストキャスティクス分析 上位時間足のストキャスティクスを使用(ユーザー設定可能) モメンタムの変化やクロスシグナルを検出 エントリー精度を高めるための買われ過ぎ・売られ過ぎレベルを表示 反転リジェクションシグナル 重要な価格帯での強いリジェクションローソク足を検出 以下のポイントでの反転を識別 日足高値での売り反転 日足安値での買い反転 視認性を高めるため、チャート上に矢印を表示 需給ゾーン(Supply and Demand) H4およびD1の上位時間足から重要なゾーンを自動

NIXBOT AI – UranoTrader NIXBOT AI is an advanced trading analysis system designed for traders who want to go beyond traditional indicators and operate based on probability, statistics, and strategic intelligence .
Developed for MetaTrader 4 and 5 , NIXBOT AI integrates a robust set of automated strategies capable of analyzing market behavior in real time, identifying recurring patterns, and selecting the best trading opportunities. More than just an indicator, NIXBOT AI acts as a true decision

TTS Fibonacci Stop drawing fibs by hand. TTS Fibonacci finds the swing, plots every level, calculates your targets, sizes your lot, and scans all 28 pairs — automatically. Drop it on any chart and it works. The indicator detects the highest high and lowest low within your lookback range, draws 10 retracement and extension levels from 0% to 161.8%, and highlights the golden zone so you can see where price is sitting at a glance. Press V to flip between buy and sell setups. Everything recalculates

Zero Lag Trend Signals MT4
Zero Lag Trend Signals is a technical trend-following indicator designed to assist traders in analyzing potential market direction by focusing on minimizing calculation lag. Utilizing the ZLEMA (Zero Lag Exponential Moving Average) and dynamic volatility bands, the indicator provides a visual representation of the current trend state and generates structural chart markers.
Features • Low-lag trend calculation methodology • Visual bullish and bearish trend bands for

Malaysian SNR (Support & Resistance) Indicator for MT4 Malaysian SNR is a support and resistance indicator designed to help traders identify key price levels on the chart. It automatically plots important zones based on market structure, making it easier to read price movements and potential reaction areas. The indicator displays support (green), resistance (red), and intermediate levels (OCL) to give a clearer view of price behavior. It is suitable for traders who rely on price action and multi

Super Trend Advanced v2.00 — Smart Trend Tracking, Making Trading Decisions Crystal Clear
Overview Super Trend Advanced is a next‑generation trend‑following indicator, deeply optimized for accuracy. It goes far beyond a simple channel line, combining intelligent signal filtering with real‑time account monitoring into an all‑in‑one trading assistant. Whether you are a scalper or a swing trader, this indicator provides clear, intuitive, and high‑win‑rate trading guidance.
Key Features 1. E

期間限定オファー
「限定ローンチ価格」
「バージョン2.0後に値上げ予定」 Currencies Gold Momentum Flow Dashboard
— 市場の強さを瞬時に把握 複数時間足(M5〜D1)で、為替とゴールドのモメンタムをリアルタイムで表示する高性能ダッシュボード。 マルチタイムフレームROC分析
トレードシグナル搭載
通貨強弱分析
ヒートマップ表示
アラート+ワンクリック切替 市場が見えるようにトレードする 多くのトレーダーは“見えていない”。 他の人が見逃すものを見抜く これは単なるインジケーターではありません。 精度重視のトレーダー向け 優位性を内蔵 すべてが変わる ️ 多くの人が遅れて気づく真実 インジケーターでは稼げない。
「理解」が利益を生む。 今すぐ優位性を手に入れる ダウンロード
Currencies Gold Momentum Flow Dashboard

Auto Optimized Parabolic RSI: 高度な3Dモメンタムエンジン ほとんどのリテール向けインジケーターは、市場のボラティリティが変化した瞬間に破綻する静的な入力値に依存しているため、失敗に終わります。Auto Optimized Parabolic RSIは、自らの数学的優位性を継続的に再計算することで「インジケーターの陳腐化」問題を解決し、機関投資家レベルの定量的適応力をMT5ターミナルに直接もたらします。 最大の強み: カスタムインメモリ3D最適化 標準的な自動最適化ツールは、インジケーターの呼び出しで端末に過負荷をかけるため、頻繁にMT5プラットフォームをフリーズさせます。本ツールは、このボトルネックを完全に回避しています。RAMベースのカスタムネイティブ計算機を内蔵した内部エンジンは、チャートを読み込んだりタイムフレームを変更したりするたびに、超高速の3Dグリッド探索を実行します。RSI期間(頻度)、SARステップ(加速度)、SAR最大値(制限速度)を同時にスイープし、プラットフォームを遅延させることなく、数万通りものパラメーターの組み合わせを絶対的

ForecastPro is a price projection indicator based on historical pattern similarity. In simple terms, it searches for past price segments that closely resemble the current price pattern, then “borrows” the subsequent movement from that historical pattern and projects it forward. Key Features Data Source You can choose which price series is used for matching: Open, High, Low, Close, HL2, HLC3, or OHLC4. The better the source matches your analysis style, the more relevant the results. Training Data

Price Action Detector — ローソク足パターンツール Price Action Detector は、MetaTrader のチャート上で 27 種類のローソク足およびプライスアクションパターンを識別・ラベル付けするプロ仕様のインジケーターです。すべての検出は確定済みのクローズバーのみで行われ、リペイントのない正確なシグナルを保証します。
パターン検出
インジケーターは強気・弱気・中立のフォーメーションをカバーしており、ハンマー、包み足、スター、ソルジャー、クロウ、各種ドージー、スピニングトップなどを含みます。カテゴリはオン/オフ切り替え可能で、個別パターンの制御により、よく取引されるセットアップを細かく調整できます。
コントロールパネル
ドラッグ可能で最小化できるパネルから、カテゴリの切り替え、個別パターンスロット、再スキャン機能に素早くアクセスできます。パネル位置は MetaTrader のグローバル変数を利用してチャート再読み込み後も保持されます。
アラートとルックバック
最新のクローズバーで新しいパターンが確認されると

CRT Pro Scanner Stop wasting hours watching multiple charts and missing setups while you blink. CRT Pro Scanner solves the most painful problem every trader faces: being in the wrong chart at the right moment. Instead of jumping between pairs and constantly asking yourself "did I miss something?", the scanner does the watching for you. It monitors all your symbols simultaneously, detects Candle Range Theory setups the instant they form, and alerts you immediately — so you can focus on executi
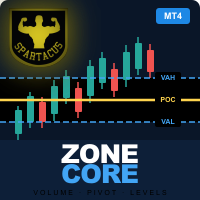
ZONECORE — Volume Profile & Pivot Levels 外科的な精度で、最も取引された価格ゾーンを特定する。 MT5 version
ZONECOREとは? ZONECOREは、**ボリュームプロファイル(Volume Profile) と 高出来高ピボットレベル(Pivot Levels)**を組み合わせた、プロフェッショナルグレードの指標です。市場が最も長く滞在し、最大の出来高で取引された価格ゾーンを明確に示します。これらのゾーンは価格を引き寄せる磁石のように機能します——それらを把握することで、サポート、レジスタンス、高確率な反転ゾーンの特定において決定的な優位性を得ることができます。 3つの独立した計算モード ZONECOREは、同時に有効化できる3つの完全に独立したモードを提供します: Periodモード — 設定可能な本数のローソク足(デフォルト200本)に基づいて計算されるボリュームプロファイル。スイングトレードや日中分析に最適です。 Dailyモード — カスタマイズ可能な開始・終了時刻を設定した現在のセッションに基づいて計算されるプロファ

SMC Pro is a professional Smart Money Concepts indicator designed to help traders read market structure with precision and clarity. It visualizes the core principles used by institutional trading such as Break of Structure (BOS), Change of Character (CHoCH), internal and swing structures, and key liquidity zones directly on the chart in real time. Pricing Launch Price : $33 Incremental Price Increase : The price will increase by $10 after every 10 purchases. Final Price : $69 The indicator autom

ICT Killzones & Pivots Pro is a powerful trading indicator designed to visualize the most important intraday sessions and liquidity zones used by professional traders. It automatically highlights key trading periods such as Asia, London, and New York sessions, allowing traders to clearly see when market activity and volatility are at their highest. Pricing Launch Price : $33 Incremental Price Increase : The price will increase by $10 after every 10 purchases. Final Price : $69 The indicator draw

Support Resistance Pro Toolkit is a professional support and resistance indicator built on advanced Donchian structure logic, designed to provide a clear and structured view of market behavior. It automatically detects key support and resistance zones, tracks their evolution over time, and highlights how price interacts with these levels through sweeps, breakouts, and retests. Pricing Launch Price : $33 Incremental Price Increase : The price will increase by $10 after every 10 purchases. Final P

FOREX MAESTRO INDICATOR USER MANUAL
Introduction Welcome to the FOREX MAESTRO INDICATOR , a powerful next-generation trading intelligence system designed to completely transform how traders analyze, interpret, and execute trades across the financial markets. This is not just an indicator — it is a complete market decision framework that combines: Multi-timeframe signal analysis AI-powered market bias interpretation Institutional-style trend channel mapping Spread & volatility execu

Advanced Market Maker Dashboard by G-Labs — Beat The Market Maker multi-pair scanner for MetaTrader 4. Seventeen-column ADR dashboard with price formation, breaker blocks, TDI SharkFin, RSI divergence, stop hunt, daily candle confirmation, currency strength, and chart overlays from one panel.
The full BTMM workflow dashboard for traders who have outgrown a basic scanner. Monitor 28 or more pairs in real time: trend direction, peak formation side (PFH/PFL), ADR expansion in MAX and real-time col

The "MR Volume Profile 4" indicator is a charting tool that displays trading volume at different price levels rather than time intervals. A key concept in volume profile is the point of control (POC)—the price level with the highest volume traded during the session or time range. While tools like VWAP or OBV provide volume trends, the "MR Volume Profile 4" indicator offers granular detail about where the most market activity occurs at specific price levels. This makes it a more precise tool for

Omega Strike v4.0.3 Indicator is a multi-component trading system that combines filters based on Alligator, Stochastic, MACD, ATR, volume, candle body size, Price Action, RSI divergences and multi-timeframe analysis. The signals are generated when several conditions match, and the signal strength is expressed as a percentage. Built-in modules for money management (martingale), statistics, time filters, advance alerts and dynamic expiration.
Strengths 1. Multi-level signal filtering A com

Our offer also includes a free panel — Indicator Panel — which allows you to show or hide indicators created by BOToBRACIA -> MT4 / MT5 Our offer also includes a version for MetaTrader 5 -> https://www.mql5.com/en/market/product/171230?source=Site+Market+My+Products+Page
FVG is a practical technical analysis indicator that automatically detects and marks Fair Value Gaps (Imbalances) — areas of market inefficiency formed during strong price impulses. These zones are updated in real time an

Our offer also includes a free panel — Indicator Panel — which allows you to show or hide indicators created by BOToBRACIA -> MT4 / MT5 Our offer also includes a version for MetaTrader 5 -> https://www.mql5.com/en/market/product/171232?source=Site+Market+My+Products+Page
HTF Candles is a practical technical analysis indicator that plots candles from a selected higher timeframe directly on your chart. It displays both the candle body and wicks, allowing you to see the full price structure

Our offer also includes a free panel — Indicator Panel — which allows you to show or hide indicators created by BOToBRACIA -> MT4 / MT5 Our offer also includes a version for MetaTrader 5 -> https://www.mql5.com/en/market/product/171235?source=Site+Market+My+Products+Page
The Supply and Demand Zones Indicator is a practical technical analysis tool that automatically detects Supply and Demand zones and plots them on the chart. Each zone remains active until it is fully filled by price. The

MQL5ブログ: https://www.mql5.com/en/blogs/post/768823 MT4版: https://www.mql5.com/en/market/product/171247 MT5版: https://www.mql5.com/en/market/product/171248
フィボナッチプロジェクション[tambangEA]は、トレーダーが市場構造、フィボナッチプロジェクションターゲット、ボリューム反応ゾーン、方向性継続エリアをチャート上で直接特定できるよう設計された、プロフェッショナルなダッシュボードベースのトレーディング分析ツールです。
このツールは、最新のスイング構造を自動的に検出し、フィボナッチベースのプロジェクションレベルを構築し、コントロールポイント(POC)エリアを強調表示し、フィボナッチバンド全体のデルタ情報を表示します。手動でフィボナッチプロジェクションを描画することなく、市場の動きを明確かつ構造的に視覚的に把握したいトレーダー向けに設計されています。
このツールが開発された理由 多くのトレーダーはフィボナッチレベルを手動で

Full Product Description Reversal Edge Nexus is a reversal-focused trading indicator built for traders who want cleaner entries, faster decision-making, and stable signal logic without visual noise. The indicator is designed to detect market exhaustion, flush reversals, and confirmed turning points using a structured multi-engine approach. It can work with the classic reversal engine, the extreme flush engine, or both together, depending on the trader’s style and market conditions. Unlike many i

TTS Zones Still eyeballing support and resistance or drawing lines manually? TTS Zones finds the zones, plots them on your chart, calculates your lot size, tracks how many times each zone was tested, and tells you exactly where price sits between support and resistance — automatically. Drop it on any chart and it works. The indicator scans your price history for pivot highs and lows, builds supply and demand zones from the close prices of extreme bars, and draws them as colored rectangles direct

SMC Market Structure Pro is the advanced version of SMC Market Structure, built for traders who want deeper structural analysis, multi-timeframe context, and real-time notifications — all from a single indicator. Free Lite version
MT5 version What it detects
The indicator automatically identifies and draws: Break of Structure (BoS) – Signals trend continuation Change of Character (CHoCH) – Indicates a potential trend reversal Internal BoS (iBoS) – Break of structure within the current s

The indicator's source code is for sale; those interested can contact me via PM. Supply & Demand Retest Alert – Institutional Trading Simplified Supply & Demand Retest Alert (MT4) is a precision-driven trading tool designed for traders who focus on institutional price behavior and high-probability market zones. Built on the core principles of supply and demand trading, this indicator automatically identifies key imbalance areas where strong buying or selling previously occurred—zones where price

Индикатор TA Inspector - инструмент, который позволит улучшить анализ рынка и поможет определить дальнейшее движение цены на основе геометрических построений и ориентацию целей ценового развития. Индикатор производит самостоятельно построение трендовых линий и предполагаемого расчетного уровня окончания тренда (HP / Hypothetical Point). Индикатор выполняет автоматическое построения моделей метода Tactica Adversa. С точки зрения Tactica Adversa движение цены представляет собой последовательную см

Premium MT4 Custom Indicator: Agil Yahya Trend Filter – Boost Your Trading Accuracy with Trend-Based Signals! The Agil Yahya Indicator is an analytical tool for the MetaTrader 4 (MT4) platform, specifically designed to capture the best trend opportunities in the Forex market. Built using an enhanced core Trend algorithm, this indicator combines price volatility calculations and rigorous trend filtering to provide sharp, accurate Entry signals. Key Product Features: Advanced Trend Algorithm:

Check screenshot friendly beginner guide how to use + cheat sheet!!!
A professional analysis EA that monitors ALL your open trades and tells you which to hold, watch, or close - before it's too late.
Every few seconds, the EA scores each trade from 0-100 across 6 dimensions: Trend, Momentum, Price Action, Volume, Risk, and Correlation. Each trade gets a clear verdict: STRONG HOLD, HOLD, WATCH, CLOSE, or EXIT NOW.
A proprietary Early Warning System that detects momentum acceleration, in

Sunda Nuswantara OS - The Ultimate AI Trading Co-Pilot HEADLINE & HOOK Stop Trading Blindly! Are you tired of buying at the exact top and selling at the absolute bottom? Most traders fail because they only look at the price direction, completely ignoring the market's "Fuel Capacity" (Daily Range) and "Speed" (Volatility Momentum) . Meet Sunda Nuswantara OS , a revolutionary 3-Dimensional AI Trading Co-Pilot. This indicator doesn't just show you arrows; it actively reads the market's momentum, ca

ProEdge ROC MTF Momentum MT4 マルチタイムフレーム・モメンタム指標 ProEdge ROC MTF Momentum MT4 は、複数の時間足でROC分析を行い、高確率のBUY/SELLシグナルを提供するプロ仕様のインジケーターです。 特徴 一般的な指標: 単一時間足 ノイズが多い ProEdge: M5・M15・H1・D1分析 スコア(0–100) トレンド確認 ノイズ削減 シグナル BUY 78 → 強い上昇 SELL 64 → 中程度の下降 ️ 機能 マルチタイムフレーム
フィルター
見やすい表示
ノンリペイント
リアルタイム
ダッシュボード 適用 スキャルピング デイトレ 使用方法 トレンド一致
スコア ≥ 60
明確なシグナル ️ 注意 利益保証はありません。

ICT PO3 (Power of 3) AMD Protocol Framework Indicator
True Time & Structure Integration | Non-Repainting | Real-Time | Multi-Asset | MT5 Version Available
Full Setup Guide & Strategy Playbook: https://www.mql5.com/en/blogs/post/768683 MT5 Version: https://www.mql5.com/en/market/product/171633
Indicator Overview
The ICT PO3 AMD Protocol Framework is a complete structural overlay for MetaTrader 4 that maps the True Daily Cycle directly onto your lower-timeframe execution chart. It projects

一款信号统计指标(MT4)——实现基于当前图表周期下的单线MA转向和双线MA金叉/死叉统计 . 转向定义:前一K向下或走平,当前K向上,视为转向向上;反之,转向向下。
金死叉定义:前一K快线在慢线下方,当前K快线在慢线上方,为金叉;反之,死叉。
参数及使用说明:
1、可指定统计K线数。
2、可指定4个不同的日内时间段,格式如"03:00-07:59",4个时间段可交叉任意输入。
3、可配置ABC三个浮盈区间段点值。如:分界区间统计小点值设为500,即当某转向信
号出现后到下一反向信号止浮盈<=此点值,计入A区间;
若大于此点值<大分界点值时,计入B区间;若大于“大分界点值”计入C区间。
4、最大/最小浮盈统计。显示所有统计区间内的最大浮盈点值和最小浮盈点值(亏损点值)。
5、输出完整信号,按信号出现顺序排列,如“ACCBCA”之类。
6、综合预测。使用概率、周期、趋势、马尔可夫链等综合概算输出预测该信号出现的归类概率值。
7、加载指定MA线。在当前图表自动载入相应设置的MA线。
8、自适应列宽。以完整显示统计信号数。
9、用法:点击相应统计按钮即输出相应的统计表格.
MetaTraderマーケットが取引戦略とテクニカル指標を販売するための最適な場所である理由をご存じですか?宣伝もソフトウェア保護も必要なく、支払いのトラブルもないことです。これらはすべて、MetaTraderマーケットで提供されます。

取引の機会を逃しています。
- 無料取引アプリ
- 8千を超えるシグナルをコピー
- 金融ニュースで金融マーケットを探索