Advanced Price Movement Predictor Pro Edition MT4
- インディケータ
-
Boris Armenteros
 Take a look at our products here: https://www.mql5.com/en/users/barmenteros/seller
 - バージョン: 3.4
- アップデート済み: 9 6月 2020
- アクティベーション: 20
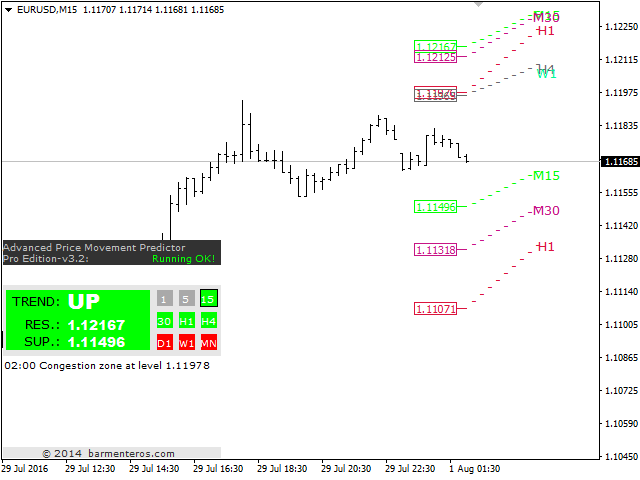
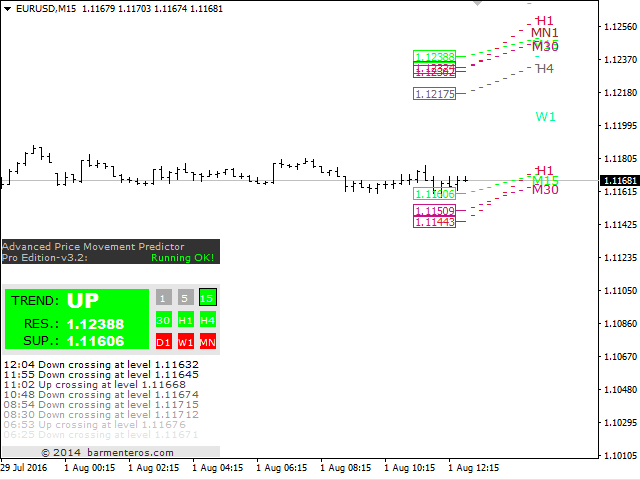
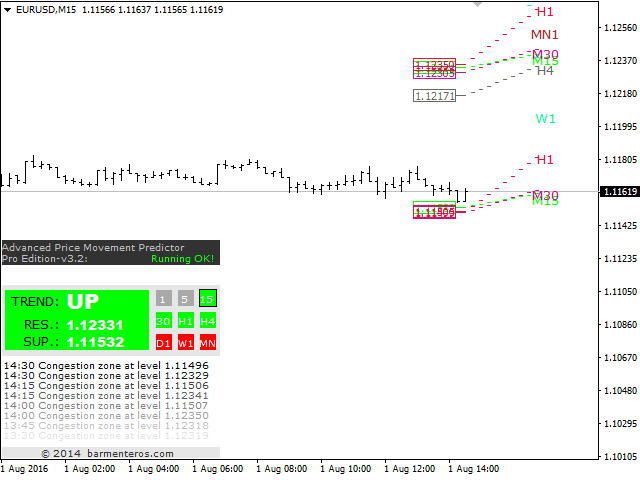
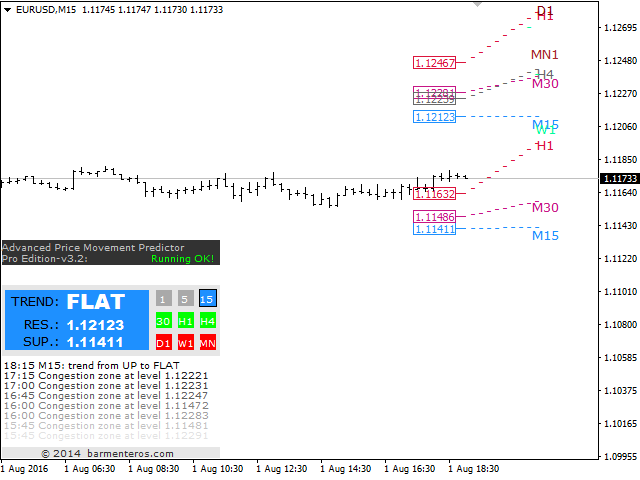
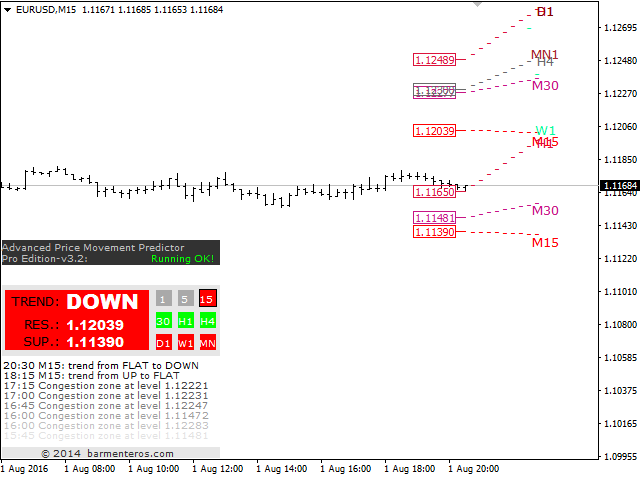
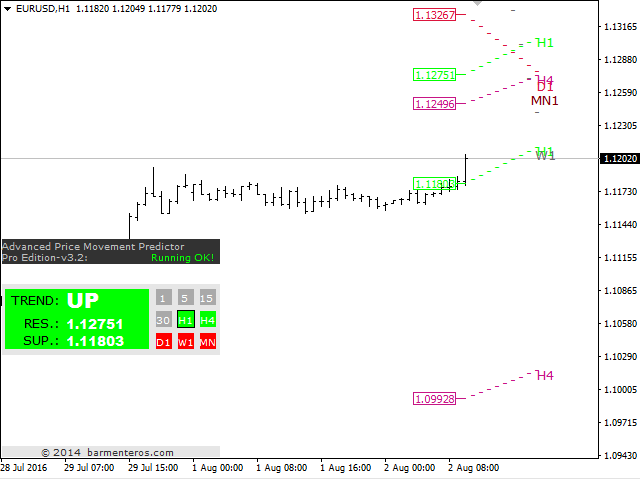
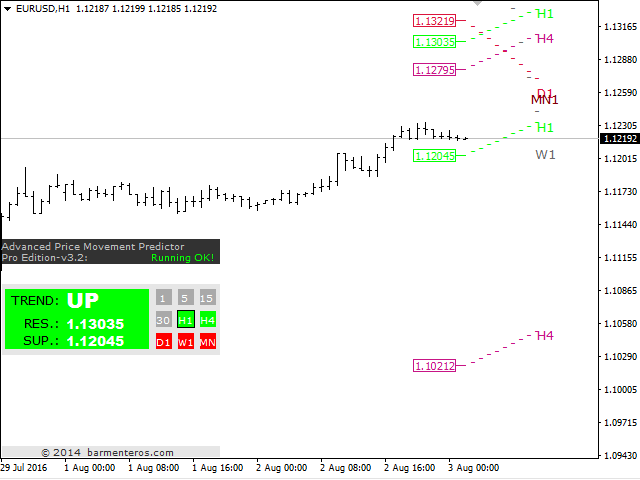
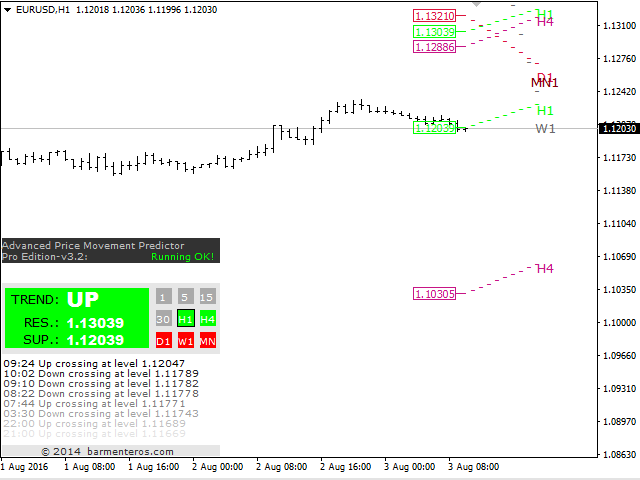
It predicts the most likely short-term price movement based on advanced mathematical calculations.
Features
- Estimation of immediate price movement;
- Calculation of the real market trend;
- Calculation of the most important support and resistance levels;
- Algorithms optimized for making complex mathematical calculations with a minimal drain of system resources;
- Self-adjusting for better performance, so it’s able to work properly at any symbol (no matter how exotic it is) and any timeframe;
- Compatible with any MetaTrader platform, regardless of the number of digits or other parameters;
- Compatible with any other tool (indicator, EA or script) without slowing down the terminal performance and the trading operations.
Introduction
Most of the classic indicators that make up the common trading strategies are based on simple math, not because when these indicators were created there were no outstanding mathematicians (in fact there were probably best mathematicians then than now), but because computers did not exist or they simply had a low processing power to perform complex mathematical operations consistently. Nowadays, any smartphone surpasses overwhelmingly the most powerful computer just a few decades ago. So the ability to process huge amounts of information is not a limitation in these days, except for extremely complex process simulations.
Advanced Price Movement Predictor (APMP) indicator takes advantage of current processing capacity to capture the essence of price swings through some of the most advanced mathematical, statistical and probabilistic concepts.
APMP does not provide a prediction itself, since the price movement is a non-stationary stochastic process and therefore it is not predictable. However, it makes a dynamic and highly reliable estimation of the immediate price movement.
Based on the same analysis, APMP displays the current real trend of the market. Why real trend? Is not real the trend obtained with other indicators? So far the trend is almost always obtained from classic indicators like Moving Averages, Bollinger Bands or Parabolic SAR, or simply by the traditional method of manually drawing a line (or two parallel lines) between two or more significant points.
Obviously, those indicators and methods are still valid, especially since they are used by most of the traders, but do most of them obtain sustained profits? We have the intuition that they do not. With this indicator you can strengthen or improve your current trading method, or you can simply dismiss it because you will see that even the most chaotic behavior, such as the market price, respects the large numbers and is limited to the rigor of the all powerful mathematical laws.
More details:


Useful indeed.