YouTubeにあるマーケットチュートリアルビデオをご覧ください
ロボットや指標を購入する
仮想ホスティングで
EAを実行
EAを実行
ロボットや指標を購入前にテストする
マーケットで収入を得る
販売のためにプロダクトをプレゼンテーションする方法
MetaTrader 4のためのテクニカル指標 - 150

candlestick pattern , MT4 pattern detector , forex signals , trend reversal , candle scanner , pattern recognition , MetaTrader 4 , forex indicator - QuantumPro Pattern Detector / Advanced Candle Pattern Recognition System for Smart Traders QuantumPro Pattern Detector is a powerful and lightweight indicator designed to recognize the most important candlestick patterns used by professional traders for technical analysis. Whether you're a beginner or an advanced trader, this tool helps you m

Arsi Scalper Pro – Smart Entry/Exit Signal System Arsi Scalper Pro is a powerful, non-repainting signal indicator built for precision scalping and intraday trading. Designed with statistical logic and volatility filtering, it helps traders enter and exit with clarity and speed. It works across multiple timeframes and pairs, especially effective on M1 to M30 charts. Key Features Buy ( ^ ) and Sell ( v ) text signals directly on chart Advanced logic with ATR and dynamic smoothing Timef

This type of riskless arbitrage is based on overlooked patterns, where the goal is to convert the trend of EURUSD into a set of periodic functions, each of which continuously crosses the zero line. Which means that the PnL of each set keeps oscillating between positive and negative. It is riskless because profitability depends NEITHER on trending action NOR flat market! It depends on obscure correlation patterns which you cannot see while looking at any of the 4 pairs involved. This you will no

Robinhood Gold EA – Smart Auto Trading Expert (MT4) Version: 1.00
Platform: MetaTrader 4
Recommended Timeframes: M15 & H1
Main Pair: XAUUSD (Gold), also works with GBPUSD, EURUSD, GBPJPY What is Robinhood Gold EA? Robinhood Gold EA is a fully automated trading system designed to enter trades only at the most confirmed breakout moments. It combines trend structure logic with RSI confirmation and executes trades based on visual arrow signals provided by the Robinhood Arrow Indicator , which

QuantumEdge Trader v1.0
AI-Powered Precision Signals for Serious Traders
QuantumEdge Trader is a smart and reliable indicator that delivers accurate BUY and SELL signals using advanced market analysis and trend detection. Designed for M1 to M60 timeframes, it's ideal for scalping and intraday strategies.
---
Key Features:
No Repaint – Signals never change after appearing
Smart trend filters to reduce noise
Adjustable sensitivity and alerts
Perfect for XAUUSD, EURUSD, and m
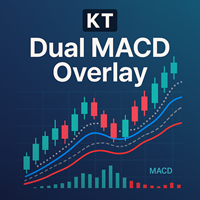
KT Dual MACD Overlay は、現在足と上位足の 2 本の完全な MACD オシレーターを価格チャート上に重ねて表示します。高速 MACD は短期モメンタムを捉え、低速 MACD は大局的なトレンドとの整合性を保ちます。 2 本をローソク足に重ねることで、ウインドウを切り替えることなく市場モメンタムを一望できます。
買いエントリー
メイン買い: 上昇トレンド開始時に青い縦線を表示。 追撃買い: 高速 MACD がシグナルラインを上抜け、低速 MACD と上昇トレンドが一致したときに発生。 売りエントリー メイン売り: 下降トレンド開始時にオレンジの縦線を表示。 追撃売り: 高速 MACD がシグナルラインを下抜け、低速 MACD と下降トレンドが一致したときに発生。
特徴 高速+低速の 2本 MACD で構成され、単体 MACD より文脈が明確。 新トレンド開始を示す縦線をチャートに描画。 メインサインを逃しても、複数回の再エントリー機会を提供。 標準 MACD クロスと比べて精度と視認性が大幅に向上。 3 つの主要イベントでアラート送信:トレンド変化・高速 MACD

Clearly displays uptrend and downtrend lines based on SmartTrend333 logic
Shows arrow signals at key trend reversals to help you catch early entries
Works great for scalping, intraday, and swing strategies across all timeframes
Trend detection based on advanced mathematical smoothing and normalization
Helps reduce noise and filter fakeouts in sideways markets
Lightweight and optimized for fast performance with zero lag
Compatible with all MT4 brokers and instruments (forex, crypto
Welcome to order block indicator – your complete solution for identifying high-probability zones using order blocks , BOS (Break of Structure) , and CHOCH (Change of Character) .
Designed for precision and speed, this tool gives you the edge in spotting potential reversal and continuation zones just like the pros.
Features : Automatic Order Block Detection: Effortlessly identifies valid bullish and bearish order blocks based on price structure and market behavior. BOS & CHOCH Detect

Last frontier. Spartan is a premium "AI powered indicator" designed to identify the direction of price movements and potential reversal and exhaustion points. This tool is particularly beneficial for individuals seeking a clearer price movement. It can function as an enhancement to existing trading systems, operate independently, or assist in scalping strategies.
Price $499 for the first 5 customers, then it will reach $1999
Suggested time frame M1
1. Open BUY trades on arrow signal. Open S
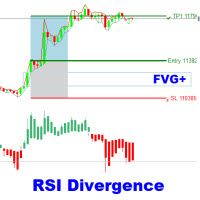
The RSI Divergence + FVG Signal indicator combines Relative Strength Index (RSI) Divergence with Fair Value Gap (FVG) detection to generate high-probability buy and sell signals based on both momentum shifts and institutional imbalance zones. Core Features: RSI Divergence Detection :
Identifies both regular and hidden bullish/bearish divergences between price and RSI. Divergences indicate potential trend reversals or continuation. FVG Zone Recognition :
Detects Fair Value Gaps (imbal

It's a very convenient and easy to use indicator, as well as powerful and accurate. It detects and visually displays the start of a new trend. It is presented in a two-color bar chart: one for the start of an uptrend and one for the start of a downtrend. The indicator only requires the number of bars to look at for its calculation. Calculation. a) The indicator compares the current candlestick close with the high or low of the previous candle group. If it's higher than the high, it indicates an

Range Filtered AlgoAlphaは、市場のボラティリティを分析することで潜在的な取引機会を特定するためのテクニカル分析ツールです。このMetaTrader向けAlgoAlphaオリジナルTradingViewインジケーターの改訂版は、複数の分析方法を組み合わせて視覚的な市場評価を提供します。 技術的特徴
価格平滑化にカルマンフィルター(Kalman Filtering)を採用
ボラティリティ測定にATRベースバンド(ATR-based Bands)を統合
トレンド分析にスーパートレンド(Supertrend)要素を組み込み
カラーろうそく足(Candles)とマーカー(Markers)で視覚的シグナルを提供
設定可能なアラート機能(Configurable Alerts)を装備 機能性
当インジケーターは市場データを処理し以下を実現:
ATR(平均真の範囲)を使用したボラティリティレンジ計算
市場ノイズ低減のためのフィルタリング技術(Filtering Techniques)適用
視覚的要素(Visual Elements)による潜在的なトレンド方向の表示 使用事例
ボ
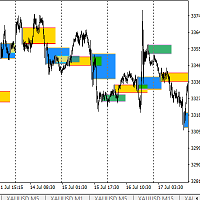
Trade are base on Breakout Session Box ( based on Time Setting ) . Can use for scalping , intraday or reversal ( based on your experience ) Can be use on M1 to M30 chart . Best use on M30 and Trade on M5 . Trade can be use buy limit/sell limit or buy stop/sell stop depend on your trading style .
Setting file are The best time setup to trade for Gold or Xauusd as per my trading style .

RSIBandsTREND is a custom trend-focused indicator that enhances the classic RSI approach by visualizing dynamic upper and lower bands based on RSI calculations.
It plots three clean bands (upper, lower, and midline) directly on the chart, helping traders identify overbought and oversold zones with precision. Features: Three-band system: upper, lower, and center RSI lines EMA-smoothed RSI band calculation Clear trend zone visualization on chart Works on all timeframes (M1 to Monthly) Fully opt

Detailed Description with screenshots here: https://www.mql5.com/en/blogs/post/763562
Features Three Hull MA Variations: Classic HMA, Exponential HMA (EHMA), and Triangular HMA (THMA) Multi-Timeframe Support: View higher timeframe Hull MA on any chart Dynamic Color Coding: Automatic trend-based color switching for easy visualization Candle Body Coloring: Color candle bodies based on Hull trend or price position Real-Time Alerts: Get notified on trend changes and candle color switches Customiza
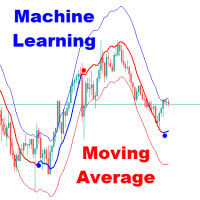
The Adaptive Gaussian Moving Average or also known as Machine Learning Moving Average (MLMA) is an advanced technical indicator that computes a dynamic moving average using a Gaussian Process Regression (GPR) model. Unlike traditional moving averages that rely on simple arithmetic or exponential smoothing, MLMA applies a data-driven, non-linear weighting function derived from the Gaussian process, allowing it to adaptively smooth the price while incorporating short-term forecasting cap
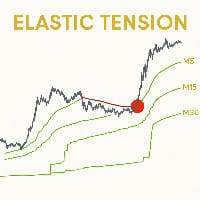
Elastic Tension MTF (M5 Only)
Индикатор многотаймфреймового натяжения цены Автор: Александр Лапин Профиль на MQL5
---
Описание
Elastic Tension MTF — это интеллектуальный авторский индикатор, основанный на концепции «упругой силы» в движении цены. Он анализирует рыночные данные с нескольких таймфреймов и визуализирует потенциальные уровни натяжения цены, отображая их на графике M5.
Индикатор моделирует поведение цены как движение под действием силы упругости, рассчитываемой по

Radius Trend by ChartPrime MT5 で取引戦略を強化しましょう。この先進的なツールは, 価格アクションとボラティリティに基づいてトレンドバンドを動的に調整し, トレンド方向, 強度, 潜在的な反転についてのリアルタイムインサイトを提供します. ChartPrimeによって開発されたこのインジケーターは, 静的なトレンドラインとは異なり, グラフをレーダーのようにスキャンするユニークな半径ベースの方法を使用し, 市場条件に適応します. MQL5で革新的なアプローチにより人気があり, マルチタイムフレームサポートとExpert Advisor統合で好評を博し, ボラティリティの高い環境でトレンドの流動的なビューを提供します. Radius Trend はボラティリティに拡張/収縮する外部と内部バンドでトレンドを視覚化し, 正確な配置のために平滑化計算を使用します. メイントレンドラインはステップベースの半径を通じて角度をシフトし, 上昇トレンド (chartreuse) または下降トレンド (赤) を強調し, 点線の内部バンドは反転や継続を検知するのに役立ちます.
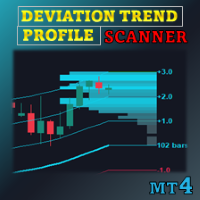
特別オファー : ALL TOOLS 、各 $35 のみ! 新しいツール は $30 ( 最初の1週間 または 最初の3件の購入 まで)です! MQL5のTrading Toolsチャンネル :最新情報を受け取るにはチャンネルに参加してください Deviation Trend Profile Scanner (DTPS) は、トレンド方向を検出し、ボラティリティを測定し、複数のシンボル/時間足の情報を1つのテーブルに整理するインジケーターです。設定可能な移動平均、適応型標準偏差ゾーン、分布ヒストグラムを使用して、価格行動を統計的に簡潔に表示します。 MT5版を見る: Deviation Trend Profile MT5 Scanner 他の製品はこちら: All P roducts 1. 概要 このインジケーターは次の3要素で構成されます: 移動平均 (MA) 標準偏差ゾーン (±1, ±2, ±3 × ATR) トレンド分布プロファイル (ヒストグラム) 2. コア概念 MAの傾き (|Slope| > 0.1): トレンド転換を検出 — 正 =
Cm Ultimate Ma Mtf MT5 で取引決定を強化しましょう, さまざまなMAタイプをサポートする多機能移動平均インジケーターで, マルチタイムフレーム分析のための広範なカスタマイズを提供します. TradingViewの人気ツールにインスパイアされ, MT5用に洗練されたこのインジケーターは, SMA, EMA, WMA, HullMA, VWMA, RMA, TEMA, Tilson T3 を含む, 2010年代以降, 異なるタイムフレームからデュアルMAをプロットする能力で人気を集めています. 非再描画でユーザー友好, 価格クロスとMA交差を強調, forexや暗号のようなボラティリティの高い市場でのトレンド検知に理想的です. トレーダーは Cm Ultimate Ma Mtf をデュアルMA機能で好み, 上位タイムフレームから第2 MA (例: H1チャートでのデイリー) を許可してクロス検知と方向に基づく色変更を行います. Highlight bars は価格がプライマリまたはセカンダリMAをクロスするシグナル, 潜在的なエントリー/エグジットを検知するのに役

About:
QQE Dual Pulse is best for people who are using QQE with their existing trading strategies to validate trends. It is an oscillator that combines two QQE calculations with Bollinger Band filtering to identify high-probability trading signals. This indicator helps traders spot momentum shifts and trend changes with reduced false signals.
Detailed description with screenshots is in blog post: https://www.mql5.com/en/blogs/post/763582
What is QQE and QQE Mod?
QQE original: is an enhanced

This indicator is deliberately constructed to avoid repainting. Once a candle has closed, the output it produces remains fixed and unchanged. This behavior ensures accuracy during backtesting and provides reliability in real-time strategy execution.
Unlike traditional methods such as linear or polynomial regression, kernel-based methods don't assume any specific form or distribution for the data. Instead, they rely on a kernel function —a mathematical tool that assigns influence to each nearby

High Timeframe Exponential Moving Average (HTF EMA) Spot the Trend with Clarity – No Matter Your Timeframe!
The HTF EMA Indicator brings the power of higher timeframe analysis right onto your current chart. Whether you're trading M5,M15, H1, or any intraday timeframe, this tool overlays the Exponential Moving Average (EMA) from your chosen higher timeframe—such as H1, H4, or D1—so you can make smarter, more confident decisions.
Key Features: Displays EMA from Higher Timeframes directly o

Common Channel Index (CCI) Multi-Period Overlay Overview:
The Common Channel Index Multi-Period Overlay is a powerful -based tool that brings clarity and multi-timeframe insight into your trading decisions. By combining three different Commodity Channel Index (CCI) periods — 5 , 15 , and 60 — into a single, unified display, this indicator offers a layered view of market momentum and overbought/oversold conditions. Key Features: Triple CCI Overlay:
See short-term (5), mid-term (15), a

PipStartexはスキャルピング用のインジケーターです。買われすぎ/売られすぎの価格帯をチャネルの形でチャート上に描画します。また、価格がチャネルを超えると、チャート上に黄色のドットが描画されます。価格がこのチャネルを超えると、必ず元のチャネルに戻ろうとします。このパターンを理解すれば、すべてのトレーダーが取引に活用できます。売られすぎゾーンの価格がチャネルの赤いゾーンを下回ると、買い注文がオープンします。買われすぎゾーンの価格がチャネルの青いゾーンを上回ると、売り注文がオープンします。97%のケースでは、価格は常にすぐにコンフォートゾーンに戻ろうとします。コンフォートゾーンとは、価格がチャネル内にあるときです。価格がチャネルを超えると、そこに不快感を覚えます。この現象を確認するには、インジケーターのデモ版をダウンロードし、ビジュアルモードのストラテジーテスターでテストしてください。 このインジケーターを使用する理由: このインジケーターは、97%のケースで機能するパターンをチャート上に示します。 インジケーターは値を再描画しません。 日足のM5、M15、M30、H1で効果的に機

Elevate your chart analysis with precision visual signals. The CandleBodyArrows indicator is designed for traders who value clear, actionable chart insights. It automatically identifies significant candle movements based on user-defined thresholds and highlights them with intuitive up and down arrows. Whether you're trading trends or volatility, this tool offers an additional layer of visual confirmation that integrates seamlessly with your existing technical approach. Key Features: Highlights c

Keltner Channel MultiBand – Period 20 | ATR 10 | Bands 1.5, 2.0, 2.5 Unlock Precise Market Timing with Triple-Band Trend Mapping The Keltner Channel MultiBand is a powerful technical tool designed to help traders identify trend opportunities , optimize entry points , and strategically place Take Profit (TP) and Stop Loss (SL) levels. Key Features: Triple Bands (1.5x, 2.0x, 2.5x ATR) : Offers a multi-layered view of price volatility, helping you gauge the strength of market momentum with gr
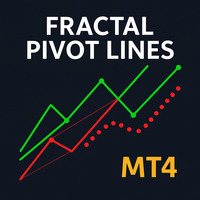
Fractal Pivot Lines — Indicator Overview Fractal Pivot Lines is a custom trend-structure indicator for MetaTrader 4 .
It automatically connects key fractal highs and lows with dynamic lines so you can see how price is respecting local structure, building channels, and preparing for potential reversals. Instead of staring at dozens of candles and guessing where the real pivots are, the indicator turns fractals into clear support/resistance paths and trend channels . What the Indicator Does C

Ninja Trend Oracle — Master the Trend Like a Ninja The Ninja Trend Oracle is your secret weapon for identifying high-probability trend reversals, breakouts, and pullbacks — all with deadly precision . Whether you’re a scalper, day trader, or swing trader, this all-in-one trend detection tool helps you: Spot the direction with clarity Catch early entries with confidence Avoid false breakouts and choppy zones Receive clean visual signals and alerts Features: Smart Trend Zones: Dynamically det

クイックラインツール:トレンドラインと長方形をプロットするための便利な指標
クイックラインツールは、テクニカル分析のための迅速かつ効果的なツールを必要とするトレーダーのために設計されたMetaTrader4のための強力で直感的な指標 この指標を使用すると、トレンドライン、サポート/抵抗レベル(AP/DW)、および長方形を簡単に作成して、チャートレイアウトプロセスを最適化できます。 この指標は、分析の精度と速度を向上させようとしている初心者とプロのトレーダーの両方にとって理想的です。
主な利点
直感的なインターフェイス:"ショー"機能をサポートするユーザーフレンドリーなボタンパネルを介してすべての機能を制御します。|気を散らすものを最小限に抑えるために「非表示にします。
設定の柔軟性:カスタマイズ可能な色、ラインスタイルと太さだけでなく、あなたの取引スタイルに適応するためのボタンのサイズと位置。
マルチタイムフレームのサポート:トレンドラインと長方形は現在の時間枠と下の時間枠に表示され、AP/DWラインとキーボタンはすべての時間枠に表示さ
安定した配置:

The Trend and Revesal Indicator is a custom indicator designed to help traders identify trend direction, reversal points, and high-probability trade setups. It uses advanced mathematical calculations to analyze market behavior and highlight potential turning points with great accuracy. This indicator measures buying and selling pressure over a defined period and shows which side is in control. It provides a clear visual display of trend zones, reversal arrows, and momentum signals in a separate

Schemes 2.0 – MT4チャートを瞬時に変身 Meta Trader 4の究極のビジュアル強化ツール、Schemes 2.0で、トレーディング体験をアップグレードしましょう。 プロがデザインした9種類のカラーテーマとスマートなトグルインターフェースにより、シンプルなミニマリズムから鮮やかなハイコントラストまで、チャートスタイルをワンクリックで瞬時に切り替えられます。
トレーダーがSchemes 2.0を愛する理由 1. 9種類のプレミアムテーマ – ライトからダーク、クラシックからモダンまで、あらゆるトレーディングスタイルに合わせてカスタマイズできます。 2. ワンクリックスタイル設定 – チャート設定の調整に時間を無駄にすることなく、瞬時にチャートを変身させます。 3. スマートトグル – いつでもコントロールの表示/非表示を切り替えて、作業スペースを無駄なく活用できます。 4. プロフェッショナルな外観 – スクリーンショット、シグナル、ライブトレーディングプレゼンテーションに最適です。 5. 軽量&簡単 – インストールが簡単で直感的に操作でき、無駄な作業は一切あり

Triple Momentum Pro - The Ultimate 3-in-1 Trend Indicator for MT4 Unlock the power of Triple Momentum Pro , the all-in-one indicator that combines three powerful, customized trend-following systems into a single, easy-to-read visual tool. Stop cluttering your charts with multiple indicators and get clear, confident signals for any market and any timeframe. Key Features: Three Powerful Indicators in One: Combines a unique FollowLine trend-tracker, a classic SuperTrend , and the dynamic PMax (Prof
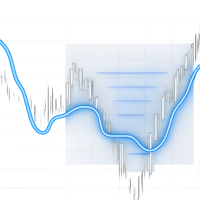
ShiftedPriceDensity — Professional Price Density Indicator with Shifted Historical Levels ShiftedPriceDensity is an advanced technical custom indicator for the MetaTrader 5 platform that visualizes the most significant horizontal price levels based on historical shifts . This tool is ideal for traders who practice cluster analysis , build support and resistance levels , and look for key price zones in volatile market conditions. The indicator is built upon the concept of

ShiftedPriceDensitySet – Advanced Price Density Level Analysis with Time Shifts ShiftedPriceDensitySet is a powerful professional indicator for MetaTrader 5 , designed to visualize key price density levels across multiple time-shifted segments of historical data. It builds multiple instances of the embedded PriceDensity indicator with configurable depth and shift settings to reveal consistent price clusters that often act as support/resistance zones or areas of strong market interest. This is an
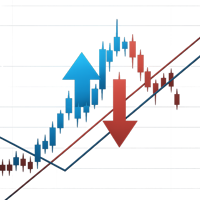
Pointer Trend Switch — precision trend reversal indicator Pointer Trend Switch is a high-precision arrow indicator designed to detect key moments of trend reversal based on asymmetric price behavior within a selected range of bars. It identifies localized price impulses by analyzing how far price deviates from the opening level, helping traders find accurate entry points before a trend visibly shifts. This indicator is ideal for scalping, intraday strategies, and swing trading, and performs equa

VertexVision Pro – Precision-Powered Trading Signals VertexVision Pro is a professional-grade trading indicator designed for MetaTrader 4 that combines intelligent price action analysis, smart trend filtering, and optional multi-timeframe (MTF) confirmation to generate high-confidence BUY and SELL signals . Whether you're a beginner or a seasoned trader, VertexVision Pro gives you the visual edge and analytical power to make confident decisions in volatile markets. Key Features: Accur

Directional Trend Line — Directional Trend Indicator for MetaTrader
**Directional Trend Line** is a professional tool for traders that allows you to:
* Accurately determine the current market trend * Timely detect phase shifts in market structure * Clearly visualize the dominant price movement direction
### ** Key Features **
#### 1. ** Automatic Adaptation to Any Timeframe **
* Automatically adjusts the CCI period for M1…MN * Enables optimal sensitivity across different timeframes *

Trend TD Ultimate — The All-in-One Trend Indicator for MetaTrader Trend TD Ultimate is a modern, all-in-one trend indicator for MetaTrader 5. It combines advanced trend-following logic, smart price pattern analysis, and integrated trade evaluation features — all in one powerful tool. It is built for traders who need accuracy, flexibility, and visual clarity — on forex, stocks, indices, commodities, and crypto . Key Features & Benefits 1. Multi-Purpose Trend Signal Engine Generates Bu

指標はその作成において普通です。 これは、高値と安値を計算し、平均価格とそれらを相関させます。 それの唯一の美しさは、それが過去の日のパラメータと現在のパラメータを相関させることであり、それが私がそれを「その日」と呼んだ理由です。"これは、H1時間チャートの期間のために開発されました。 そして、それは彼が正しく行動する場所です。 設定では、パラメータを設定するのは簡単です。長さは平均価格を決定します。 パラメータ:primは、指標が平均価格を計算するために使用する価格を示します。 たとえば、2つの指標をチャートに配置し、1つの指標の低価格をプリムパラメータで指定し、もう1つの指標の高価格を指定すると、これら2つの指標がコリドーを作成します。 また、2つの指標を使用してストップロスを設定することもできます。 最初のパラメータがprim=Low、2番目のパラメータが=Medianであり、買い注文または売り注文の配置に応じて、ストップロスを中央線を超えて移動できるとします。 パラメータ:countは、最大値と最小値の計算を行います。 つまり、カウントするバーの数です。

Smart Money Concepts (SMC) Indicator The SMC Indicator is an advanced market structure tool designed for traders who want to trade like institutions. It automatically detects and plots key Smart Money concepts on your chart, giving you a clear view of market intent and high-probability trade setups. Core Features Market Structure Detection – Automatically identifies Break of Structure (BOS) and Change of Character (CHoCH) to spot trend shifts and reversals. Multi-Timeframe Support – Analyz

**Volume Trend Navigator** is a modern volume-based trend indicator that spots when market momentum is accelerating or fading by analyzing volume and recent price swings over three bars:
* **Bullish acceleration**: Draws an ↑ arrow when the current bar’s volume exceeds that of the two preceding bars **and** price closes above the previous bar’s high—signaling a strengthened up-trend. * **Bearish acceleration**: Draws a ↓ arrow when the current bar’s volume exceeds that of the two preceding bar

Indicator “Tempest” for MQL5 Market (SEO-optimized, in English)
1. Introduction The Tempest indicator is a modern technical tool for MetaTrader 5 designed to automatically detect market reversal points by analyzing RSI across multiple timeframes.
Provides clear BUY/SELL signals that allow traders to react instantly to market conditions.
Easily integrates into Expert Advisors for fully automated trading.
SEO Keywords: Tempest, RSI indicator, MQL5 trading robot, Forex automation, RSI strategy

Equilibrium — Multi-Timeframe CCI Reversal Indicator for MetaTrader 5 Equilibrium is a powerful technical indicator for MetaTrader 5, built on the Commodity Channel Index (CCI) to automatically detect potential market reversal points.
Designed for both manual traders and automated strategies, Equilibrium delivers precise BUY/SELL signals, adapting to changing market conditions in real time. Easily integrates into any MQL5 Expert Advisor for full automation.
SEO Keywords: CCI indicat
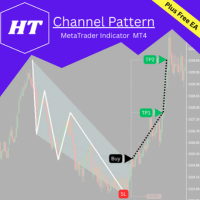
HTチャネルパターン – 高度なチャネル検出とブレイクアウト確認ツール
HTチャネルパターンは、FX市場における最も効果的なプライスアクションパターンの1つであるチャネルパターンを検出するために設計されたプロフェッショナルインジケーターです。市場が上昇チャネルまたは下降チャネルを形成しているかに関わらず、このツールはパターンを自動的に認識し、潜在的なトレードチャンスに対して明確な視覚的情報を提供します。
主な機能: 上昇および下降チャネルパターンの両方を検出 市場構造に基づいて波とチャネルの境界を描画 モメンタムキャンドルロジックを使用して確定されたブレイクアウトポイントを識別 エントリープライス、ストップロス、2つのテイクプロフィットレベルを提案 M1のような低いタイムフレームでも高いパフォーマンスを発揮し、スキャルピングに最適 購入者には無料のエキスパートアドバイザー(EA)が付属
モメンタムキャンドルによるブレイクアウトロジック:
このインジケーターは、モメンタムキャンドルが形成されたときにブレイクアウトポイントを識別します。モメンタムキャンドルには次の条件があります:
ユ
MT4用 Candlestick Pattern Analyzer(ローソク足パターンアナライザー) 説明
Candlestick Pattern Analyzer は、裁量トレーダーとシステマティックトレーダーの両方を対象とした高度なツールで、主要な日本のローソク足パターンを自動的に検出し、それらの過去のパフォーマンスを詳細に統計分析します。 このインジケーターは、パターンの実際の有効性を客観的に検証し、トレンド、重要な価格帯、出来高などの確認フィルターや明確に定義されたリスク管理戦略と組み合わせて使いたいトレーダーに最適です。 主な機能 20種類以上のローソク足パターン(強気/弱気)を自動検出し、チャート上で視覚的にハイライト表示 各パターンの出現後、設定可能な本数の後続バーにおける平均および総利益を計算 各パターンの検出回数をカウントし、頻度を客観的に把握 カラーボックスとテキストラベルによるチャート上のビジュアルマーキング 新しいパターン検出時のリアルタイムアラートとプッシュ通知 パターンの有効/無効切替、色の選択、分析期間の設定、情報要素の位置調整など、完全にカスタマイズ可

Visual Trend is a simple and effective tool that helps you quickly assess the market situation and find trend-based entry points. It eliminates the need to use multiple indicators at once by combining all the essentials in one place. Key Features: Background Coloring: The chart background automatically changes color based on the trend direction (blue for uptrend, pink for downtrend). Clear Signals: Trend-following entry points are marked with arrows. Signal Candle Highlight: The candle o
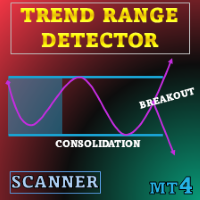
特別オファー : ALL TOOLS 、各 $35 です! このツールは 3日間無料 でご利用いただけます。お見逃しなく! 新しいツール は $30 で 最初の1週間 または 最初の3回の購入 に適用されます! Trading Tools Channel on MQL5 :最新情報を受け取るために私の MQL5 チャンネルに参加してください Trend Range Detector は、価格のレンジ形成をデータドリブンで把握したいユーザー向けに作られました。主観的なチャート読みではなく、明確なボラティリティルールで価格の停滞とブレイクアウト開始を示します。 MT5 版はこちら: Trend Range Detector MT5 Scanner その他の製品: All P roducts 概要 Trend Range Detector Scanner は、ボラティリティと直近の値動きから導出したレンジボックスを描画し、価格圧縮期間を示すテクニカル指標です。終値がバンド内にある間はボックスを維持し、抜けると更新します。 ボラティリティエンベロープと加重セン

ChronoVolume Detailed Blog post with screenshots: https://www.mql5.com/en/blogs/post/763650
It is an advanced volume analysis indicator.
Overview:
ChronoVolume analyzes volume data in MetaTrader 4 by converting basic tick volume into meaningful trading insights.
Since MT4 only provides tick volume (number of price changes), this indicator uses algorithms to estimate buying and selling pressure, giving you a clearer picture of market sentiment.
The indicator offers three ways to calculate volum

取引の多様性を高めるMake Your Own Index MT4インジケーターは、任意のシンボルからパーソナライズされたインデックスを作成できるカスタマイズ可能なツールで、それらを均等または加重割り当ての単一ラインにブレンドし、セクター性能、多様化ポートフォリオ、または戦略特定バスケットを追跡します。1957年以来市場キャップ加重のS&P 500のような確立されたインデックスや、2000年代に普及した均等加重代替品に着想を得たこのインジケーターは、外汇、暗号、株式トレーダーに好まれ、tailoredベンチマークを作成します。それはデュアル移動平均 (デフォルトEMA 20/50) を通じたトレンドクロスオーバーの識別で優れ、ブル/ベアシフトを検知し、支配資産のバイアスを減らし、入/出場のための精密シグナルを提供—リスク多様化、戦略アライメントを改善し、イントラデイから長期保有までのボラティル市場で収益性を向上させます。 Make Your Own Index MT4は、加重インデックス値の白ライン、速いMA (期間20)の赤、遅いMA (期間50)の緑をプロットし、トレンド確認のため
Dynamic Color Fibonacci Indicator This tool is designed to automate the process of drawing and updating Fibonacci levels on your chart. It automatically adjusts to market trends, providing clear visual cues and alerts to help you analyze price movements. Key Features Adaptive Colors: The Fibonacci lines automatically change color to reflect the current trend. They appear blue during uptrends and red during downtrends, giving you an immediate visual sense of the market direction without manual a

One month free trial
Title: EnhancedSignalFilter V2: Smart Trading Signal Validator – Filter Noise, Boost Profitability Description: Tired of chasing false signals that drain your trading account? Introducing EnhancedSignalFilter V2 – the ultimate tool that accurately distinguishes high-probability trades from market noise.
This advanced indicator is designed for both novice and professional traders. Through multi-layer validation mechanisms, it precisely identifies true signals, false signals
VortexX ULTRA PRO — Powerful Arrow Indicator for BTCUSD & EURUSD VortexX ULTRA PRO is a high-precision arrow indicator for MetaTrader 4, designed for confident trading on H4 and D1 timeframes. Specifically optimized for BTCUSD and EURUSD , it provides reliable and accurate buy/sell signals — even during high market volatility. Key Features of VortexX ULTRA PRO : ️ Works on H4 and D1 timeframes ️ Optimized for BTCUSD and EURUSD ️ Based on a proven dual EMA strategy ️ Clear BUY/SELL arrows
Signals with TP SL Indicator — a powerful trading tool that combines EMA crossover , RSI filter , and ATR-based TP/SL levels to help you spot high-probability market entries. This indicator is built to visually support the Signals with TP SL Expert Advisor , but can also be used manually as a standalone confirmation tool for intraday and swing trading. Features: Buy/Sell arrows based on EMA crossover + RSI condition Real-time dynamic SL and TP levels calculated using ATR Plots arrows directly

ALL IN ONE INDICATOR :
Auto Multi Trend : Alligator_MTF ( Trend Is Your Friend ) Auto Fibo CBR : Breakout Confirmation Auto Smart Money Area : Download Here https://linktr.ee/ARFXTools
Alligator Fibo Musang CBR Alert Trend Scanner A Smart Indicator Powered by 3 Proven Trading Systems in One! This all-in-one indicator is designed for traders who want to analyze market direction quickly, accurately, and with ease.
It combines 3 time-tested strategies to give you a trading edge:
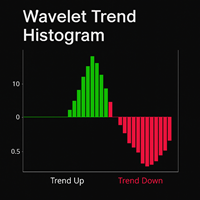
The Wavelet Trend Histogram is a custom MT4 indicator designed to visualize smoothed trend direction using a dual moving average model. It applies Exponential Moving Averages (EMAs) on a user-selected timeframe (MTF capable) and calculates a trend line based on the slower EMA.
The histogram displays positive slope trends in LimeGreen and negative slopes in Crimson , making uptrends and downtrends visually distinct. This allows traders to quickly assess market momentum and directional bias.
The

SessionViz Pro - Professional Trading Session Visualizer
OVERVIEW: Professional indicator designed to highlight trading session times and specific time periods on your MetaTrader 5 charts. Essential tool for session-based trading strategies and time-sensitive market analysis.
KEY FEATURES: Highlight trading session background areas with custom colors Draw vertical lines at specific times for precise entries Multiple instances support - combine different sessions Exclude specific days

Здравствуйте господа трейдеры! Сегодня для вашего внимания я предоставляю свой инновационный индикатор zorro. Индикатор предоставляется в виде ценового канала нисходящего или восходящего тренда. Сигналы на покупку или на продажу генерируются тогда когда цена пробивает горизонтальную линию ценового канала снизу вверх или сверху вниз.Точки входа указаны в виде стрелок. Индикатор может работать на любых таймфреймах и давать хорошую прибыль. Индикатор не перерисовывает и не меняет свои значения. Та
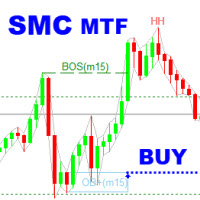
SMC Analyzer Multi-Timeframe is a powerful tool designed to help traders apply Smart Money Concepts (SMC) across multiple timeframes. This indicator identifies key structural points such as market structure shifts (Break of Structure and Change of Character), order blocks, fair value gaps (FVG), and liquidity zones from higher timeframes and overlays them onto the current chart. By aligning these critical SMC signals across multiple timeframes, traders gain a more comprehensive view of instituti
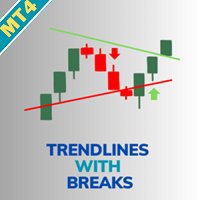
取引のブレイクアウトを強化するために、Trendlines with Breaks by LuxAlgo MT5を使用してください。これは、ピボットベースの革新的なインジケーターで、動的なトレンドラインを自動的に描画し、リアルタイムのブレイクアウトを強調します。TradingViewの人気LuxAlgoスイートから派生し、そこで100,000以上の使用とポジティブレビューを集め、サポート/レジスタンスレベルの検出精度で評価されています。RedditやYouTubeなどの取引コミュニティで、非再描画オプションとカスタマイズ可能なスロープで称賛され、このツールは外汇、株式、暗号トレーダーにトレンド反転と継続を捉える力を与え、ユーザーはエントリータイミングの改善と偽信号の減少を報告—ボラティル市場で勝率を10-20%向上させることが多いです, スペキュラティブな動きではなく確認されたブレイクアウトに焦点を当てることで。その利点には、アグレッシブなエントリーのためのブレイクアウトポイントの正確な識別、市場条件に適合する適応型トレンドラインの急峻度、常時監視なしで先を行く統合アラートが含まれ、ス
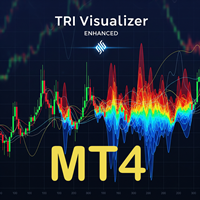
TRI Visualizer Enhanced - 熱力学的市場分析 概要 TRI(Thermal Range Indicator)Visualizer Enhanced は、従来のテクニカル分析を超越した、物理学の熱力学理論を応用した稀有なマーケット分析インジケーターです。 市場の価格変動を「熱力学的エネルギー」として捉え、これまで見落とされていた市場の微細な変化を高精度で検出します。
革新的な仕組み 1. デュアル計算エンジン クラシックTRIモード 基本公式: |終値-始値| + (高値-安値) ローソク足の実体とヒゲを統合した純粋なボラティリティ測定 シンプルで直感的、あらゆる市場環境で安定動作 熱力学的TRIモード(独自開発) 価格加速度 :2次微分による価格変化の勢いを測定 出来高変化率 :相対的な出来高の変化を動的に評価 ポジションエネルギー :正規化された価格変動エネルギーを計算 熱力学的係数 :物理学の熱力学法則を市場分析に応用 2. 高度な平滑化システム SMA(単純移動平均) :基本的なノイズ除去 EMA(指数移動平均) :最新データ重視の平滑化

概要 PriceTime Navigator は、 MT4インジケーター です。 OTEゾーン(プレミアム/ディスカウント+EQ50) 、 等高値/等安値(Equal High/Low)+流動性スイープ(Sweep) 、 日次アンカードVWAP の3つのICTスタイル要素を、BOS/CHOCH・FVG・OB・SDなどの構造ツールと統合し、明快な コンフルエンス(合流)マップ として表示します。自動売買は行いません。裁量・ルールベース双方の判断支援に特化しています。 コアモジュール OTEゾーン+EQ50 :直近の主要スイングから62–79%の最適エントリー帯と、50%の均衡ラインを自動描画。 Equal High/Low+Sweep :等高値/等安値のクラスターを表示し、**スイープ(ヒゲで抜けて終値が戻る)**を検知して通知。 日次アンカードVWAP :毎日リセット。価格が“価値”に対してどこにあるかを可視化。ATRに基づく近接判定も可能。 コンフルエンスとマスターシグナル 重み付けスコア( 価格/構造/時間 )+オプションの 上位足バイアス(HTF bias) (H4/D1のMA2
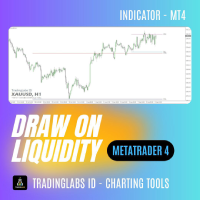
Draw On Liquidity (DOL) – PDHL, PWHL & Kill Zones Liquidity levels often act as magnets for price movement. The highs and lows of the previous day (PDHL) and week (PWHL) are key reference points where stop orders and institutional activity tend to cluster. Identifying these levels manually is time-consuming and prone to error. The Draw On Liquidity (DOL) indicator automatically plots these essential levels on your chart and highlights high-probability trading windows through session kill zones.
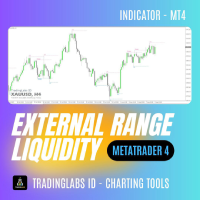
External Range Liquidity - Market Structure Mapper Objectively reading market structure is the foundation of any successful trading strategy. However, manually identifying Swing Highs/Lows, Higher Highs (HH), or Lower Lows (LL) is often subjective and confusing, especially for developing traders. The External Range Liquidity indicator is your complete solution. This tool automatically detects and labels these crucial market structure points directly on your MT4 chart. It provides you with a clea

Mirror Dominance
Назначение: визуально сравнить силу двух валютных пар и ловить моменты смены доминирования. Индикатор строит в отдельном окне две зеркальные линии для выбранных пар, показывает их схождение/расхождение и даёт сигналы на пересечениях (маркеры на основном графике). Есть Alert и Push-уведомления (по желанию), а также мини-метка виртуальной прибыли последнего сигнала.
Автор: Alexander Lapin | Платформа: MT4 Входные параметры (основные)
Pair1 / Pair2 — выбор двух валютных пар из

BONUS INDICATOR HERE : https://linktr.ee/ARFXTools
Trading Flow Using Fibo Eminence Signal 1️⃣ Wait for the Fibonacci to Auto-Draw The system automatically detects swings (from high to low or vice versa) Once the Fibonacci levels appear, the indicator sends an alert notification “Fibonacci detected! Zone is ready.” 2️⃣ Check the Entry Zone Look at the ENTRY LINE (blue zone) This is the recommended SELL entry area (if the Fibonacci is drawn from top to bottom) Wait for the price to enter

Nirvana Trend — マルチタイムフレーム確認とリスク管理支援機能を備えたトレンド・インジケーター 概要
Nirvana Trend は、フィルタリングされたシグナル、マルチタイムフレームでの確認、ボラティリティ(ATR)に基づく自動ストップ/エグジット水準を提供し、取引の意思決定プロセスをより体系的にする分析用インジケーターです。日次/累計ドローダウンの制限などがある環境で運用する場合、本ツールは個人のルールおよびリスク管理フレームワークの遵守をサポートします。 利用シーン フィルタ済みシグナルに基づくエントリー/エグジットの構築 複数時間足間でのシグナル整合 市場ボラティリティに応じたストップロス(SL)距離の標準化により、事前定義リスクに合わせたポジションサイズ調整 設定可能なターゲットによる段階的なエグジット計画 主な機能 マーケットノイズをフィルタした方向性トレンドシグナル 上位時間足との整合を確認できるカスタマイズ可能なマルチタイムフレーム・ダッシュボード ATR に基づく自動ストップロス(SL)計算と、ポジションサイズ算出に役立つ SL/ターゲット距離(pip

プロトレーダーおよび評価型アカウント(Prop)向けリスク管理・制限監視インジケーター 本ツールは、リスク管理と各種リミットに関する情報をチャート上に表示するのみで、より集中した意思決定をサポートします。インジケーターはポジションの新規/決済/変更を行わず、エキスパートアドバイザー(EA)と干渉しません. 機能 日次および累計ドローダウンの監視 残高(Balance)または有効証拠金(Equity)を基準に日次/累計DDを計算・表示(設定可能)。 設定したリミットまでの残り割合を表示。 チャート上のクリーンでプロフェッショナルなパネル サマリー表:Balance、Equity、現在のP/L、日次/累計DD、アラート閾値。 判断に集中できる読みやすいUI。 リスクに基づくポジションサイズ パーセンテージ/固定金額のリスクと設定したストップロスに基づき概算ロットを算出。 R:R(リスクリワード)比とエントリー、SL、TPをチャートに表示。 アラートと通知 日次/累計DDの閾値に近づいた際にアラート(閾値は設定可能)。 価格がSL/TPに到達、またはその他の定義済みイベント発生時に通知。
レンジブレイクアウトアラートインジケーター - ユーザーガイド この指標が示すもの レンジブレイクアウトアラートインジケーターは、特定の期間における価格レンジを識別し、価格がそのレンジを突破した際に取引シグナルを生成します。このインジケーターは、ブレイクアウトや平均回帰の機会を利用したいトレーダーのために開発されました。 仕組み 1. 範囲検出 時間ベースの間隔 : インジケーターが価格変動を追跡する特定の時間枠(例:10:00 - 12:00)を設定します。 範囲制限 : この期間中、最高値と最低値が範囲の限界となります 視覚的な表示 : 青い線は間隔の境界を示し、縦線は開始/終了時刻を示します 2. 信号生成 このインジケーターは、2 つの異なる取引戦略を提供します。 トレンドモード ( InpMeanReversion = false ) ハイブレイク : ライムグリーンの上矢印 → 買いシグナル(価格がレンジを上抜ける) ローブレイク : 赤い下矢印 → 売り

プロフェッショナルなスムージング、明確なアラート、複数の時間枠のサポートを備えた、色分けされたスマート移動平均で、日常的なトレーダー向けに設計されています。
## 簡単に言うと、何をするか - チャート上に移動平均線を描きます。 - 線の色は方向によって変わります。 - 青=上昇傾向 - 赤=下降トレンド - 黄色 = フラット/ニュートラル - ラインの方向が変わったときにアラートを送信します (オプション)。 - 現在の時間枠内で作業するか、より明確にするためにより長い時間枠を「借りる」こともできます。
トレーダーが愛する理由 - ノイズ除去: クラシックまたは高度なスムージング ツール (SMA、EMA、HMA、KAMA、T3 など) を選択します。 - 兆候は明らかです。色を見ればすぐに傾向がわかります。 - 柔軟性: より一貫性のある動作のために、生の価格設定または平均足の価格設定を使用します。 - 軽量: ライブ グラフィックで高速かつ応答性に優れるように設
MetaTraderマーケットが取引戦略とテクニカル指標を販売するための最適な場所である理由をご存じですか?宣伝もソフトウェア保護も必要なく、支払いのトラブルもないことです。これらはすべて、MetaTraderマーケットで提供されます。
取引の機会を逃しています。
- 無料取引アプリ
- 8千を超えるシグナルをコピー
- 金融ニュースで金融マーケットを探索
新規登録
ログイン