 MetaTrader 5
 エキスパート
 インディケータ
 ライブラリ
ライブラリ
 ユーティリティ
 ウィジェット
 ルール
ルール
YouTubeにあるマーケットチュートリアルビデオをご覧ください
ロボットや指標を購入する
仮想ホスティングで
EAを実行
EAを実行
ロボットや指標を購入前にテストする
マーケットで収入を得る
販売のためにプロダクトをプレゼンテーションする方法
MetaTrader 4のためのテクニカル指標 - 67
 以下にリストされているテクニカル指標からのシグナルは、MetaTrader4プラットフォームで取引を開始および終了する際に重要な役割を果たします。
指標の本質は、価格変動の予測を目的とした金融銘柄価格の数学的変換です。
以下にリストされているテクニカル指標からのシグナルは、MetaTrader4プラットフォームで取引を開始および終了する際に重要な役割を果たします。
指標の本質は、価格変動の予測を目的とした金融銘柄価格の数学的変換です。 
STO Currency Strength Meter uses Stochastic Oscillator to monitor how strong a currency is, or in other words, if it's being bought or sold by the majority compared to the other currencies. It displays the strength-lines of the currencies of the pair (base and counter currencies of the chart) with changeable solid lines. Also, you can add up to five additional currencies to the "comparison pool". If you want to look and compare, for example, EUR, USD and JPY, it will only look at the EURUSD, USD

PDP indicator is used for: defining price probability distributions. This allows for a detailed representation of the channel and its borders and forecast the probability of a price appearing at each segment of its fluctuations; defining the channel change moment.
Operation principles and features
PDP analyzes a quote history on lower timeframes and calculates a price probability distribution on higher ones. Forecast algorithms allow the indicator to calculate probability distributions and mov

This Supply & Demand indicator uses a unique price action detection to calculate and measures the supply & demand area. The indicator will ensure the area are fresh and have a significant low risk zone. Our Supply Demand indicator delivers functionality previously unavailable on any trading platform.
Trading idea You may set pending orders along the supply & demand area. You may enter a trade directly upon price hit the specific area (after a rejection confirmed).
Input parameters Signal - Set

Two MA クロスオーバーは、 移動平均クロスオーバー戦略 に依存するトレーダー向けに特別に設計された強力な通知システムです。この完全に自動化されたインジケーターは、包括的なアラート システムとして機能し、重要な取引イベントを決して見逃さないようにします。好みのパラメーターに基づいて移動平均のクロスオーバーを検出すると、モバイル デバイスや電子メールに通知を送信し、コンピューターに音付きのポップアップ アラートを表示します。 その注目すべき機能の 1 つは、最も人気のある移動平均クロスオーバー戦略との互換性であり、この戦略を採用するトレーダーにとって貴重なツールとなっています。このインジケーターはチャート上に移動平均線を自動的に描画し、クロスオーバー イベントを視覚的に確認できます。 「買いシグナル」でも「売りシグナル」でも、市場の動きに関する情報をタイムリーに受け取ることができます。 Two MA Crossover の柔軟性により、好みに応じて各通知方法を有効または無効にすることができます。モバイル デバイス、電子メール、ポップアップ アラートなど、さまざまな通知チャネルから選択
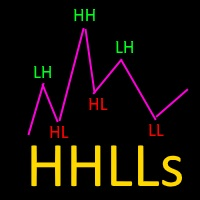
Based on Vitali Apirin's idea, here is a momentum indicator that he describes as a tool to help traders determine the direction of a trend. If the green line is over the red line, the trend is upward; if the red line is over the green one, the trend is downward. The indicator is made up of two separate calculations: the HHs or higher high stochastic, and the LLs or lower low stochastic, which together comprise the HHLLs. Vitali Apirin uses ideas he discovered while studying the stochastic oscill
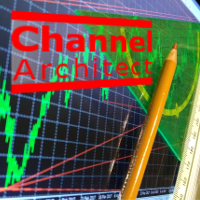
This indicator calculates and draws lines over the chart. There are two types of channels: Channel A: the mainline is drawn using local lows for uptrends and local highs for downtrends Channel B: the mainline is drawn using local highs for uptrends and local lows for downtrends The parallel lines of both types are built using the max. fractal between the base points of the mainline. There are a few conditions, which have to be fullfilled and can be changed by the parameters (see also picture 4):

The Renko_Bars_3in1 is designed for plotting 3 types of Offline Renko charts. Standard Renko Bar (the reversal bar is twice the size of the bar). Renko Range Bar (the size of all bars is the same). Renko Bars with the ability to adjust the size of the reversal bar. Attention : The demo version for review and testing can be downloaded here . Note . A chart with the M1 period is necessary to build an offline chart. When the indicator is attached to a chart, the offline chart is opened automaticall

Brief Description of the All Trend Lines Indicator The indicator analyzes the wave structure of the market. What it displays on the chart: First. Wave pivots (semaphores)
• Red markers – wave highs
• Yellow markers – wave lows
• Yellow-green markers – additional local extremes Second. Trend lines
• Purple/blue lines – trends based on highs (resistance/support)
• Beige/green lines – trends based on lows
• Lines are built automatically by connecting wave pivots of the same type Third. Main trend

Colored trend indicator advanced is a trend indicator that is based on Fast Moving Average and Slow Moving Average and also uses RSI and Momentum to give a trend strength in percent. It is aimed to find more healthy trends with this indicator. This indicator can be used alone as a trend indicator.
Colors (Default) Green = Uptrend (Default) Red = Downtrend No color = No trend, no good trend
Indicator Parameters WarnPosTrendchange: Warns you when the trend may change. FullColor: See screenshot.
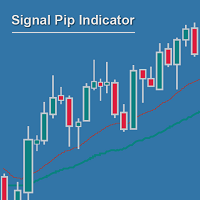
Measuring the distance between two MAs can be much more powerful and reliable than waiting for crossing MAs, and then again for confirmatory setups... If you no longer want to wait for MA crosses as being too late for good entry positions, you are right with the Signal Pip Indicator.
You are supposed to set an alarm for the distance between two MAs, fast & slow, whereas a 3rd confirmatory MA can be added as additional trigger & a fourth to filter out.
You are able to select to be alerted when t

Easy to use trend indicator. Only one adjustable parameter that does not require optimization, which is responsible for the timeframe of the second line of the indicator. It can take three values: current - the second line is not calculated, one higher - one timeframe higher that the current one, two higher - two timeframes higher than the current one. The system for determining the market direction is based on a proprietary method, which uses the two most effective standard indicators (CCi and
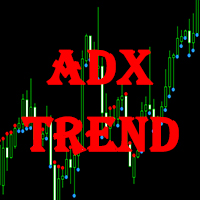
This indicator displays the signals of the ADX indicator (Average Directional Movement Index) as points on the chart. This facilitates the visual identification of signals. The indicator also features alerts (pop-up message boxes) and sending signals to e-mail.
Parameters Period - averaging period. Apply to - price used for calculations: Close, Open, High, Low, Median (high+low)/2, Typical (high+low+close)/3, Weighted Close (high+low+close+close)/4. Alert - enable/disable alerts. EMail - enable

The Master Pivot indicator is a very interesting generator of static levels based on historical percentage variation. The levels are completely customizable changing the input numbers. Period can also be modified to select the preferred Time Frame. The color is flexible so you can change color easily, we recommend a red color upper and lower green for a contrarian style, conversely instead for a style follower trend. This indicator used in a confluent way offers some really interesting ideas.
I

Pivot Confluence Zones は、 MT4およびMT5用のテクニカル分析インジケーター で、 ピボットポイント 、 フィボナッチリトレースメント 、 ATR 、 ADR を1つの取引ワークスペースに 組み合わせることで 、 リトレースメントゾーン 、 反転エリア 、 サポートおよびレジスタンスレベルを 識別 するように 設計されています。単一のテクニカルツールに頼るのではなく、このインジケーターは 複数の取引レベルが重なる コンフルエンスゾーン を検索し 、トレーダーが市場の注目度が高まる可能性のあるエリアを評価するのに役立ちます。価格分析を強化するために、このインジケーターには 最大45のローソク足パターン 、 移動平均トレンドフィルター 、インタラクティブな描画ツール、および設定可能なレベルタッチアラートも含まれています。Pivot Confluence Zonesは、 外国為替トレーダー 、 金(XAUUSD)トレーダー 、 インデックストレーダー 、 暗号通貨トレーダー 、 スキャルパー 、 デイ トレーダー、スイングトレーダー 、 プライス

This unique multi-currency strategy simultaneously determines the end of the trend, entry points and the expected take profit levels for each trade. The indicator can determine entry points on any trading period from M1 to D1. For the convenience of users, the indicator renders the entry point (in the form of an arrow), recommended take profit levels (Fast Take Profit, Middle Take Profit, Main Take Profit, Global Take Profit) and the Stop Loss level. The detailed guide on how to use the indicato

This multicurrency indicator is the Lite version of the Cosmic Diviner Reversal Zone Pro indicator. The indicator is based on original formulas for analyzing the volatility and price movement strength. This allows determining the overbought and oversold states of instruments with great flexibility, as well as setting custom levels for opening buy or sell orders when the overbought or oversold values of the instruments reach a user-defined percentage. A huge advantage of Reversal Zone Lite is the

The indicator shows possible reversal points. It is based on several candlestick patterns + an oscillator. The indicator is easy to use: install it and watch arrows. Sell when a red arrow appears and buy when a blue arrow appears. If you set the Alert option in the indicator parameters to True, the indicator will show an alert window with information about the currency pair, on which the signal has formed. ALERT = True/False; Attention ! It is not the Holy Grail for trading, errors may happen.

This is a ready-made strategy for binary options! Support/resistance levels are used to form a signal, while a number of built-in indicators are applied to sort out incoming signals. An arrow appears during a signal formation. If the signal is active, then the arrow remains after the close of the bar; if the signal is not strong enough, the arrow disappears. With a small number of signals and a small trading time, you will not need to sit all day at the computer, especially since you can enable
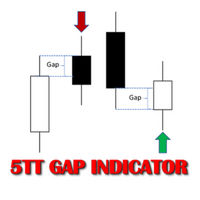
In Forex trading, the Open price of a new period is usually the same as the close price of the preceding one. If a new period opens at a price significantly different (higher or lower), this gives way to a Gap scenario. This suggests an imbalance in the price action. Price tends to move during the new period to cover the gap created. This move presents consistent buying and selling opportunities; hence potential to make profit. There are two types of Gap scenarios 'Gap Up' - Open price of the ne

ScalpingPro is a new indicator for professional traders. The indicator is a ready-made scalping strategy. The algorithm calculates a micro trend, then searches for price roll-backs and forms a short-term trading signal according to a market price. The indicator consists of a data window and a graphical signal on the chart in the form of an up or down arrow. The data window displays the current trading symbol, spread and appropriate trader's actions: WAIT, SELL and BUY .
Advantages the indicator

The Vortex Indicator was inspired by the work of an Austrian inventor, Viktor Schauberger, who studied the flow of water in rivers and turbines. Etienne Botes and Douglas Siepman developed the idea that movements and flows within financial markets are similar to the vortex motions found in water. The Vortex Indicator was also partly inspired by J. Welles Wilder's concept of directional movement, which assumes the relationship between price bars gives clues as to the direction of a market. This i

This indicator shows main trend, entry zone and exit zone. This is a muti-timeframe indicator, so it is always repainting in the current period of the higher timeframe.
Features Colorful Histogram: it indicates the main trend, the tomato means the market is bearish,and the sky blue means the market is bullish. Inner Blue Bands: it is entry zone for entry market, the market is relatively safe for entry. Outer Yellow Bands: it is exit zone for exit market, the market is oversold or overbought.

The Discrete wavelet transform indicator is an enhanced implementation of the numerical and functional analysis for MetaTrader 4, the discrete wavelet transform method (DWT). The specific feature of DWT is the way the wavelet is represented in the form of a discrete signal (sample). DWT is widely used for filtering and preliminary processing of data, for analyzing the state and making forecasts for the stock and currency markets, for recognizing patterns, processing and synthesizing various sign
DSProFx Momentum Indicator is a forex indicator that works based on market price momentum calculation which shows combination of two different timeframes.
Concept DSProFx Momentum Indicator works in any timeframe with the main concept is giving momentum index to each candle or bar which is calculated from the Bar Volume , LookBack Period and Candle Direction (Bearish or Bullish).
Formula Momentum Index = Sum (Bar Volume * Weight) / Total Weight.
Features DSProFx Momentum Indicator is a separa

DYJ Sharp advanced algorithm that detects new trends and current trend continuations for use as an entry and exit strategy. The strategy display the SHARP trend demarcation area. This SHARP area has high HighLine and low LowLine. Falling of high below HighLine of SHARP and then falling of close below LowLine of SHARP can be interpreted as a signal to sell. Rising of close above HighLine of SHARP and then rising of low above LowLine of SHARP can be interpreted as a signal to buy. The signal for e

All patterns from Encyclopedia of Chart Patterns by Thomas N. Bulkowski in one indicator. It draws an up or down arrow whenever a pattern is identified. Patterns are selected in the drop-down list of the Pattern variable (located at the beginning of the properties window). The indicator has numerous external parameters, some of them apply to all patterns, while others are selective. To see more information on the parameters used for the selected pattern, enable the ShowHelp variable (located at
The indicator places Semaphore points on the maximum and minimum of a higher, medium and lower period. It includes A,B,C Triangles for easier spotting of reversal chart pattern which occurs very frequently and has a very high success ratio. Both Semaphore and A,B,C Triangles have Alerts and Push notifications to a mobile device when they occur on the chart. These indicators are very useful for breakout trading and spotting support/resistance levels which gives good opportunities for positions.

Market Trend - a comprehensive system for determining the trend direction. Analyzes the market using a formula which considers the values of multiple technical indicators and other trading strategies. IT determines not only the current trend direction, but also its movement strength. The indicator is intuitive and very easy to use. The information on the current trend direction and its movement strength are displayed on the chart. If the indicator shows "UP!" then an uptrend is currently present
DYJ TRENDWAVE features an advanced algorithm that detects new trends and current trend continuations for use as an entry strategy. DYJ TRENDWAVE's volatility is based on the power of buyers and sellers, it grabs total body size of candles and identifies the battle between buyers and sellers as a percentage of the total volume, like Sellers: (-)100% and Buyers: (+)100%. This information can be used for any entry and exit strategy. For bullish/Long Pin bar it is below the price line, for bearish/S

The indicator has the following features Predictive Trend (Histogram) - it uses an advanced predictive probability and statistics calculation plus linear regression to know the possible trend. This must be used with at least 3 timeframes for a more accurate reading of the trend: D1, H4, H1. In some cases (subjective), you may want to use M5 for a more precise reading. Velocity (Dotted Line) - Green dotted line indicates a speed of price movement upward. Red dotted line indicates a speed of price

Sign of victory is a new indicator based on three digital filters. The indicator plots three histograms in a separate window, and also draws an arrow on the price chart. Each histogram is a digital filter that converts quotes and decomposes them into trends: buy or sell. The examples of market entries using this indicator are shown on the screenshots using arrows. This indicator can help traders better assess the market situation.
Sign of victory features The indicator is perfect for scalping a

This indicator is designed to help traders in determining the market entry and exit points. It is very easy to use: open s BUY deal when the up arrow appears and open s SELL deal when the down arrow appears. The indicator is based on the basic indicators (MA, MACD, RSI) as well as original algorithms. The indicator does not redraw, arrows appear when a new candle opens. Input Parameters:
strength - indicator period EnableAlerts - enable/disable alerts EmailAlert - send notifications to email wh

This indicator shows the current market situation relative to the price volatility channel, its external and internal boundaries, displays the last direction of the price movement. The main purpose of the indicator is to identify the trend movement and its boundaries. With a wide channel, it can be used for determining the initial price movement waves. It works on any instrument and any time frame of the chart. It works in 2 different modes: The first mode shows any changes in the channel when t
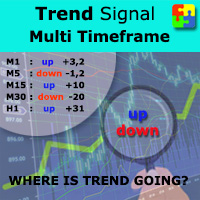
Do you want to always know in a quick glance where price is going? Are you tired of looking back and forth between different timeframes to understand that? This indicator might just be what you were looking for. Trend Signal Multitimeframe shows you if the current price is higher or lower than N. candles ago, on the various timeframes. It also displays how many pips higher or lower current price is compared to N. candles ago. Number N. is customizable The data is shown in a window that you can m
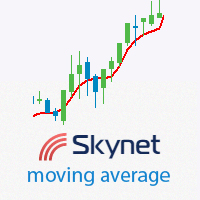
This indicator displays the trend direction, the averaged price value and flat areas. It is used to determine the averaged price value with little or no delay. During a flat, its line is often smooth, and it follows the trend during a descending or an ascending movement. The best charts for the indicator are the range\renko charts, which do not have rounded borders of price changes. Various types of moving averages and certain types of digital filters were used as a prototype. Compared to variou

FutureTrade is one of the few indicators that predicts the price right on the price chart. The indicator calculation algorithm is based on the fast Fourier transform. Given the oscillatory behavior of the price, the Fourier function predicts its future behavior. The indicator should be attached in the usual way to a chart with the trading instrument specified symbol and with the M15 timeframe. This timeframe is the most optimal for working with any symbols. Once started, the indicator calculates
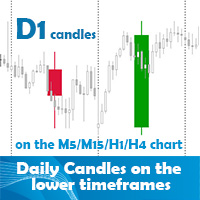
Daily candles on the lower timeframes indicator allows the user to display the daily timeframe on the lower timeframe chart. The indicator shows the daily candles on the chart from yesterday. It does not represent the today's daily candle. You can position and color the candles with or without price labels (High/Low/Open/Close of the day) and High/Low lines. It can help to see the bigger picture if you are a day trader or scalper. Obviously the best use is on the lower than daily timeframes. The

The objective of the Crypto-Box Indicator is to determine the most efficient entry in trends. . It works for all purposes, standing out in the main cryptocurrencies: BitCoin, LiteCoin, Ethereum and Emercoin. And in Currencies: EURUSD, USDJPY и GBPUSD. The indicator is designed to find the best conditions for financial instruments. Detects acceleration patterns in prices in areas of supports and resistances. The development team is constantly improving the functionality of the Indicator and we th

ストキャスティクス オシレーターのマルチ通貨およびマルチタイムフレームの変更。パラメータで任意の通貨とタイムフレームを指定できます。パネルには、シグナルとメイン (ストキャスティクス クロスオーバー) のラインの現在の値と交差点が表示されます。また、インジケーターは、買われすぎレベルと売られすぎレベルを横切るときに通知を送信できます。ピリオド付きのセルをクリックすると、このシンボルとピリオドが開きます。これが MTF スキャナーです。
通貨強度メーター (CSM) と同様に、ダッシュボードは、指定された通貨を含むペア、またはその通貨を基本通貨とするペアを自動的に選択できます。インジケーターは、「ペアのセット」で指定されたすべてのペアで通貨を検索します。他のペアは無視されます。これらのペアに基づいて、この通貨の合計ストキャスティクスが計算されます。そして、その通貨がどれだけ強いか弱いかを確認できます。
ダッシュボードをチャートから非表示にするキーは、デフォルトでは「D」です.
パラメータ %K Period — K ラインの期間。 %D Period — D ラインの期間。 Sl

DIFF-2Pairs detects divergences of correlated pairs considering lots balancing (+ built-in strategy tester ). The indicator has a system for measuring the divergence of correlated pairs by various methods to estimate the value of the differential curve: the system can measure performance. statistical analysis to determine the optimal SL and TP. exporting data to a CSV file. Currently, the indicator supports the following deviations of the correlated pairs: The standard deviation is the measur
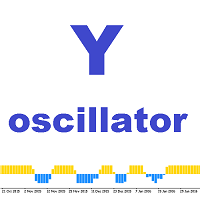
Y oscillator この指標は、時間内の価格変動率の数式です。オシレーターを使用する際の基本的な概念は、市場の買われ過ぎと売られ過ぎの状態です。指標線がその上限に近い場合、市場は買われ過ぎと見なされます。売られ過ぎのゾーンは、その下の境界にインジケーターラインが存在することを特徴としています。線を越える瞬間も考慮されます。インジケータは、ダイアログボックスを表示したり、アドレスに電子メールを送信したり、携帯端末に通知したりすることで、これを通知します。
設定の説明 y_Period-インジケーター期間。 価格-使用される価格のタイプ。 アラート-ユーザーデータを含むダイアログボックスを表示します。 Text_BUY-買いシグナルのカスタムテキスト。 Text_SELL-売りシグナルのカスタムテキスト。 Send_Mail- [メール]タブの設定ウィンドウで指定されたアドレスにメールを送信します。 件名-電子メールの件名。 Send_Notification- [通知]タブの設定ウィンドウでMetaQuotesIDが指定されているモバイル端末に通知を送信します。
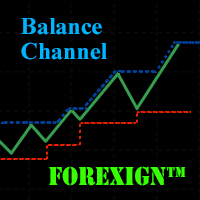
The Balance Channel indicator shows changes in the dynamics of the account balance on closed deals, and also graphically displays the current result of open positions in the form of the last segment on the line. The balance line is enclosed in the boundaries of the price range, the period of which can be set by a separate parameter "Period". This option can clearly show when the drawdown reaches a given critical value. The balance line can be calculated both in the account currency and deals mad

Trading volume and volatility change for different currency pairs, depending on the movement of the clock hands. You will be able to trade more efficiently if you know which currency pairs are at the center of attention at one time or another. Timing plays a very big role when trading currencies. The indicator shows the trading sessions of the largest exchanges in the world. The operating time is displayed in the form of a countdown before the opening time and the closing time according to UTC (

Heiken Ashi Smoothed Strategy is a very simple but powerful system to get forex market trend direction. This indicator is actually 2 indicators in 1 pack, Heiken Ashi and Heiken Ashi Smoothed Moving Average both included. Because HA (Heiken Ashi) and HAS (Heiken Ashi Smoothed) are calculated in the same one system event with necessary buffers and loop only, so it is the FAST, OPTIMIZED and EFFICIENT HA having the combined indicator of MetaTrader 4. You can choose to display HA and HAS in the sam
The Relative Strength Index (RSI) was developed by J. Welles Wilder and is a momentum oscillator that identifies overbought and oversold conditions. It is also a popular choice for many traders helping them find entries into the market.
How it Works The simplest way to use the Relative Strength Index is to wait for an overbought or oversold condition and then enter into a trade when the RSI indicates that price is resuming in the dominant direction of the trend. Buy signals : For the first cond
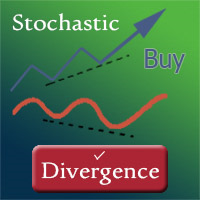
The indicator displays divergence and convergence on all instruments. It works on all timeframes. After finding divergence/convergence, the indicator draws a Buy or a Sell arrow according to the detected signal.
Settings Buy - show buy signals Sell - show sell signals Divergence - show divergence on the chart Convergence - show convergence on the chart KPeriod, DPeriod, Slowing - Stochastic settings drawPriceTrendLines - draw a line (of divergence/covergence) on a price chart drawIndicatorTren
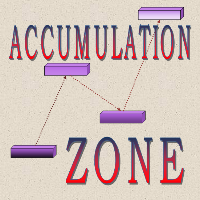
The indicator finds price accumulation areas in a specified price range and time interval. By setting time to 10-18:00 and area width to 40 points, the indicator finds the area having the specified width that was most often touched by the candles in this time interval. Until 19:00, the area within the current day can move. With the first tick from 19:00, the main area is fixed and not re-painted. If Continue zone is enabled, the area having another color is set on this level after fixing the mai

A trend indicator based on the Ichimoku Kinko Hyo and MACD. The ICloud Scalper Trend Indy is an improved variant of the Ichimoku Kinko Hyo and MACD, which shows the moment of trend following quite accurately. It is often used as a signal filter. Combination of two indicators makes a better use of these advantages: Ichimoku Kinko Hyo identifies the trend, while MACD determines the short-term movements and signals in the trend direction.
Messages/Sounds (Notifications and sound settings) ON/OFF -

このテクニカル指標は、チャート上のさまざまな 反転ローソク足パターン を使用して、価格変動を自動的に識別および分析します。対応するパターン名とともに矢印記号を描画するので、最新の反転ローソク足パターンを簡単に見つけることができます。このインジケーターを使用すると、チャート分析を迅速に特定し、以前に特定されたローソク足パターンと比較できます。 このインジケーターには、トンボ童子、墓石童子、ハンマー、ピンバーなど、単純なものから複雑なものまで、実装されたさまざまなローソク足パターンが含まれています。これらのパターンは、一般的な傾向と履歴データに基づいてフィルター処理され、信頼性の高いシグナルが保証されます。このインジケーターは、矢印を描画し、チャート上にパターン名を表示することで、特定されたパターンを視覚的に表します。さらに、視覚エクスペリエンスを向上させるために、すべてのオブジェクトの矢印の種類と色を柔軟にカスタマイズできます。 パターン識別機能に加えて、インジケーターはカスタマイズ用のさまざまなパラメーターを提供します。買いシグナルと売りシグナルの色を設定したり、矢印サインの特定の文字
If you are using volume spread analysis, this system will give you a lot of help and features in your analytics. Please watch the video to see all the features.
Features Bars without opening price. Easy to read volume indicator. Bar reader (Bar type - Close type - Volume type - Spread type). Daily and weekly levels (Pivot - Camarilla - Fibo). And more
Indicator parameters Number_Of_Bars - Choose the number of bars you want to appear on the chart Bars_WIDTH - Choose the width of Bars, 1-2-3-4 .

This indicator analyzes in parallel the moving average for multiple currencies and timeframes. It sends a notification when the trends are in alignment for all timeframes. To get better assessment of the trend strength, it shows as well a ratio between the number of pips reached from the current trend and the average of pips reached from the previous trends.
Features Loads automatically historical price data from broker server; Tracks all currency pairs for all timeframes in parallel; Configure
The newest indicator for binary options. The indicator looks for large market turns and gives out qualitative signals for 2 candles ahead. The indicator also works on Forex, but was developed initially under binary options.
After the appearance of the arrow, you receive a notification by e-mail, PUSH notification to the phone or an allert at the terminal.
Signals appear at the beginning of the new bar. Timeframe 1 hour. Expiration period 2 candles.
More than 75% of signals are closed in posi

This indicator is using the Central Limit Theorem in combination with historical volatility and Fibonacci ratios in order to create unique type of chart tool called Projected Volatility Distribution. This tool allows you to perform highly accurate intraday technical analysis where in a split second you can detect overbought and oversold conditions as well as strong trends. In addition you have at your disposal multi-functional panel which shows signals in real time and gives you the ability to o

Fibo Reversals is an indicator which has carefully been put together to attempt to indicate a time period in which an ongoing trend is most probably exhausted and a new trend (actually a reversal trend) inadvertently begins. At this, it should be okay for the manual trader to be on the look out for good trading opportunities.
Input Settings Father Fibo – This Input Determines The Highest Price For The Chosen Input Period. Son Fibo - This Input Determines The Lowest Price For The Chosen Input
xCalper Triad works as a Target scanner tool. Its algorithm calculates price level areas with high precision and instantly. By default, they are automatically identified and the trader normally sets visual parameters only. Explore a new perspective in price action analysis by adding Triad to your setup and surprise yourself.
Main Features Automatic & exclusive Target levels Daily candle representation in all intraday timeframes. Side panel information essential to all traders: Remaining time to

Sidus 指標は取引戦略です。 3つの標準指標に基づく:2つの移動平均(MA)と強度に対する指数(RSI)。インジケーター信号は、移動平均の交差と、50レベルに対するRSIインジケーターの同時配置です。高速移動平均が低速移動平均を上回り、RSIインジケーターが50レベルを上回っている場合、購入が想定されます。動きの速い平均が動きの遅い平均を下回り、RSIが50レベルを下回っている場合、売りが想定されます。
インジケーター設定の説明 bar_limit-指定された数のバーにインジケーターを表示する制限。= 0の場合、使用可能なすべてのバーに表示されます。 Period_FastMA-動きの速い平均期間。 Period_SlowMA-移動平均が遅い期間。 Period_RSI-RSIインジケーターの期間。 ma_method_MA-移動平均平均法。 apply_price_MA-適用された移動平均価格。 apply_price_RSI-RSIインジケーターの使用価格。 アラート-ユーザーデータを含むダイアログボックスを表示します。 Text_BUY-購入シグナルのカスタムテキスト。
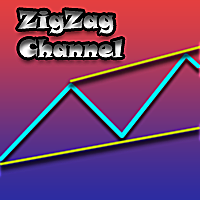
Exclusive Channel on Zig Zag is a channel indicator for the MetaTrader 4 terminal. This indicator plots a channel based on the peaks of the standard ZigZag indicator. If you trade using the ZigZag indicator or channels, then Exclusive Channel on Zig Zag will suit you perfectly.
Advantages of Exclusive Channel on Zig Zag The indicator is perfect for scalping and intraday trading. Suitable for beginners and experienced traders. Works on any financial instruments and markets. Works on all timefram

Reversal Alert Pro インジケーターは、市場の反転領域を自動的に検出するように設計された強力なツールです。モバイル デバイスに直接送信される便利な通知を提供し、音付きのポップアップ アラートを表示します。このインジケーターを取引戦略に組み込むことで、取引ポジションを効果的にフィルタリングできます。さらに、このインジケーターは、CCI、RSI、およびストキャスティクスインジケーターを利用して、生成されたシグナルをさらに改良し、汎用性と適用性を高めるオプションを提供します。 Reversal Alert Pro インジケーターの重要な特徴の 1 つは、すべての時間枠とシンボルに適合することです。好みの取引スタイルや取引する市場に関係なく、このインジケーターはニーズに適応できます。パラメータ設定は使いやすいように設計されており、好みに応じて簡単に設定およびカスタマイズできます。 チャートに適用すると、インジケーターがシグナルを素早く描画し、反転の可能性のある領域を迅速に特定できるようになります。これらのシグナルは、選択した期間、CCI、RSI、および確率的インジケーターによっ
A trend indicator based on the Ichimoku Kinko Hyo and Candlestick. The Scanner Trend Indy is an improved variant of the Ichimoku Kinko Hyo and Candlestick, which shows the moment of trend following quite accurately. It is often used as a signal filter. Combination of two indicators makes a better use of these advantages: Ichimoku Kinko Hyo identifies the trend, while Candlestick determines the short-term movements and signals in the trend direction.
Messages/sounds (notifications and sound sett

This indicator displays the short-term trend direction and flat areas in the same way as the classic Heiken Ashi indicator, but it is not plotted using candles or a moving average, but rather the Skynet Moving Average indicator.
Advantages no delay, or a slight delay when using the 'smooth' parameter. customizable parameters for any price data and timeframes. visualization of the flat and the short-term trend. unlike the classic Heiken Ashi indicator, the frequency of candles changing from bull

The indicator displays potential entry points on a trend, displaying buy level, sell level and golden point which will determine where to get out of the trade or trail your stops. If an entry is detected, the indicator shows and Arrow, either pointing down for Short and up for Long positions. When the golden point is passed during a trade, it will start drawing potential points for trailing, is then up to you how to manage your trade. This indicator has been built for best results on H1 Time fra

The main goal of the indicator is to determine the most optimal points of entry and exit from a trade. The indicator consists of three parts. The first one is arrows displaying the most efficient market entry/exit points. The up arrow is a buy signal, the down arrow is a sell one. The indicator contains an analytical analysis algorithm that includes a set of standard indicator readings, as well as a custom algorithm. The second part is data in the upper right corner (works on М1-D1 timeframes) o
This indicator zone indicator.Indicator displays high and low zone.
Features Green color - Shows movement on the high zone.
Red colr - Shows movement on the low zone. Yellow colr - Shows movement on the zero zone.
How to understand the status:
If the bar is higher than the yellow color line , trend is up. If the bar is lower than the yellow color line , trend is down.
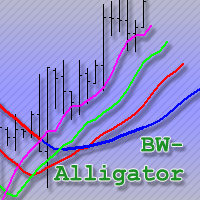
An improved version of the classic Alligator indicator by Bill Williams.
Description The Alligator technical indicator is a combination of moving averages (balance lines). Blue line (Alligator Jaw) is a 13-period smoothed moving average, shifted by 8 bars into the future; Red line (Alligator Teeth) is an 8-period smoothed moving average, shifted by 5 bars into the future; Green line (Alligator Lips) is a 5-period smoothed moving average, shifted by 3 bars into the future; Purple line (Fast Gato
If you are using volume spread analysis, whether your are a beginner or an expert, this system will give you a lot of features and help in your analysis. Please watch the video to see all the features.
Features With one click you will find all the VSA patterns on your chart . Bars without opening price. Easy to read volume indicator. Bar reader (Bar type - Close type - Volume type - Spread type). Daily and weekly levels (Pivot - Camarilla - Fibo). Very light on the trading platform and moving b
The BinaryFiesta indicator has been developed and adapted specifically for trading short-term binary options. The algorithm of the indicator analyzes numerous factors before generating a signal. The indicator is installed in the conventional way. The indicator consists of an information window, which displays the name of the trading instrument, support and resistance levels, and the signal itself ( BUY , SELL or WAIT ). A signal is accompanied by a sound and a pop-up Alert.
Advantages of the in

This indicator is designed for trading pending stop orders at the calculated levels. These levels are marked with the names “BUY STOP” and “SELL STOP”, and corresponding price labels. In addition, the indicator informs the user about the preferred trade direction using arrow, as well as other available means of notification, which can be customized.
Parameters Type of Calculation - type of calculations: Price Close – based on Close prices. Price High Low – based on High and Low prices; Design m
Modification of the Stochastic indicator with several types of alerts added to aid in your search for better opportunities in the market.
Product Features Email Alert Sound alert Push Notification (Alerts can be sent to your mobile phone) Signs on chart Alert box
Indicator Parameters Push Notification - This option enables your MetaTrader 4 to send alerts to your smartphone (IOS or Android). Email Alert - Configure your alerts to receive in your e-mail adress. SignOnChart - Enable drawing aler
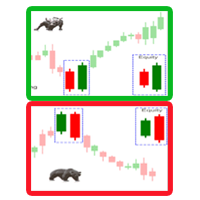
A trend reversal indicator based on the Candlestick Pattern. A candlestick pattern is a movement in prices shown graphically on a candlestick chart that trader can predict a particular market movement. Engulfing Pattern: A reversal pattern that can be bearish or bullish, depending upon whether it appears at the end of an uptrend (bearish engulfing pattern) or a downtrend (bullish engulfing pattern). The Engulfing Of Sparta indicator is an improved variant of the Candlestick Pattern, which shows

通貨強さ 7 テクニカル指標は、トレーダーが最も人気のある 7 つの通貨の強さを測定できるように設計された強力なツールです。この指標は、AUD、USD、EUR、GBP、JPY、CHF、CAD の強さを分析することにより、通貨のダイナミクスに関する貴重な洞察を提供します。チャート上で通貨の強さを線を使用して表し、トレーダーがさまざまな通貨の相対的な強さを迅速に評価できるようにします。 このインジケーターの際立った機能の 1 つは、チャート上に大量の履歴データを描画できることです。この包括的な歴史的観点により、トレーダーは市場の動きをより効果的に分析し、情報に基づいた取引の意思決定を行うことができます。過去の傾向とパターンをより深く理解することで、トレーダーは将来の通貨の動きを予測する能力を高めることができます。 Currency Strength 7 インジケーターは、移動平均データを利用して各通貨の強さを示します。 「+」記号と「-」記号を使用して、それぞれ強い立場と弱い立場を示します。この明確な視覚的表現により、通貨強さシグナルの解釈が簡素化され、トレーダーは市場の状況を迅速に評価で
MetaTraderプラットフォームのためのアプリのストアであるMetaTraderアプリストアで自動売買ロボットを購入する方法をご覧ください。
MQL5.community支払いシステムでは、PayPalや銀行カードおよび人気の支払いシステムを通してトランザクションをすることができます。ご満足いただけるように購入前に自動売買ロボットをテストすることを強くお勧めします。

取引の機会を逃しています。
- 無料取引アプリ
- 8千を超えるシグナルをコピー
- 金融ニュースで金融マーケットを探索