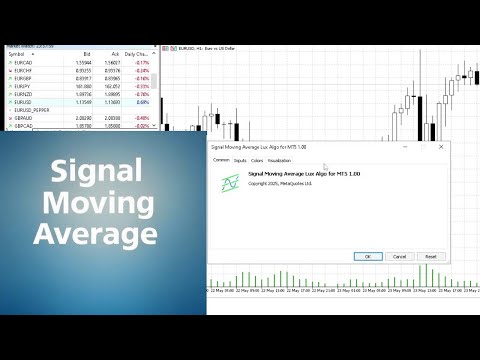
Signal Moving Average Lux Algo MT5
- Indicatori
-
Lorentzos Roussos
 🎱🏓🎷💚☕️
💎 The simplest Neural Network Coding Guide : https://www.mql5.com/en/blogs/post/752324 - Versione: 1.4
Algoritmo Lux per la media mobile Signal per MT5
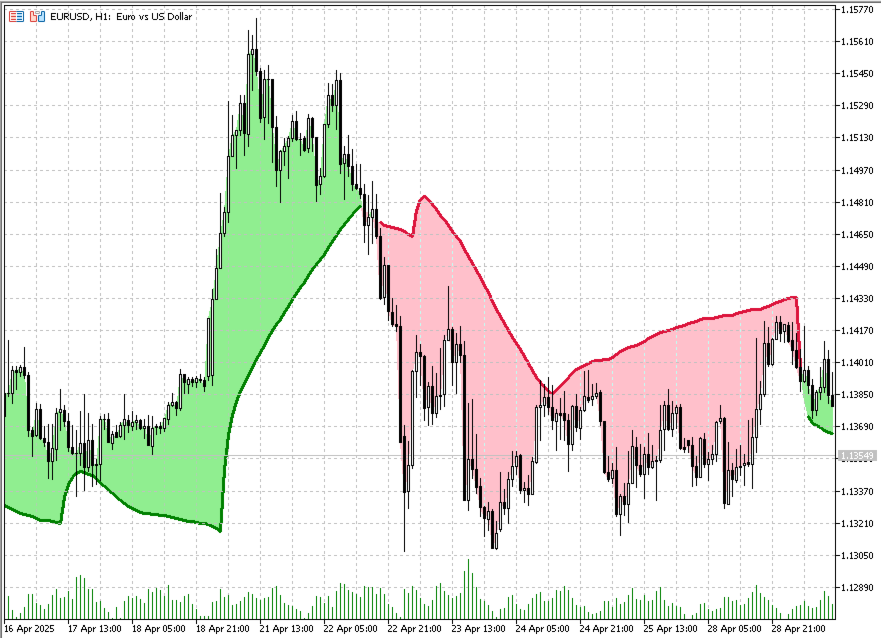
Scopri un indicatore di media mobile unico, progettato specificamente per l'utilizzo della linea di segnale nei sistemi di crossover di media mobile. Questo strumento avanzato si differenzia divergendo dal prezzo nei mercati in range, mentre rispecchia fedelmente una media mobile standard nei mercati in trend. Questa caratteristica aiuta i trader a evitare rumore di fondo inutile e potenziale overtrading dovuto alle fluttuazioni del mercato.
La media mobile divergerà dal prezzo durante i mercati in range e raggiungerà il valore di una media mobile standard durante i mercati in trend.
Le strategie di crossover di media mobile spesso si basano su una linea di "segnale", una media mobile più lenta utilizzata per determinare un trend generale. Questa linea di segnale è abbinata a una media mobile più veloce per filtrare potenziali movimenti a "whipsaw" che si sarebbero verificati dagli incroci tra il prezzo standard e la linea di segnale.
L'indicatore proposto eviterà di incrociare il prezzo divergendo da esso durante periodi più lunghi, riducendo così efficacemente il numero di incroci prodotti tra il prezzo e la linea di segnale.
Il colore dell'area tra il prezzo e la linea di segnale è determinato dalla posizione del prezzo rispetto alla linea di segnale, con un indicatore di colore verde che indica un prezzo superiore alla linea di segnale.
Il colore della linea di segnale, tuttavia, tiene conto se il mercato è in trend o in un range, cambiando solo quando il mercato è in trend.
Indicatore di Lux Algo per la visualizzazione di trading originale


Very decent.